High sell probability on Gold!!! Don’t sleep on it!XAUUSD (Gold) previous bullish momentum that was currently developing slowed down in the early hours of New York trading session today around the resistance level of 3357.80 I sense a big correction coming on Gold especially as higher timeframe (monthly) is already showing multiple candlestick exhaustion which signals profit taking activities after a prolonged bullish trend that has been developing since the major breakout around the $2,000 level. A sell opportunity is Envisaged once our entry criteria is met.
Expect a significant drop in price!
CFDGOLD trade ideas

GOLD: Absolute Price Collapse Ahead! Short!
My dear friends,
Today we will analyse GOLD together☺️
The price is near a wide key level
and the pair is approaching a significant decision level of 3.324.79 Therefore, a strong bearish reaction here could determine the next move down.We will watch for a confirmation candle, and then target the next key level of 3,317.96..Recommend Stop-loss is beyond the current level.
❤️Sending you lots of Love and Hugs❤️

THE KOG REPORT - UpdateEnd of day update from us here at KOG:
An interesting day on gold and to be honest, the plan worked but the whipsawing only allowed us to scalp. Although we had a few decent scalps, we wanted it to go higher, then form a swing at 3320, which it broke above. This region now is one big accumulation, this is not as simple as enter and set TP, unless you're scalping. At the moment, we're above 3310 which is the level that needs to break to go down with a high of 3330 which is the level that needs to hold for us to go lower.
Our set up here is bearish, what we want is to try and capture the stop hunt from above rather than entering and having to watch this chop up and down, then go into drawdown. If it works, it works, if it doesn't, we'll come back next week.
On the chart are the two levels to look for a RIP! With it ranging like this we'll stick with these level and use the red boxes looking for the break!
As always, trade safe.
KOG

GOLD (XAUUSD): Classic Breakout Trading📈GOLD has surpassed and closed above a significant intraday resistance level.
After retesting this level, the price created a small ascending triangle on the hourly chart, and we've observed a confirmed breakout of its neckline.
I plan to go long on the pair during the retest, anticipating further growth, with the next resistance target at 3327.

XAUUSD Will BIG FLYXauusd buy from 3320
Tp1 3330
Tp2 3340
Tp3 3350
Stope lose 3312
Trade at your own risk

XAUUSD Analysis Of next waveSo the Analysis of gold is that if 3343-3345 holds we can travel to 3392-3388 as mentioned there the wave completion target is there

Gold prices are on the rise again!Market news:
In the early Asian session on Friday (July 18), spot gold fluctuated in a narrow range and is currently trading around $3,336 per ounce. London gold prices staged a thrilling "deep V" market yesterday, hitting a daily low of $3,309 during the session and recovering to 3,339 at the end of the session. Strong US retail sales and employment data drove the dollar to rebound and US Treasury yields to rise, putting pressure on interest-free assets such as gold. Despite this, geopolitical tensions and rising tariff risks are still providing bottom support for the gold market. The international gold market is currently in a multi-game of Fed policies, US economic data, US dollar trends and tariff policies. The Fed's position of postponing interest rate cuts, strong retail and employment data, and the rise in the US dollar and US Treasury yields have suppressed gold prices in the short term. This trading day needs to pay attention to the preliminary value of the University of Michigan Consumer Confidence Index in July and US real estate market data, pay attention to the G20 Finance Ministers and Central Bank Governors Meeting hosted by South Africa, and pay attention to news related to the international trade situation.
Technical Review:
Gold closed with a small positive line with a long upper shadow yesterday. Although it ended the continuous negative trend, it still faced sideways resistance below 3374, and the overall market still needs to be treated as a shock consolidation. From a large cycle perspective, gold has entered a convergent triangle consolidation phase of nearly three months. Among them, the lower track support line gradually moved up to above 3310. The support strength of this position continues to increase as the consolidation time lengthens. If the price touches or approaches this point, you can decisively try to buy the bottom layout.For two consecutive trading days, gold has been consolidating in a larger range of 3377/3310, and finally closed at the starting point of the daily Bollinger band middle track at the end of the trading day. Gold returned to the middle axis of the range at 3340. The daily chart Bollinger band middle track, the RSI indicator middle axis flattened, the four-hour chart hourly chart Bollinger band middle track, and the RSI indicator neutral middle axis. On Friday, the layout of the day will still be based on a wide range of fluctuations. Look at the 3320/3360 range first. Alternating buying and selling cycles, large range of wide fluctuations!
Today's analysis:
In the past two days, gold has always risen in the US market due to news. Last night, Trump called on the Federal Reserve to cut interest rates, and gold rose again. However, judging from the recent market, the market stimulated by the news is still unsustainable. Since gold has rebounded now, gold will continue to sell at a high level in the early trading.
Excluding yesterday's market affected by Trump, the gold price operation pattern this week is close to perfect, and it has been steadily operating under the suppression of the downward trend line. Therefore, the market has given a clear direction. It is OK to sell when the Asian market rebounds to the pressure level. Gold is still in a fluctuating downward trend in 1 hour!
The downward trend resistance of gold has moved down to around 3350. Before gold effectively breaks through 3350, gold is under pressure at 3350 and continues to sell at high prices. Today, Friday, the probability of gold having a big market is relatively high, and if there is a big market on Friday, it is basically weak throughout the day. If it is strong, it is strong throughout the day. As long as gold continues to be weak in the European market, it is likely that gold will continue to fall today.
Operation ideas:
Buy short-term gold at 3317-3320, stop loss at 3308, target at 3340-3360;
Sell short-term gold at 3352-3355, stop loss at 3364, target at 3330-3310;
Key points:
First support level: 3323, second support level: 3310, third support level: 3290
First resistance level: 3348, second resistance level: 3360, third resistance level: 3377

Powell's stay or departure affects the market, and gold is unlik
Yesterday, the Trump and Powell incident caused gold to rise strongly to around 3377. The rise of gold was just a moment. In the end, the gold daily line closed positive, but closed with a super long upper shadow line. In the end, the gold price quickly rose and broke through the 3377 mark, and then fell under pressure and fell into a shock closing. The daily K line closed high and fell back and fluctuated in the middle of the positive. Although the overall gold price repeatedly fluctuated and washed the market under the stimulation of the news, it ultimately failed to break through the recent large box shock range. Today we continue to pay attention to the support line of 3318-25 below. We will continue to go long if it falls back!
From the 4-hour analysis, today's short-term support below continues to focus on the vicinity of 3318-25, the short-term pressure above focuses on the 3340-45 line, and the key pressure above focuses on the 3380 line. The overall support range still maintains the main tone of high-altitude low-multiple cycle participation. In the middle position, watch more and do less, and follow orders cautiously, and wait patiently for key points to enter the market.
Gold operation strategy:
Gold falls back to the 3318-25 line and goes long, stop loss 3312, target 3340-45 line, and continues to hold if it breaks;

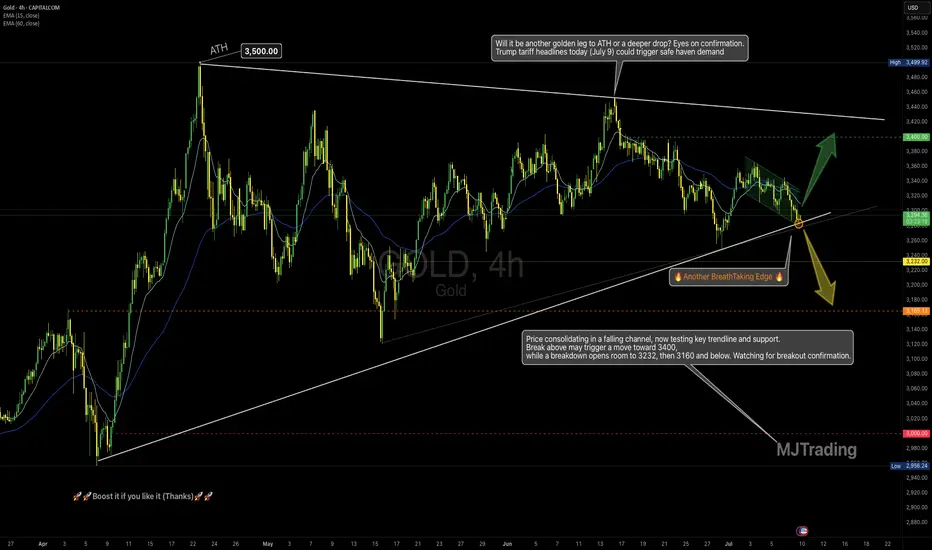
Gold at a Decision Point-Just as Tariff Headlines Return(July 9)📌
4H Technical Outlook by MJTrading
Price is compressing inside a falling channel, nested within a large symmetrical triangle, and now sits right at a high-stakes confluence zone — a perfect intersection of dynamic EMAs, rising trendline support, and local structure.
This could be a pivot point for the next major leg.
🧭 Key Scenarios:
🟢 Bullish Breakout Potential:
If price breaks above the falling channel and holds above $3,310–$3,320:
🎯 Target: $3,400, and eventually upper triangle resistance near $3,480–$3,500
✅ Watch for impulsive breakout + retest confirmation
🟡 Bearish Breakdown Risk:
If the rising trendline gives way and price closes below $3,275 (High Risk) and $3,245(Low Risk):
🎯 Targets: First $3,232, then key level $3,166
⚠️ Further weakness may expose $3,000 psychological support
🔍 Why It Matters:
• Symmetry + compression = potential volatility expansion
• Trump tariff headlines today (July 9) could trigger safe haven demand
• Strong historical respect of these trendlines
• EMAs aligning around decision zone
“Another BreathTaking Edge” — because this is one of those moments where market structure whispers louder than words.
🗣 Boost if you find value, and follow MJTrading for more clean setups.🚀🚀
#XAUUSD #Gold #TradingView #TechnicalAnalysis #ChartPatterns #PriceAction #BreakoutTrade #Forex #MJTrading
Zoom in to get closer to battlefield:
Zoom out to see where we are:
Gold OutlookGold took previous week high and gave bearish move. The gold overall scenario shows it is bullish. The possible move for the gold will be to touch FVG retrace and go towards supply zone and again retrace back. Or if buyers step in we may see good bullish move gold might touch supply zone retrace a little bit follow the bullish path.

Weekly XAUUSD Outlook (July 14–19, 2025)Hey team — we're entering a decisive week on gold as macro tensions heat up and price dances inside a key premium range. Let’s dive into what the chart is telling us.
🔸 HTF Bias: Weekly Structure Breakdown
Bias: Bullish with exhaustion signs
Current candle: Bearish rejection forming after last week's lower high inside the premium range
Trend: Still bullish overall, but stalling inside a distribution-like pattern
Weekly structure:
Confirmed CHoCH in early 2023 launched the bullish leg
Break of structure toward Higher High (HH) continues but weak high was created near 3500
We’re currently inside a weekly premium range, rejecting the upper quadrant
🔸 Key Weekly Confluences:
Zone Type Price Level Confluences
🔼 Resistance 3490–3500 Weak High + Premium zone + FVG + RSI divergence
🔼 Upper Range 3450–3470 Historical imbalance fill + EMA5 overextension
🔽 Support 3355–3320 Weekly OB + Discount side of premium leg + FVG
🔽 Deep Support 3200–3170 Last strong demand + BOS origin + RSI oversold risk zone
Fibonacci Range: 3500 = top of the bullish extension; 50% retracement sits around 3250
RSI (Weekly): Starting to curve down from overbought territory — watch for structure cracks
EMAs (5/21/50): Strong upside lock remains but a flattening 5EMA hints short-term slow-down
🗓 Macro + News Context:
This week is loaded with high-impact U.S. data and a parade of FOMC speakers:
Core CPI (Monday) and Retail Sales (Thursday) = critical for short-term inflation outlook
FOMC members speaking throughout the week = high chance of volatility spikes
Pre-G20 positioning (Friday–Saturday) could lead to risk-off flows or safety bids on gold
Watch Crude Oil Inventories and Building Permits for risk sentiment impact
The combination of CPI, retail sales, and continuous Fed commentary could cause abrupt sentiment swings — especially if inflation surprises to the upside again.
⚠️ What to Watch This Week:
Any weekly close above 3470 = potential sweep into weak high (3500)
Failure to hold 3355 zone = opens the door to revisit the deeper OB around 3200
Look for a lower high inside premium to confirm bearish weekly intent — otherwise we remain bullish
Any bounce from 3320 must show strong volume + FVG reaction to confirm continuation
✅ Final Notes:
This week is all about patience. We’re in a premium exhaustion phase, and with heavy macro catalysts on the table, gold is primed for a decisive breakout — up or down.
Stay flexible. Let price show its hand around the major zones. We’ll refine sniper entries on H4 and H1 once the weekly opens fully.
—
📌 If this breakdown helped, hit 🚀🚀🚀 follow @GoldFxMinds🔔 for daily updates as this structure develops and drop a comment:
Will gold sweep 3500 or collapse toward 3200? 👇
📢 Disclosure:
This analysis is based on the Trade Nation TradingView feed. I’m part of their Influencer Program and receive a monthly fee.
⚠️ Educational content only — not financial advice.

Bitcoin vs Gold: Driving the Point Home📉 Bitcoin vs Gold: Driving the Point Home The long-term comparison we can't afford to ignore.
Gold, after achieving mainstream status, weathered a 20-year consolidation phase, low volatility, muted investor excitement, but enduring presence. This historical precedent forces us to reconsider expectations for Bitcoin, now in its 15th year.
⚡ While Bitcoin’s adoption curve has been sharper, its market dominance has steadily declined since 2017. Despite intermittent, and often deceptive relief rallies, the trend remains downward. Altcoins, forks, and shifting narratives (DeFi, NFTs, meme tokens) continue to fragment attention and capital.
⚡ Could Bitcoin follow gold’s path and enter a prolonged era of post-hype consolidation? If so, the next bull run might be a decade away or more … if it happens at all. In an age of digital abundance, durability; not innovation, may define Bitcoin’s legacy.
📊 Chart Highlights: The latest image visualizes Bitcoin’s current phase against gold’s historical arc. The final label "Monetary Maturity" suggests a shift from speculative highs to a more sober test of endurance.
🔍 Will Bitcoin evolve into a true store of value or fade as just another chapter in financial innovation? Let the markets answer, but history offers clues. Only Time will tell.
#Bitcoin #Gold #CryptoAnalysis #BTCdominance #CryptoHistory #DigitalAssets #TradingView
CRYPTO:BTCUSD INDEX:BTCUSD TVC:SILVER NASDAQ:MSTR NASDAQ:MARA NASDAQ:COIN NASDAQ:TSLA TVC:DXY NYSE:CRCL

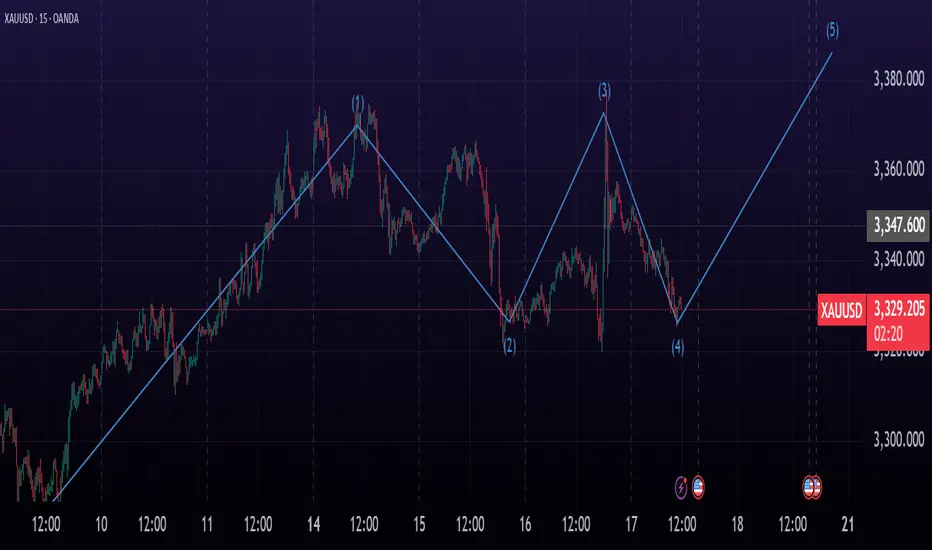
Gold (XAU/USD) - Elliott Wave Suggests Wave 5 Upside Starting!📊 Current Wave Count:
Wave 1 (Complete): Rally from to .
Wave 2 (Corrective): Pullback to (held 50%/61.8% Fib).
Wave 3 (Extended): Strong impulse to .
Wave 4 (Corrective): ABC pattern ending near (e.g., 38.2% Fib of Wave 3).
🎯 Wave 5 Projection:
Target: Typical 0.618–1.0 extension of Wave 1-3 → $ .
Invalidation: Break below Wave 4 low ($ ).
📈 Why Now?
Wave 4 completed as a shallow correction (flat/triangle).
MACD/RSI shows bullish divergence on lower timeframes.
Fundamental drivers (e.g., Fed dovishness, inflation) align.
⚡ Trading Plan:
Entry: Near current pullback (~$ ).
Stop Loss: Below Wave 4 low.
Take Profit: Scale out at 0.618 and 1.0 extensions.
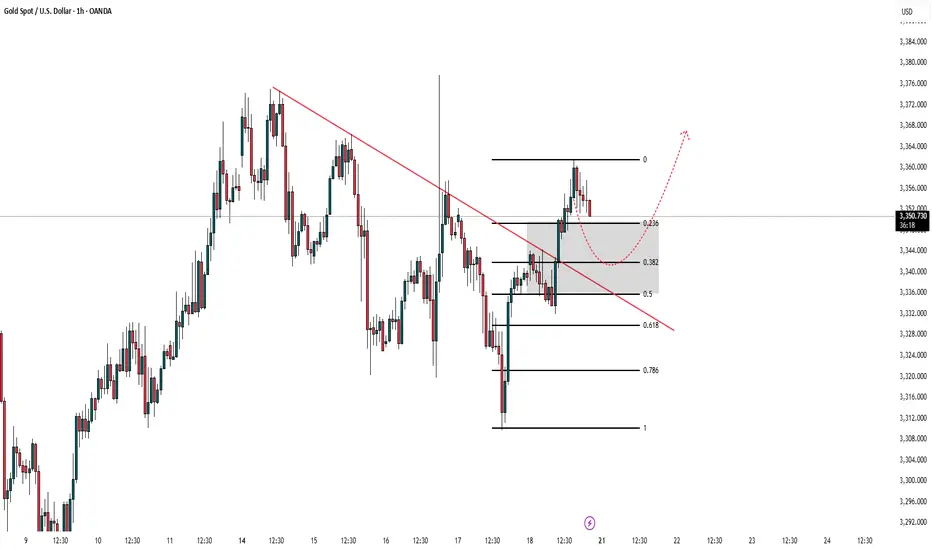
xau next week mapDear all traders wish you bests and hope you were profitable.
clear breakout happend from trend line.
expect a retracement as it has strong movement i think 23.6 would be enough
then you can search for a buy levels in lower timeframe like 15min
if wanted to trade sell we have to find clear structure and good momentum in 1 min or 5min
keep your risk management stay in market
good weeknd "ITS JUST GOOD BUSINESS"
"Gold Ready for Bullish Move – 3365 Tak Udane Wala Hai!🔹 Lower Purple Zone (Support Area) – Price ne is zone (approx. 3315–3320) se strong bullish reversal dikhaya hai. Yeh area buyers ka interest zone hai jahan se market ne reaction diya.
🔹 Upper Purple Zone (Resistance Area) – 3360–3375 ka zone strong resistance hai jahan se pehle bhi multiple rejections aayi hain.
🔹 Current Price: 3340.115 par trade kar raha hai.
🔹 Blue Arrow Prediction: Chart ka analysis yeh batata hai ke price ab is support zone se upar ki taraf move karega aur resistance zone ko test karega (target 3360–3375).

Gold Market Clears 3330's — Eyes Set on 3380'sJust as analyzed, Gold market swept through the 3330's, validating prior projections. This move confirms bullish continuation, with price now poised to reach 3380's as momentum builds within the ongoing wedge structure. follow for more insights, comment , and boost idea

uptrend, heading towards 3400⭐️GOLDEN INFORMATION:
Gold prices (XAU/USD) climb toward $3,350 in early Asian trading on Tuesday, supported by renewed safe-haven demand after US President Donald Trump threatened sweeping 100% tariffs on Russia. Traders now shift focus to the upcoming US Consumer Price Index (CPI) report, which could offer further cues for the Federal Reserve’s policy outlook.
Late Monday, Trump warned that unless Russian President Vladimir Putin agrees to a peace deal to end the Ukraine conflict within 50 days, the US will impose 100% tariffs on Russian goods. The proposed sanctions, described as secondary tariffs, lack detailed clarification but have already fueled market anxiety. Heightened geopolitical tensions are likely to sustain near-term demand for gold as investors seek safety in the yellow metal
⭐️Personal comments NOVA:
Maintaining buying pressure above 3350, gold price in an uptrend, paying attention to CPI results to assess the inflation level of the world's number 1 economy
⭐️SET UP GOLD PRICE:
🔥SELL GOLD zone: 3400- 3402 SL 3407
TP1: $3390
TP2: $3380
TP3: $3370
🔥BUY GOLD zone: $3330-$3328 SL $3323
TP1: $3340
TP2: $3350
TP3: $3360
⭐️Technical analysis:
Based on technical indicators EMA 34, EMA89 and support resistance areas to set up a reasonable BUY order.
⭐️NOTE:
Note: Nova wishes traders to manage their capital well
- take the number of lots that match your capital
- Takeprofit equal to 4-6% of capital account
- Stoplose equal to 2-3% of capital account

3 Trading Scenarios To Choose From - Which Do You Prefer? The setup that we're looking at in this video is going to be a potential bearish bat pattern on GOLD.
However, what's more important is the lesson that I wanted to cover on different tactics for adjusting your stop/loss & dig into the pro's and con's of each.
I'd love to hear which way you guys would choose in this particular situation (or in general) so please share your opinion in the comments section below.
Wishing a great weekend and a great upcoming week in the markets.
Akil

Gold Bullish Above 3342 – Watching 3365 BreakoutGold Futures Rise on Trade & Geopolitical Tensions
Gold continues to gain as renewed tariff threats from the U.S. and rising geopolitical risks weigh on market sentiment.
While markets have become somewhat desensitized to Trump’s recurring trade rhetoric, concerns remain that resolutions may be delayed.
Technical Outlook:
As long as the price holds above 3342, the bullish trend is likely to continue toward 3355 and 3365.
A stable close above 3365 would open the way to 3395.
However, a 1H close below 3342 may trigger a pullback to 3329.
Pivot: 3342
Resistance: 3355, 3365, 3395
Support: 3329, 3319, 3309

XAUUSD setup selling ideas h4Disruptive Gold Analysis – 4H Chart Perspective
Symbol: XAU/USD 🥇 | Timeframe: 4H
Date: July 9, 2025
⸻
🔁 Scenario Disruption: Potential Bullish Reversal
✅ While the original analysis shows a bearish continuation setup with consolidation under resistance and breakdown towards multiple downside targets, a disruptive view considers a false breakdown or support flip scenario.
⸻
🔁 Alternative Viewpoint:
📍 Current Price Action:
Price is testing the support zone (~3,280–3,290) which has held multiple times in the past.
🟢 Disruption Possibility:
1. Bullish Fakeout Trap Setup:
• Price may create a false breakdown below support to trap sellers.
• A quick recovery and breakout above the consolidation highs (~3,310–3,320) would invalidate the bearish continuation.
2. Resistance Flip Setup:
• If the market reclaims above 3,320, we may see a bullish push towards the key resistance zone at 3,360–3,380.
• This could evolve into a range breakout bullish trend continuation toward previous highs.
⸻
🔄 Disruption Targets:
• 📈 Immediate Upside Target: 3,320
• 📈 Breakout Target: 3,360
• 📈 Extended Bullish Target: 3,400+
⸻
⚠️ Invalidation Level:
If price closes below 3,270, then the original bearish scenario remains intact, with continuation toward 3,240 → 3,200 → 3,140.

Setupsfx_ | XAUUSD(Gold):07/07/2025 Update | Gold dropped nicely when the market opened last night, dropping around 600 pips. However, it couldn’t hold on to the gains and came right back to the selling zone. There are two entry points and two potential targets.
Good luck and trade safely!
Team Setupsfx_

#XAUUSD: Two Zones To Buy From! Swing MoveRecent conflicts in the Middle East have disrupted the market, causing a significant increase in volatility. We are closely monitoring the situation and anticipate potential price reversals from either of our entry points.
When trading gold, it is crucial to prioritise risk management.
Best of luck and safe trading.
Team Setupsfx_

GOLD ROUTE MAP UPDATEHey Everyone,
Another PIPTASTRIC day on the markets with our chart idea and levels playing out and being respected, as analysed.
After completing the swing range test and full swing into 3306, we stated yesterday that we will now look for ema5 cross and lock above 3306 to open 3330. This was locked and loaded and completed the 3330 target today.
We will now continue to look for ema5 lock above 3330 for a continuation into the bullish targets above or failure to lock will see rejections into the lower Goldturns for support and bounce inline with our plans to buy dips.
We will keep the above in mind when taking buys from dips. Our updated levels and weighted levels will allow us to track the movement down and then catch bounces up.
We will continue to buy dips using our support levels taking 20 to 40 pips. As stated before each of our level structures give 20 to 40 pip bounces, which is enough for a nice entry and exit. If you back test the levels we shared every week for the past 24 months, you can see how effectively they were used to trade with or against short/mid term swings and trends.
The swing range give bigger bounces then our weighted levels that's the difference between weighted levels and swing ranges.
BULLISH TARGET
3358
EMA5 CROSS AND LOCK ABOVE 3358 WILL OPEN THE FOLLOWING BULLISH TARGETS
3389
EMA5 CROSS AND LOCK ABOVE 3389 WILL OPEN THE FOLLOWING BULLISH TARGET
3416
EMA5 CROSS AND LOCK ABOVE 3416 WILL OPEN THE FOLLOWING BULLISH TARGET
3439
BEARISH TARGETS
3330 - DONE
EMA5 CROSS AND LOCK BELOW 3330 WILL OPEN THE FOLLOWING BEARISH TARGET
3306 - DONE
EMA5 CROSS AND LOCK BELOW 3306 WILL OPEN THE SWING RANGE
3283 - DONE
3254
As always, we will keep you all updated with regular updates throughout the week and how we manage the active ideas and setups. Thank you all for your likes, comments and follows, we really appreciate it!
Mr Gold
GoldViewFX
