Gold: escape from tariffsThe market optimism holds, but comments related to tariffs are still bringing some unrest among investors. Although this unrest is currently not as strong as in April this year, still, some investors prefer to keep part of their funds in the safe-haven assets. News regarding trade tariffs during the previous week include 35% tariffs on imports from Canada, 50% tariffs on imports from Brazil, and 50% tariffs on copper imports. The latest news posted on Saturday includes 30% tariffs on goods from Europe and Mexico. Weekend information was still not reflected in the market price of the gold, implying that the Monday trading session might start with further move to the upside.
The price of gold gained during the previous week, starting around the level of $3.285 with Friday's strong push, ending the week at $3.355. At this moment, the RSI modestly passed the 50 level, closing the week at 53. The MA50 continues to slow down divergence from MA200, but the potential cross is still not in store, considering the significant distance between two lines.
When it comes to the price of gold in the week ahead, tariffs will again be the ones to shape investors sentiment. At this moment, technical analysis is pointing potential for moves toward both sides. If Monday's trading session starts with a move toward the upside, then it will most probably continue for the rest of the week. The next resistance line stands at $3,4K, which could be tested. However, there is also some probability for a short price correction, where the level of $3,3K might be tested for one more time, eventually $3,280.
CFDGOLD trade ideas

GOLD ROUTE MAP UPDATEHey Everyone,
Another PIPTASTRIC day on the markets with our chart idea and levels playing out and being respected, as analysed.
After completing the swing range test and full swing into 3306, we stated yesterday that we will now look for ema5 cross and lock above 3306 to open 3330. This was locked and loaded and completed the 3330 target today.
We will now continue to look for ema5 lock above 3330 for a continuation into the bullish targets above or failure to lock will see rejections into the lower Goldturns for support and bounce inline with our plans to buy dips.
We will keep the above in mind when taking buys from dips. Our updated levels and weighted levels will allow us to track the movement down and then catch bounces up.
We will continue to buy dips using our support levels taking 20 to 40 pips. As stated before each of our level structures give 20 to 40 pip bounces, which is enough for a nice entry and exit. If you back test the levels we shared every week for the past 24 months, you can see how effectively they were used to trade with or against short/mid term swings and trends.
The swing range give bigger bounces then our weighted levels that's the difference between weighted levels and swing ranges.
BULLISH TARGET
3358
EMA5 CROSS AND LOCK ABOVE 3358 WILL OPEN THE FOLLOWING BULLISH TARGETS
3389
EMA5 CROSS AND LOCK ABOVE 3389 WILL OPEN THE FOLLOWING BULLISH TARGET
3416
EMA5 CROSS AND LOCK ABOVE 3416 WILL OPEN THE FOLLOWING BULLISH TARGET
3439
BEARISH TARGETS
3330 - DONE
EMA5 CROSS AND LOCK BELOW 3330 WILL OPEN THE FOLLOWING BEARISH TARGET
3306 - DONE
EMA5 CROSS AND LOCK BELOW 3306 WILL OPEN THE SWING RANGE
3283 - DONE
3254
As always, we will keep you all updated with regular updates throughout the week and how we manage the active ideas and setups. Thank you all for your likes, comments and follows, we really appreciate it!
Mr Gold
GoldViewFX

GOLD Made Triple Top Pattern , Short Setup Very Clear !Here is my opinion on 15 Mins T.F On Gold , we have a triple Top Reversal Pattern , on 15 mins and 30 mins T.F , And we have a clear closure below neckline , so i think we can sell this pair for 100 pips at least to get this pattern target , we can sell from the current price or from m y best area for sell .

Setupsfx_ | XAUUSD(Gold):07/07/2025 Update | Gold dropped nicely when the market opened last night, dropping around 600 pips. However, it couldn’t hold on to the gains and came right back to the selling zone. There are two entry points and two potential targets.
Good luck and trade safely!
Team Setupsfx_

GOLD MARKET ANALYSIS AND COMMENTARY - [Jul 14 - Jul 18]This week, OANDA:XAUUSD opened at $3,342/oz, dropped to $3,282/oz, but then rebounded sharply to close at $3,355/oz. The recovery was mainly driven by former President Trump's announcement of new tariffs ranging from 20% to 50% on imports from 22 countries, effective August 1st. Particularly, a 35% tariff on Canadian goods — a key U.S. trading partner — raised concerns about global trade stability and supply chains.
Trump also proposed 15–20% tariffs on most other trading partners, reigniting fears of global trade disruptions. At the same time, ongoing conflict between Israel and Hamas continued to weigh on sentiment, despite U.S. diplomatic efforts showing little progress.
However, analysts note that gold still lacks strong momentum for a breakout. Trump's tariff threats may be more about negotiation leverage than triggering a full-blown trade war. Meanwhile, with the labor market recovering and inflation rising, the Fed is expected to maintain its neutral monetary policy, limiting short-term gold price movements.
Although geopolitical tensions remain (e.g., Russia-Ukraine, Israel-Hamas), the ceasefire between Israel and Iran has reduced gold’s geopolitical risk premium.
Looking ahead, key U.S. economic data next week — including CPI, PPI, and retail sales — will be closely watched. A strong June core CPI (0.4% or higher) could reduce the likelihood of a Fed rate cut in September, strengthening the USD and pushing gold lower. Conversely, weaker inflation data could boost expectations of a rate cut, supporting gold prices.
📌In terms of technical analysis, gold prices next week may continue to adjust and accumulate. Accordingly, if they surpass the 3,370 USD/oz mark, gold prices next week will challenge the 3,400-3,450 USD/oz range. On the contrary, gold prices next week will adjust down to 3,285 USD/oz, or even 3,245 USD/oz.
Notable technical levels are listed below.
Support: 3,350 – 3,310 – 3,300USD
Resistance: 3,371 – 3,400 – 3,430USD
SELL XAUUSD PRICE 3435 - 3433⚡️
↠↠ Stop Loss 3439
BUY XAUUSD PRICE 3329 - 3331⚡️
↠↠ Stop Loss 3326

How to use Session Profiles for Day TradingHey whats up traders, in reveal cheat code for day trading by using session profiles. It's powerful concept. If correctly applied with HTF trend it will allows you to join running train path the right time.
Dont forget to follow me. I release such articles every Monday.
🧠 What Are Session Profiles?
A session profile describes the typical price structure and narrative during a market session — from open → high/low → close.
In Forex, we focus on:
• Asian Session
• London Session
• New York Session
Each session can act as either a reversal or continuation of the previous session(s).
📈 Why They Work
Markets are engineered to:
• Run stops (above highs or below lows)
• Fill inefficiencies (fair value gaps or imbalances)
CLS prefer to move price during specific times — the active hours around session opens. This is where liquidity is high and slippage is minimal, making it ideal for executing large orders.
So, session profiles help us map out when and where these manipulations are most likely to happen.
✅ Why You Should Use Them
Session profiles help you:
• Avoid low-probability trades in dead sessions
• Focus on high-probability narratives
• Anchor your execution models to context
But remember: they are not an entry model. You still need:
• A higher timeframe bias
• A mechanical entry model
• A system for risk and trade management
🔁 How to Use Session Profiles
Use the previous session(s) to anticipate the next one.
• For London session → analyze the Asian session
• For New York session → analyze Asian + London sessions
You’re looking for:
1. Manipulations into key levels
2. Displacement (price moves away strongly)
3. Change in order flow (e.g. OB,on M5 ,15 or H1)
4. Remaining liquidity targets (draw on liquidity)
📊 Session Profile Types with Chart Logic
1. 🔄 London Continuation Profile
Conditions:
• Asia session already made a manipulation into a key level
• Price displaced away from that level
• CIOD / OB on M15 or H1 before London open
Example:
• H1: Asia runs stops above H1 high into a fair value gap (key level)
• Displacement confirms intent
• At London open, price retraces into M15 premium (PD array) and continues in the same direction
Invalidation: the manipulation high/low from Asia session
Narrative: Asia did the manipulation → London does the continuation.
2. 🔁 London Reversal Profile
Conditions:
• Asia session consolidates near a higher timeframe key level
• London open initiates the manipulation into the key level
• Displacement + M15 BOS after manipulation
Example:
• H1: Asia consolidates under daily FVG
• London opens, price runs Asia high into that FVG
• M15 breaks down → clean short setup
• Target: higher timeframe draw on liquidity (e.g., previous day low)
Invalidation: the London session high (manipulation point)
Narrative: London performs the manipulation → price reverses.
3. 🔄 New York Continuation Profile
Conditions:
• Asia + London already created a clear manipulation and displacement
• London has not reached the final draw on liquidity
• London is not overextended (e.g., <70 pips move)
• New York opens with structure intact for continuation
Example:
• H1: London makes a reversal from a key level and displaces lower
• Draw on liquidity (e.g., previous day low) still untouched
• NY opens and continues the sell-off, retracing briefly into M15 imbalance before expanding lower
Invalidation: manipulation level from London
Narrative: London set the direction → NY finishes the move.
4. 🔁 New York Reversal Profile
Conditions:
• No clear London profile (no key level touched, no strong CHoCH)
• NY opens and manipulates into a key level (e.g., daily OB, FVG)
• Clear M15 or H1 CHoCH or BOS confirming reversal
• Asia + London lows still intact (liquidity available below)
Example:
• H1: No strong setup in London
• NY opens, price spikes into daily OB and takes out London highs
• M15 structure shifts → sell targeting London + Asia lows
Invalidation: NY session manipulation high
Narrative: London was noise → NY takes control and reverses.
🔁 Visual Structure Flow
Before applying any session profile, confirm:
1. High-probability trading conditions (e.g., key level proximity, market open, liquidity available, Red News)
2. Bias in place (HTF (D1 and Weekly direction must be known)
Then:
→ Check for valid session narrative
→ Select the correct session profile
→ Wait for the stop run of H1 / H4
→ Is there enough room for the move to key level
→ If we are still in first half of session you can enter. If its close the end of session skip it.
→ Apply your entry and risk model.
→ Dont be greedy look for 2:1 RR trade and get out.
🔁 How to enter ?
if bearish - You always want enter above H1 I H4 candle after LTF CIOD
If bullish - You always want to enter bellow H1/ H4 after LTF CIOD.
Use Order block to enter the market here is how to identify it correctly
Remember:
Never sell low / Never buy High... wait for stop run / Liquidity sweeps. If you dont know where is the liquidity - you will be liquidity.
Hope this brings clarity to your trading.
Done on the Tradenation Charts
Disclosure: I am part of Trade Nation's Influencer program and receive a monthly fee for using their TradingView charts in my analysis.
"Adapt what is useful, reject what is useless, and add what is specifically your own."
— David Perk aka Dave FX Hunter ⚔️

XAU/USD : Gold is falling , When it Stops? (READ THE CAPTION)By analyzing the gold chart on the 4-hour timeframe, we can see that, in line with our latest analysis, the bearish momentum has continued—and even more strongly than expected. Gold has broken below the key $3300 level and is currently trading around $3294.
Given the strong momentum, further downside is likely. The next bearish targets are $3289, $3276, $3262, and $3254.
All key supply and demand zones are clearly marked on the chart.
(And if you're looking for more precise trading levels, just drop a comment and I'll guide you.)

Sell XAUUSD XAUUSD is slowly establishing a downtrend while everyone buys. I advice sells here from 3340 towards 3280. This trade should have a very tight stop loss at 3346 because should it break above, it could rally

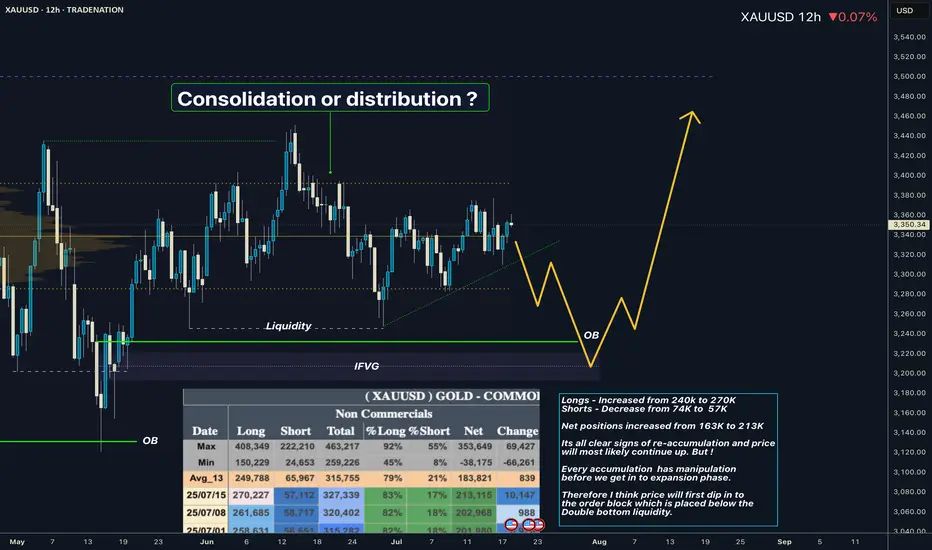
XAUUSD I Whats playing out in the range? COT overviewHey what up traders welcome to the COT data and Liquidity report. It's always good to go with those who move the market here is what I see in their cards. I share my COT - order flow views every weekend.
🎯 Non Commercials added significant longs and closed shorts at the same time. So for that reason I see the highs as a liquidity for their longs profits taking.
📍Please be aware that institutions report data to the SEC on Tuesdays and data are reported on Fridays - so again we as retail traders have disadvantage, but there is possibility to read between the lines. Remember in the report is what they want you to see, that's why mostly price reverse on Wednesday after the report so their cards are hidden as long as possible. However if the trend is running you can read it and use for your advantage.
💊 Tip
if the level has confluence with the high volume on COT it can be strong support / Resistance.
👍 Hit like if you find this analysis helpful, and don't hesitate to comment with your opinions, charts or any questions.
Analysis done on the Tradenation Charts
Disclosure: I am part of Trade Nation's Influencer program and receive a monthly fee for using their TradingView charts in my analysis.
"Adapt what is useful, reject what is useless, and add what is specifically your own."
— David Perk aka Dave FX Hunter ⚔️
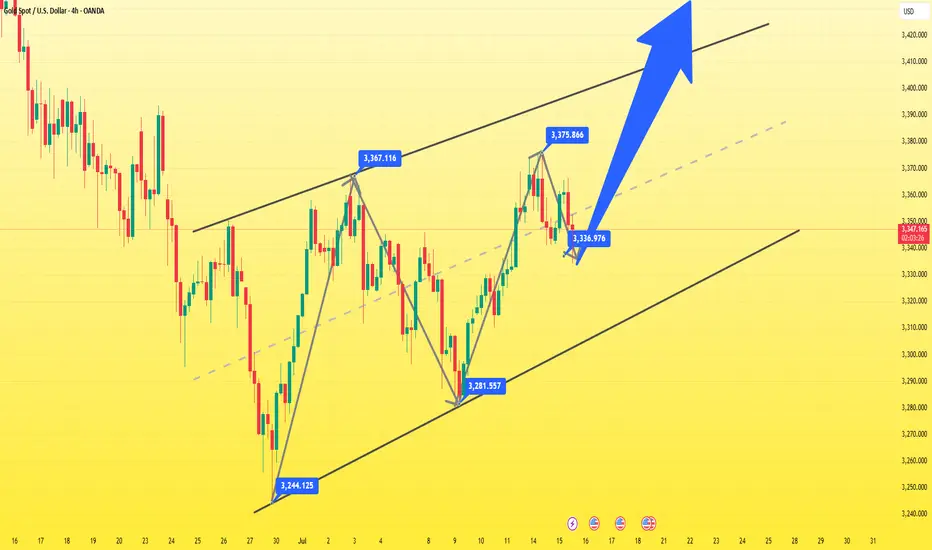
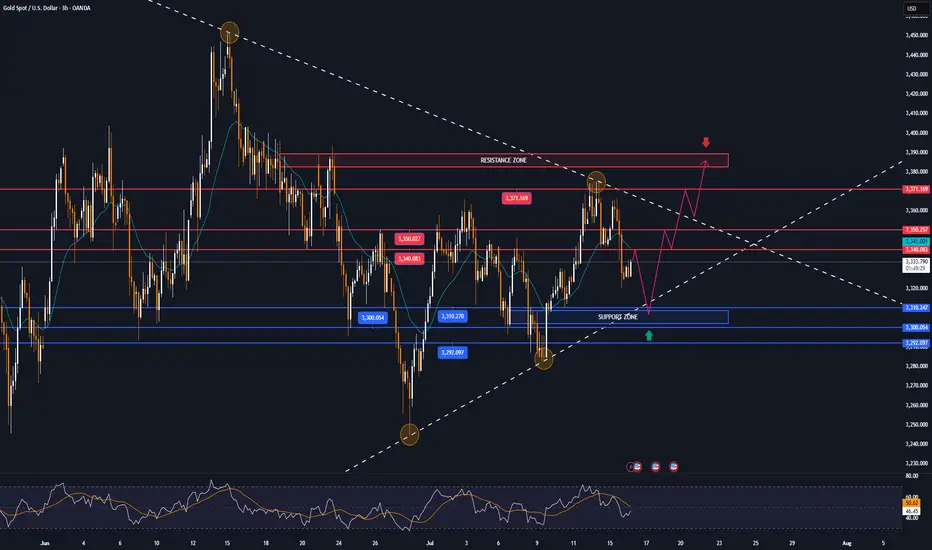
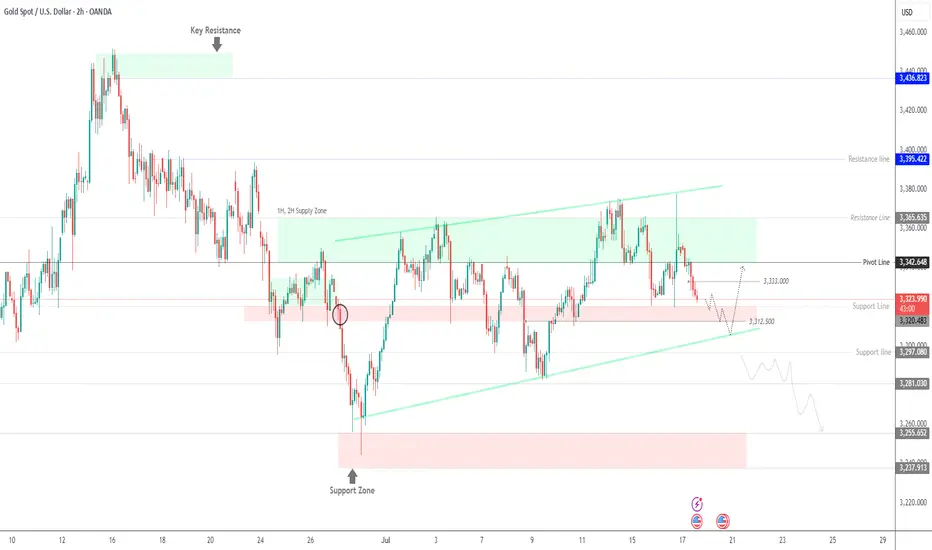
Lingrid | GOLD Weekly Analysis: Consolidation Within UptrendOANDA:XAUUSD market remain trapped in volatile sideways action within a broad consolidation range, following the recent strong rally. Despite the current noisy price behavior, the underlying longer-term bullish momentum remains intact.
Higher timeframe reveals critical technical levels, with gold testing the resistance zone around after breaking above the upward channel. The triangle pattern breakout suggests potential for higher targets, though the market is currently experiencing a corrective pullback near the $3,300 support level. The presence of multiple resistance tests indicates strong institutional interest at these elevated levels.
The 4H chart provides broader context, showing the A-B-C corrective structure from the June highs. The market appears to be forming a potential ascending triangle pattern, with the June high serving as key resistance. The current consolidation between the June high and low suggests accumulation before the next directional move.
Key levels to watch include the $3,300 support zone and the $3,400 resistance area. A decisive break above resistance could trigger another leg higher toward $3,500, while failure to hold support might see a retest of the $3,200 level. The overall structure suggests this consolidation is part of a larger bullish continuation pattern.
If this idea resonates with you or you have your own opinion, traders, hit the comments. I’m excited to read your thoughts!

The 7.15 gold shock adjustment is not the top!7.15 Gold Operation Strategy Reference:
Short Order Strategy:
Strategy 1: When gold rebounds around 3370-3375, short (buy short) 20% of the position in batches, stop loss 10 points, target around 3350-3345, break to see 3340 line;
Long Order Strategy:
Strategy 2: When gold pulls back to around 3340-3345, long (buy long) 20% of the position in batches, stop loss 10 points, target around 3355-3365, break to see 3375 line;
I am a financial enthusiast. I may not have a 100% winning rate. If you are a novice or your account is about to be burned, you can ask me. I will give you free professional advice.
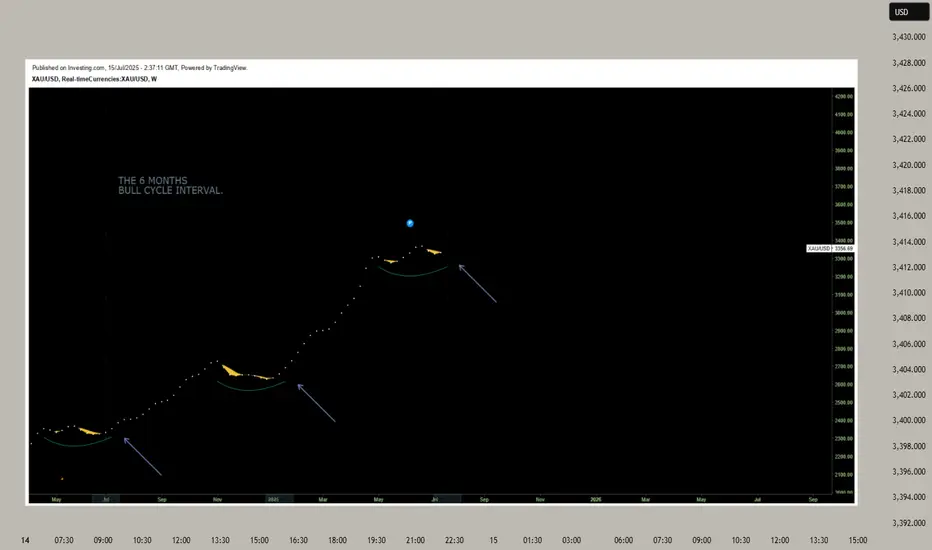
GOLD has entered a NEW BULL CYCLE this month! GET LOADED now!GOLD, has been on a consistent ascend since 2k levels hitting a series of ATH taps week after week.
As with any parabolic event -- a trim down is warranted.
After hitting its ATH zone at 3500, gold significantly corrected back to 38.2 fib levels at 3100 area. 38.2 fib levels has been acting as a strong support for GOLD for quite a bit and as expected buyers has started to converge and positioned themselves back again for that upside continuation -- long term.
After hitting this fib key level gold has been making consistent higher lows on the daily conveying clear intentions on its directional narrative -- to go NORTH.
As of this present, July 2025, GOLD has seen renewed elevation in momentum metrics signifying definitive blueprint towards its next upside move.
Based on our diagram above. WE have now entered a new bull cycle that only transpires every 6 months. The last cycles happened on July 2024, January 2025, then presently July 2025 which is in progress. This is very special as we dont get to see this bullish setup on a regular basis.
Ideal seeding zone is at the current range of 3300-3350.
Mid-Long Term Target at 3400
TAYOR.
Trade safely. Market is Market.
Not financial advice.
Lingrid | GOLD selling Opportunity at Resistance ZoneOANDA:XAUUSD recently rebounded from the support level near 3280 and pushed upward into the 3329 resistance zone. However, the price is struggling to break above both the red descending trendline and the horizontal supply zone, suggesting exhaustion of bullish momentum. A lower high formation and rejection from this confluence area signal a likely bearish continuation. If confirmed, price may slide toward 3305, with potential to revisit the 3280 support area.
📉 Key Levels
Sell trigger: rejection from 3330 with bearish confirmation
Sell zone: 3325–3330 (confluence of horizontal and diagonal resistance)
Target: 3305 first, extended to 3282.3
Invalidation: strong hourly close above 3330 breaks bearish structure
💡 Risks
False breakout traps near 3305 may reverse sentiment
Unexpected macro events (CPI, Fed comments) can shift short-term trend
Price bouncing at 3305 before full target reach might attract dip buyers
If this idea resonates with you or you have your own opinion, traders, hit the comments. I’m excited to read your thoughts!

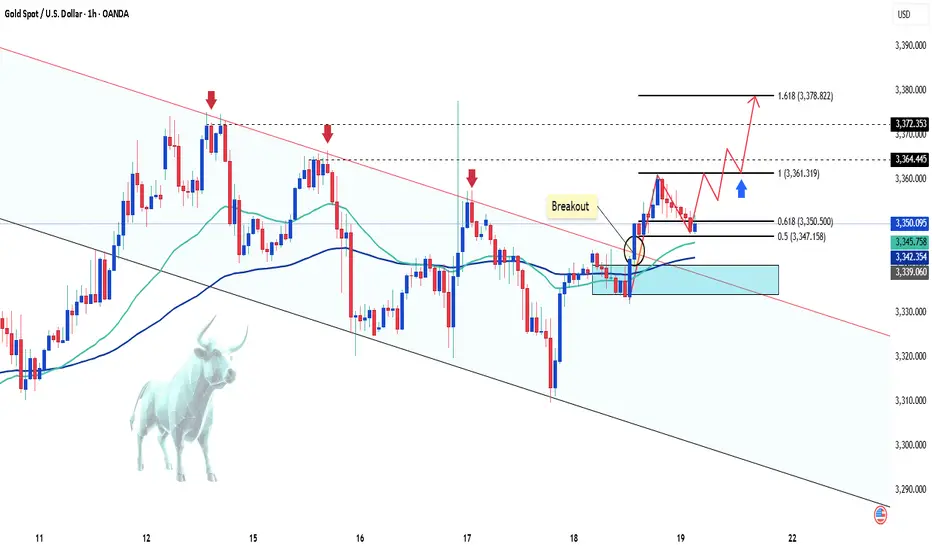
Gold scalp buying opportunity before final dropGold has broken above the mini bull flag formation and is currently sustaining above the structure. The strategy is to patiently await a pullback into the highlighted buy-back zone, where a favorable entry opportunity may present itself. Focus remains on the projected flag targets, as the ongoing momentum suggests promising upside potential. Monitor price action closely.

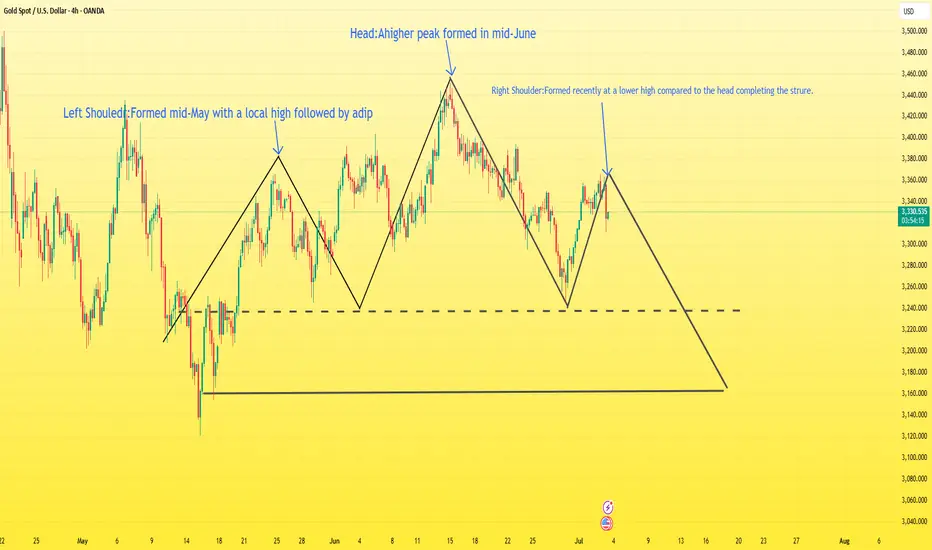
Will gold return to 3500?XAU/USD Head and Shoulders Breakdown Analysis
The chart shows a classic Head and Shoulders pattern forming on the 4H timeframe, indicating a potential bearish reversal setup.
Left Shoulder: Formed mid-May with a local high followed by a dip.
Head: A higher peak formed in mid-June.
Right Shoulder: Formed recently at a lower high compared to the head, completing the structure.
The neckline has been clearly defined, and price is currently hovering just above it. If the price breaks and closes below the neckline with strong bearish momentum, it would confirm the pattern.
Target: The projected target from the breakdown is around 3163, calculated by measuring the height from the head to the neckline and projecting it downward.
Outlook:
A confirmed break below the neckline would open the door for further downside toward the target zone.
Bears will be in control if price sustains below the neckline with increasing volume.
Wait for confirmation on the neckline break before considering short entries.
If you are a newbie or your account is burning, don't trust any advice easily. Contact me. I will give you free advice.
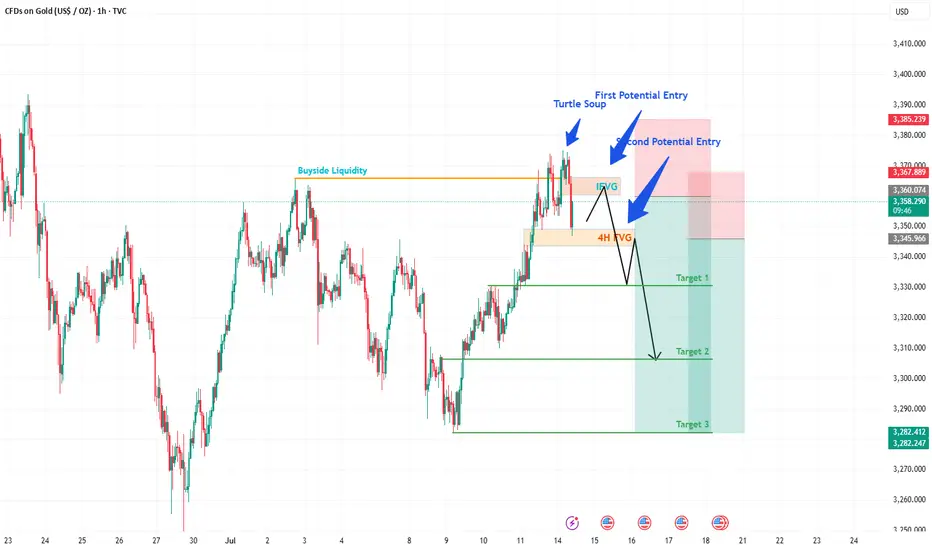
XAUUSD (GOLD) POTENTIAL SELL IDEAGold after hitting 3500 level, has kind of been ranging between 3200 and 3450 level. As we can say that Monday as start of the week has taken a Buyside Liquidity maybe making it high of the week which we will know as the market unfolds itself.
A FVG was formed on 1H before the Buyside was taken and after taking BSL, price sliced through FVG making it IFVG, we can expect Gold to give us a sell trade as it enters this IFVG which will be our first potential entry, placing SL slightly above Buyside Liquidity level.
If our first entry is successful, we can see a second entry when the price slices through the 4h FVG as marked, making it again an IFVG targeting the levels as highlighted on the chart.
FIRST POTENTIAL ENTRY:
Sell @ 3360-3365
Stop loss = 3385
Take Profit = 3335 (Target 1), 3310 (Target 2), 3390 (Target 3)
SECOND POTENTIAL ENTRY:
Sell @ 3340-3345
Stop loss = 3367
Take Profit = 3335 (Target 1), 3310 (Target 2), 3390 (Target 3)
GOLD in narrow range, after sharp drop on US CPI dataOANDA:XAUUSD fell sharply on Tuesday (July 15) as the US Dollar TVC:DXY gained significantly after the US CPI report was released. As of now (July 16), gold is trading at 3,326 USD/oz, equivalent to an increase of only 2 USD in the day.
The US Consumer Price Index (CPI) in June was in line with expectations but higher than the previous value. The surge in the Dollar after the US released the June CPI is the main reason for the pressure on gold prices so far.
• Data released by the US on Tuesday showed that the US CPI increased by 2.7% compared to the same period last year in June, in line with expectations, but higher than the 2.4% in May.
• The US CPI rose 0.3% month-on-month in June, in line with market expectations but up from a 0.1% increase, the largest increase since January this year.
• In addition, the US core CPI rose 2.9% year-on-year in June, up from 2.8% in May, while the core CPI in June rose 0.2% month-on-month.
The market generally believes that US President Trump's tariff policies have increased price pressures, prompting the Federal Reserve to wait and see what further action to take. Federal Reserve Chairman Powell previously said he expected prices to rise in the summer.
The market is still expecting the first rate cut in September. Investors are looking ahead to Wednesday's U.S. producer price index data for more information on the Federal Reserve's move.
Since gold does not yield interest, it typically performs well in low-interest-rate environments, whereas high-interest-rate environments or expectations of future rate hikes put pressure on gold prices.
Technical Outlook Analysis OANDA:XAUUSD
On the daily chart, gold is trading in a fairly narrow range after 2 sessions of downward adjustment, but the specific trend is still unclear, as sent to readers throughout last week, the technical conditions mainly show a sideways accumulation movement. After testing the 0.236% Fibonacci retracement level, gold was unable to overcome this resistance, and the decline from this position brought the gold price close to the support of 3,310 USD and then the area of the original price point of 3,300 USD with the 0.382% Fibonacci retracement.
With the technical conditions not giving a specific trend as they are now, for gold to be able to have a new bullish cycle it needs to move the price action above the 0.236% Fibonacci retracement level, then the target would be around $3,400 in the short term, more than $3,430. On the other hand, if gold falls below the 0.382% Fibonacci retracement level again, it could be a good signal for an expectation of a bullish cycle, then the target would be around $3,246 in the short term, more than the 0.50% Fibonacci retracement level.
The relative strength index is hovering around 50, indicating that the market is hesitant in terms of momentum and is not leaning towards a specific trend.
During the day, with the current sideways accumulation, gold will be noticed by the following technical levels.
Support: 3,310 – 3,300 – 3,292 USD
Resistance: 3,240 – 3,250 – 3,371 USD
SELL XAUUSD PRICE 3383 - 3381⚡️
↠↠ Stop Loss 3387
→Take Profit 1 3375
↨
→Take Profit 2 3369
BUY XAUUSD PRICE 3304 - 3306⚡️
↠↠ Stop Loss 3300
→Take Profit 1 3312
↨
→Take Profit 2 3318
Golden Support Holds — Bulls Poised for Another Leg Higher"If gold cannot break through the 3365-3375 area, gold will fall under pressure again, or refresh the recent low of 3341, and continue to the 3335-3325 area." Gold's performance today is completely in line with my expectations. Gold just retreated to a low of around 3320, but soon recovered above 3325, proving that there is strong buying support below.
From the current gold structure, the short-term support below is mainly concentrated in the 3320-3310 area. If gold slows down its downward momentum and its volatility converges when it approaches this area, then after the gold bearish sentiment is vented, a large amount of off-site wait-and-see funds will flow into the gold market to form strong buying support, thereby helping gold regain its bullish trend again, thereby starting a retaliatory rebound, or a technical repair rebound.
Therefore, for short-term trading, I still insist on trying to go long on gold in the 3330-3320 area, first expecting gold to recover some of its lost ground and return to the 3340-3350 area.
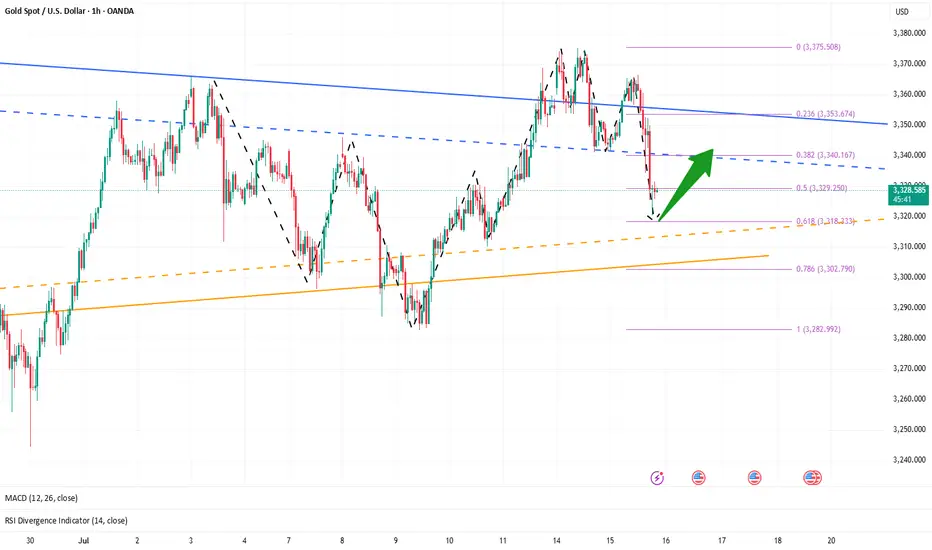
Gold Sees Mild Increase as USD WeakensGold ended Friday's session with a slight increase, regaining the 3350 USD level and recovering over 100 pips by the end of the day.
The weakening of the US Dollar (USD) allowed XAU/USD to rise modestly. Concerns about US President Donald Trump's erratic trade policies and their potential impact on the global economy further supported the precious metal.
In the short term, the technical chart shows gold breaking out of the downward channel and starting an upward wave. The price is currently adjusting at 3350 USD, which coincides with the 0.618 Fibonacci retracement level and the EMA zone, suggesting the potential for further price increases from this level, with targets towards key resistance levels.
Key resistance levels: 3160, 3172, and 3378 USD.
Support zones: 3350, 3340, 3331 USD.
short recovery, trend line✍️ NOVA hello everyone, Let's comment on gold price next week from 07/14/2025 - 07/18/2025
⭐️GOLDEN INFORMATION:
Gold prices surged nearly 1% on Friday as market sentiment soured in response to US President Donald Trump’s controversial trade policies targeting Canada, while hinting at broader tariffs on other nations and copper. At the time of writing, XAU/USD is trading at $3,354, rebounding from intraday lows of $3,322.
On Thursday, Trump announced a 35% tariff on Canadian imports, though goods complying with the 2020 USMCA trade agreement remain exempt. He also signaled intentions to expand tariffs across most trading partners, proposing blanket rates ranging from 15% to 20%.
With a light US economic calendar, attention turned to Fed commentary. Chicago Fed President Austan Goolsbee pushed back on calls for rate cuts aimed at reducing government borrowing costs, stressing the central bank’s focus remains firmly on employment and price stability.
⭐️Personal comments NOVA:
growth according to the trend, maintaining the accumulation price zone above 3300
🔥 Technically:
Based on the resistance and support areas of the gold price according to the H4 frame, NOVA identifies the important key areas as follows:
Resistance: $3392, $3447
Support: $3330, $3308, $3246
🔥 NOTE:
Note: Nova wishes traders to manage their capital well
- take the number of lots that match your capital
- Takeprofit equal to 4-6% of capital account
- Stoplose equal to 2-3% of capital account
- The winner is the one who sticks with the market the longest

GOLD | Testing Key Support at 3320 — Breakdown or Rebound Ahead?GOLD: Futures Dip as Dollar Strengthens, Eyes on 3320 Support
Gold futures declined as the U.S. dollar gained strength following President Trump’s denial of plans to fire Fed Chair Jerome Powell. While concerns over central bank independence persist, gold remains up over 26% YTD, supported by strong central bank demand and ongoing macro uncertainty.
Technical Outlook:
The price is now approaching the 3320–3312 zone.
A break below 3312 would trigger a bearish move from 3315 toward 3297 and 3281.
However, if the price stabilizes above 3320 on a 4H close, a bullish rebound may follow toward 3333 and 3342.
Key Levels:
Support: 3312, 3297, 3281
Resistance: 3333, 3342, 3363
Heading into Fibonacci confluence?XAU/USD is rising towards the resistance level, which is a pullback resistance aligning with the 127.2% Fibonacci extension, the 71% Fibonacci retracement, and the 100% Fibonacci projection. A reversal from this level could lead to our take profit
Entry: 3,392.02
Why we like it:
There is a pullback resistance that lines up with the 127.2% Fibonacci extension, the 71% Fibonacci retracement and the 100% Fibonacci projection.
Stop loss: 3,451.74
Why we like it:
There is a pullback resistance.
Take profit: 3,338.86
Why we like it:
There is a pullback support.
Enjoying your TradingView experience? Review us!
Please be advised that the information presented on TradingView is provided to Vantage (‘Vantage Global Limited’, ‘we’) by a third-party provider (‘Everest Fortune Group’). Please be reminded that you are solely responsible for the trading decisions on your account. There is a very high degree of risk involved in trading. Any information and/or content is intended entirely for research, educational and informational purposes only and does not constitute investment or consultation advice or investment strategy. The information is not tailored to the investment needs of any specific person and therefore does not involve a consideration of any of the investment objectives, financial situation or needs of any viewer that may receive it. Kindly also note that past performance is not a reliable indicator of future results. Actual results may differ materially from those anticipated in forward-looking or past performance statements. We assume no liability as to the accuracy or completeness of any of the information and/or content provided herein and the Company cannot be held responsible for any omission, mistake nor for any loss or damage including without limitation to any loss of profit which may arise from reliance on any information supplied by Everest Fortune Group.

XAUUSD AND GOLD WAS GOES TO BEARISH
🔴 XAUUSD 15M Bearish Trading Idea – Smart Money Trap Unfolding 🩸
🕒 Timeframe: 15-Minute
📉 Bias: Bearish
📊 Strategy: Smart Money Concepts – CHoCH | FVG | LH | LL | BMS | Liquidity Trap
---
📌 Market Context & Structure:
1. Price Action Breakdown:
Market ne Lower High (LH) aur Lower Low (LL) ka consistent bearish structure maintain kiya hai.
A recent CHoCH upward hua, lekin yeh likely a liquidity trap hai — price ne key supply zone ko tap kar ke rejection diya hai.
2. Key FVG Zones:
Multiple bearish FVGs upar exist karti hain (visible in red), jahan price ne react kiya.
Price ne bullish FVG fill karke ab lower timeframe supply zone mein stall karna start kiya hai.
3. EMA Confirmation:
Despite temporary crossover, EMAs still flat or indecisive — suggesting reversal or fakeout.
Price EMA ke around struggle kar raha hai, jo weak bullish attempt ka sign hai.
4. Order Block & Rejection Area:
Current resistance zone (3342–3348) pe strong selling pressure hua hai — potential mitigation + sell-off zone.
---
🔻 Trade Plan – Bearish Continuation Setup:
🔸 Entry Zone:
3342 – 3346 (After rejection confirmation in this zone)
🔻 Stop Loss:
Above 3349 (Above recent LH / supply trap)
🎯 Take Profits:
TP1: 3333 (Recent support)
TP2: 3322 (Demand imbalance)
TP3: 3315 (Major liquidity pool)
📏 Risk:Reward: Targeting 1:2.5 to 1:3+ depending on entry accuracy
---
🧠 Why This Setup is Bearish?
✅ CHoCH bullish was likely a trap; no strong follow-through
✅ Price rejected from key FVG supply zone
✅ Bearish structure still intact — LHs and LLs dominate
✅ EMAs flattening near resistance shows weakness
✅ Liquidity above recent highs has likely been swept — sellers may now dominate
