GOLD SNIPER PLAN – July 21, 2025Hey, GoldMinds! 🔥
This isn’t just another range day — it’s the type of market that separates disciplined snipers from impulsive chasers. If you want an edge, you need a plan that’s both sharper and more refined than what most see on their charts.
After a week full of fake breakouts, confusing swings, and whipsaw price action, gold is giving us the gift of clarity — but only for those patient enough to let the market reveal itself. Here’s how you cut through the noise and focus on the only zones that actually pay.
🚩 SELL ZONES
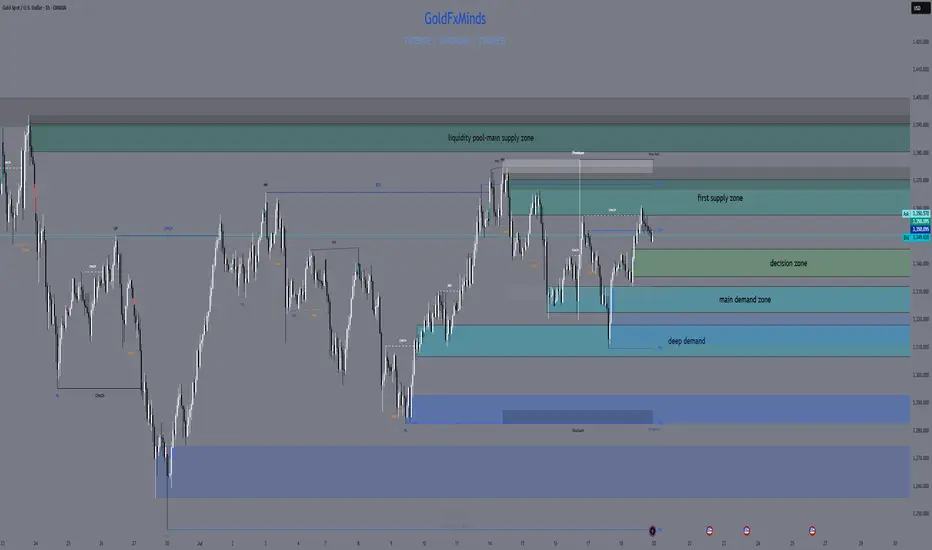
1. Primary Supply: 3358–3370
This is the fortress where real sellers pushed back hard. The structure here is crystal clear: last week’s failed breakout, sharp rejection, and a textbook H1/M30 order block. You want the sniper entry? Wait for price to tap here and only short if you see an instant, aggressive bearish response on M15/M5 — not just a slow drift.
2. Upper Liquidity Trap: 3380–3395
Classic trap for late buyers. This is where price loves to sweep stops and trigger emotional FOMO — but the real professionals are only interested if the move fails hard. Watch for a fake breakout and sudden reversal; this is the sniper zone for “fade and run” shorts.
⚪ DECISION ZONE (Neutral / Pivot)
Pivot Range: 3335–3345
Forget this level — it’s where amateurs get chopped up. There’s no order block, no real fair value gap, just confusion and false hope. A true sniper waits here, watching, not acting.
🟢 BUY ZONES
1. Main Demand: 3326–3332
This is the engine room for bulls: a refined order block, evidence of real absorption, and a history of sharp reversals. Don’t try to anticipate — let price come here and look for a snapback move on M15/M5. This is where patient buyers take their shot.
2. Deep Demand: 3311–3320
Where the fear turns to opportunity. This zone sits under recent lows, home to panic sweeps and emotional selling. Only consider a long if you see a powerful, impulsive bounce. The risk is high, but the reward for perfect timing is even higher.
BIAS & EXECUTION
Bias: Neutral, but watch for range expansion — the market is coiling for a bigger move.
Execution:
– Only act at the true edges, never in the middle.
– Let M5/M15 price action prove your setup — the market owes you nothing.
– If a zone breaks with momentum, do not fight the flow; stand aside or prepare for the next edge.
FINAL SHOT
This is where discipline pays.
Sniper trading is about letting the market come to you and striking only when your zone lights up with confirmation. Every other move is just noise, meant to shake out the impatient. Drop a comment below with the zone you’re watching most , follow and🚀🚀🚀 GoldFxMinds for daily sniper maps, and remember: in gold, only real structure pays.
Disclosure: Charts powered by Trade Nation. Educational content only.
CFDGOLD trade ideas
XAU Trade IdeaGold still bullish after yesterday's gingantic move?
Retracement to OTE + OB while sweeping Asian Low targeting yesterday's high and beyond!

XAUUSD Swing Trade Idea 14-07-2025Hello Traders!
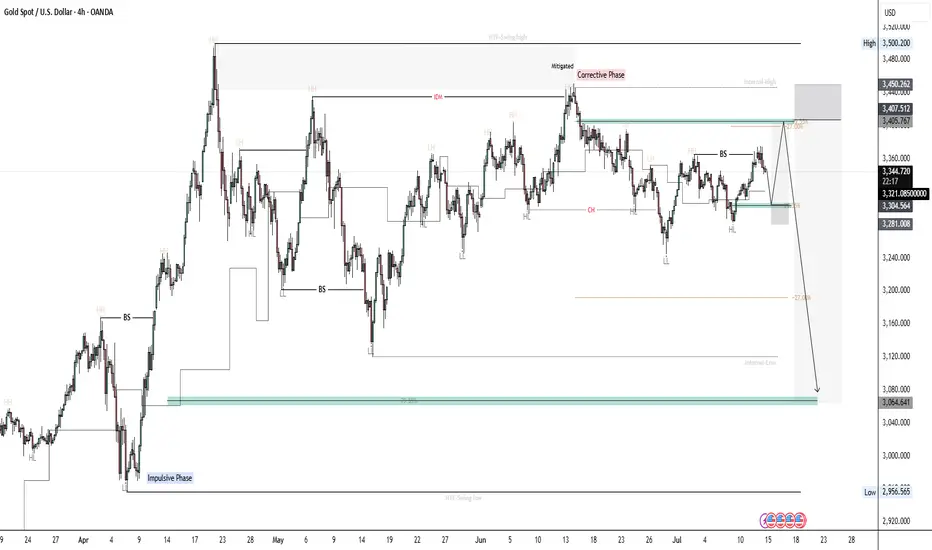
Here's a breakdown on XAUUSD: H4 Timeframe
1. Overall trend is Bullish; Price has been forming HH and respecting HL.
2. By using the identified swing points, we can highlight discounted levels where we expect price to resume the bullish trend. (Impulsive phase)
3. Gold in currently in a (Corrective Phase), and within that corrective structure we can identify impulsive phase and corrective phase. Like they say a structure within a structure
4. Breaking down the current structure we can clearly see that price grabbed liquidity above the last LH and mitigated the supply area which then led to MSS/CHOCH in the market.
5. We can then identify those internal points as internal high and internal low. I am currently expecting price to pull back into premium levels where I will be looking for selling opportunities targeting the discounted level.
6. Current price is playing around EQL, and if we are to zoom in on that structure, we will see that price is respecting a bullish trend structure by forming HH and respecting HL, currently expecting price to pull back into discounted levels then push higher to our premium level, as illustrated.
#3,400.80 on aim as announcedGold is about to test #3,400.80 benchmark, strong possibility which I announced many times lately that Gold will deliver Bullish accumulation below #3,300.80 then #3,400.80 test (if you read my previous analysis, you would be in excellent Profits).
Technical analysis: Gold eventually honored the Fundamental side and is Trading on a Bullish pattern on the healthy Ascending Channel. Now this is largely charted territory on the Hourly 4 chart. Typically the Ascending Channel is a pattern of trend continuation, marking a Bottom and turning Bullish on Short-term even though that Daily chart's #MA50 (line of utmost importance) got invalidated to the upside once again and formed Support now (remember that I mentioned that Gold will reveal major move after #MA50 is formed / holding as an Support or Resistance, now is formed as an Support which reveals that Gold becomes / stays Bullish on both Short and Medium-term. However the larger time-frame of Weekly chart remains Bearish, so again I need to pay attention of potential reversal points and Selling the Top as High (and safely) as I can. Gold was Technically Bearish but Fundamental side prevailed and the result is those Bullish candles which are visible on the charts.
My position: I have Bought Gold throughout Friday's session within #3,330's however closed earlier below #3,348.80 (missed #3,352.80 benchmark break-out) however my Profits were already great so I don't mind. Keep Buying every dip on Gold (aggressive Scalps).

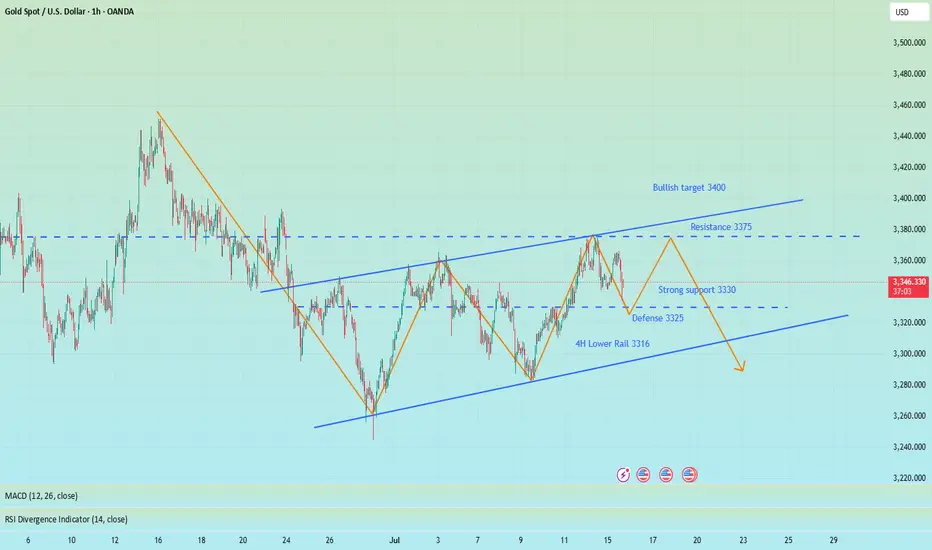
It is the right time to go long after the shock and adjustmentGold opened higher at 3364 today, and after a brief surge to 3374, it entered a stage of shock and retracement. Our plan to arrange short orders near 3370 was successfully implemented, and we stopped profits in batches in the 3360-3355 range, making short-term profits. Overall, although it jumped higher due to the stimulus of news such as the increase in tariffs over the weekend, the momentum of the surge is limited, and the technical side still needs to retrace to digest the gains.
At present, the market has returned to the technical rhythm. The key support refers to the breakthrough point of 3340-3345 last Friday. Further exploration will look at the strong support of 3330. The overall rhythm is still mainly to arrange long orders near the low support, and going with the trend is the key. As long as the 3330 support is not broken, the daily line structure will still maintain a strong bullish trend. Do not blindly chase the short position. The operation of short orders against the trend needs to be particularly cautious. I will promptly remind you of the specific operation strategy according to the changes in the market. You can pay attention to the bottom notification. It is recommended that you keep paying attention and respond to the market rhythm steadily.
Reference for gold operation strategy: Go long on gold near the 3345-3355 area, target the 3365-3370 line. If it breaks above 3370, you can continue to hold and hope for further continuation.

Lingrid | GOLD Weekly Analysis: Consolidation Within UptrendOANDA:XAUUSD market remain trapped in volatile sideways action within a broad consolidation range, following the recent strong rally. Despite the current noisy price behavior, the underlying longer-term bullish momentum remains intact.
Higher timeframe reveals critical technical levels, with gold testing the resistance zone around after breaking above the upward channel. The triangle pattern breakout suggests potential for higher targets, though the market is currently experiencing a corrective pullback near the $3,300 support level. The presence of multiple resistance tests indicates strong institutional interest at these elevated levels.
The 4H chart provides broader context, showing the A-B-C corrective structure from the June highs. The market appears to be forming a potential ascending triangle pattern, with the June high serving as key resistance. The current consolidation between the June high and low suggests accumulation before the next directional move.
Key levels to watch include the $3,300 support zone and the $3,400 resistance area. A decisive break above resistance could trigger another leg higher toward $3,500, while failure to hold support might see a retest of the $3,200 level. The overall structure suggests this consolidation is part of a larger bullish continuation pattern.
If this idea resonates with you or you have your own opinion, traders, hit the comments. I’m excited to read your thoughts!

CPI triggers sell-off, 3330 can be short-term long📰 News information:
1. Focus on tomorrow's CPI data
2. Bowman's speech at the Federal Reserve
3. Tariff information outflows and countries' responses to tariff issues
📈 Technical Analysis:
The short-term trend flag pattern has been formed, and our short-selling strategy perfectly hits the TP. According to current news, Trump has once again urged the Federal Reserve to cut interest rates. While there is almost no possibility of a rate cut this month, there is a high probability that a 25 basis point rate cut will be completed in September, which is also in line with our previous prediction of market trends.
The big negative line in 4H pierced the middle Bollinger band. Although the CPI data is bullish, it has little impact based on the announced value. Market expectations have been digested in advance, so there is no room for a big drop. The upper points still focus on the short-term resistance of 3355-3365. If it rebounds to this area first in the short term, you can consider shorting again. Focus on the strong support of 3330 below. As long as the retracement entity does not fall below 3330, gold will rise again and touch the resistance line of 3375-3385.
🎯 Trading Points:
BUY 3335-3325
TP 3355-3365
In addition to investment, life also includes poetry, distant places, and Allen. Facing the market is actually facing yourself, correcting your shortcomings, facing your mistakes, and exercising strict self-discipline. I share free trading strategies and analysis ideas every day for reference by brothers. I hope my analysis can help you.
OANDA:XAUUSD PEPPERSTONE:XAUUSD FOREXCOM:XAUUSD FX:XAUUSD TVC:GOLD FXOPEN:XAUUSD
XAUUSD Analysis todayHello traders, this is a complete multiple timeframe analysis of this pair. We see could find significant trading opportunities as per analysis upon price action confirmation we may take this trade. Smash the like button if you find value in this analysis and drop a comment if you have any questions or let me know which pair to cover in my next analysis.

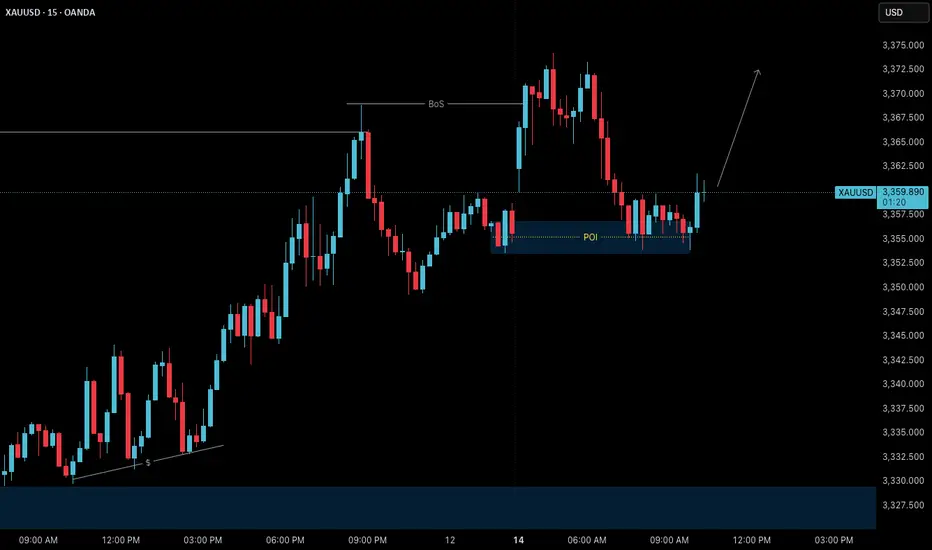
Gold – M15 Bias Within POI Zone | July 14 Analysis🟡 Gold – M15 Bias Within POI Zone | July 14 Analysis
As discussed in our previous H4 analysis, Gold opened the week with a gap above the spinning top candle, effectively skipping seller pressure and breaking above the H4 swing high ( 3366 ).
This Break of Structure (BoS) confirmed the H4 bullish continuation , and now price may be preparing for a pullback toward the 3320 Order Block (OB) before resuming its upward trend.
🔍 M15 Intraday Bias:
📍 Price is currently trading inside the 3355 M15 POI zone — a potential continuation zone
🔄 On Lower Timeframes ( M1 ), a micro ChoCH has already occurred — an early signal of possible bullish interest
However, we're still waiting for a micro BoS to validate the reversal and confirm that the POI is being respected
Until that confirmation is in place, we continue to observe market behavior and remain patient
🧭 High-Probability Scenario:
If the current zone fails to hold or doesn’t provide clean M1 confirmation , we will shift focus to the 3320 OB , which remains the most reliable zone for a long setup in line with the H4 trend
A pullback to this level, combined with confirmation, would provide a strong case for continuation trades
🎯 Observational Trade Plan:
✅ Plan 1 (Aggressive Option):
→ If M1 micro BoS occurs from 3355 zone , a short-term long setup may be considered based on internal structure
✅ Plan 2 (Conservative Option):
→ If price pulls back to 3320 OB and M1 confirms , the setup aligns with higher timeframe trend continuation
🛑 Avoid counter-trading — structure remains bullish, and there's no confirmation for shorts at this point
🧠 Final Thoughts:
Let the market do the work. Structure is already pointing up — all we need is confirmation and timing.
No need to rush. Wait, observe, and only execute when the market invites you in with clarity.
📖 Structure leads, emotion misleads. Follow the flow — trade the mirror, not the noise.
📘 Shared by @ChartIsMirror
XAUUSDDear traders,
In my previous analysis, I mentioned that gold could extend its short-term decline after being rejected from the range boundary. However, that bearish structure was quickly invalidated following a sharp upside move, signaling a potential trend reversal. If this momentum continues, I anticipate that price may soon reach the levels of 3,355 and 3,365.
Feel free to leave a comment if you have any thoughts to add. Good luck!

XAUUSDGold is likely to correct to the price level of 3350. After that, we should wait for the reaction of buyers and sellers in this price range.

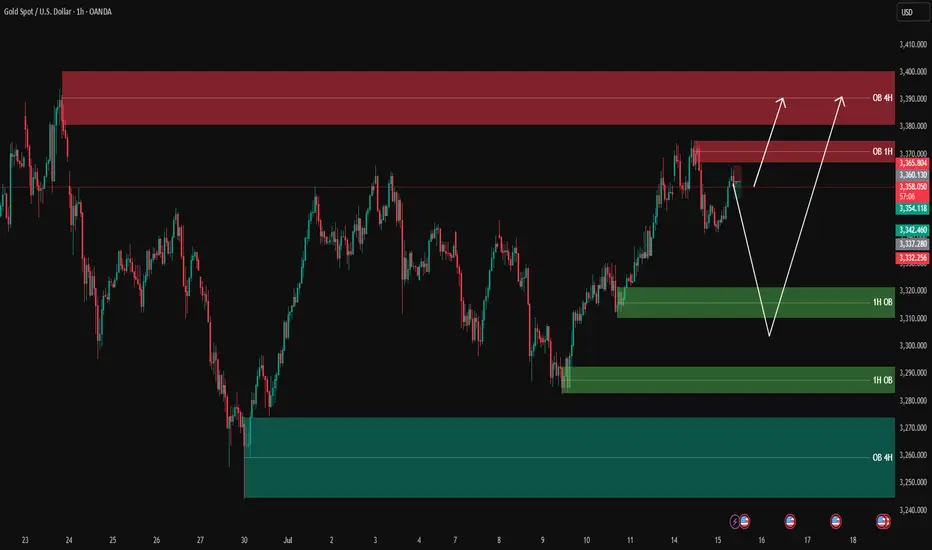
XAUUSD analysis - 1H FVG and OB Setups✅ Green boxes = Buy Order Blocks (OB)
✅ Red boxes = Sell Order Blocks (OB)
✅ Blue boxes = Fair Value Gaps (FVG) (none currently on this chart)
Currently, gold is approaching the 1H Sell OB (red) between 3360 – 3370, which is a strong resistance zone.
We have two clear scenarios:
1️⃣ If sellers step in and we get confirmation, we can look for a pullback down to the lower green buy OB zones:
3320 – 3330 (1H OB)
3290 – 3300 (1H OB)
These zones will be key for looking for buy opportunities with LTF confirmations.
2️⃣ If buyers break above 3370 with a strong close, we can expect a move towards the 4H Sell OB (red) at 3380 – 3395.
🎯 Summary:
✅ Currently looking for a potential sell at the red zone with LTF confirmations.
✅ Watching green zones below for clean buys on a pullback.
✅ If price breaks above, the next target will be 3380 – 3395.
Let price come to your levels, wait for confirmation on 3m/5m for clean entries, and stay disciplined with your plan.
—
📊 ProfitaminFX | Gold, BTC & EUR/USD
📚 Daily setups & educational trades
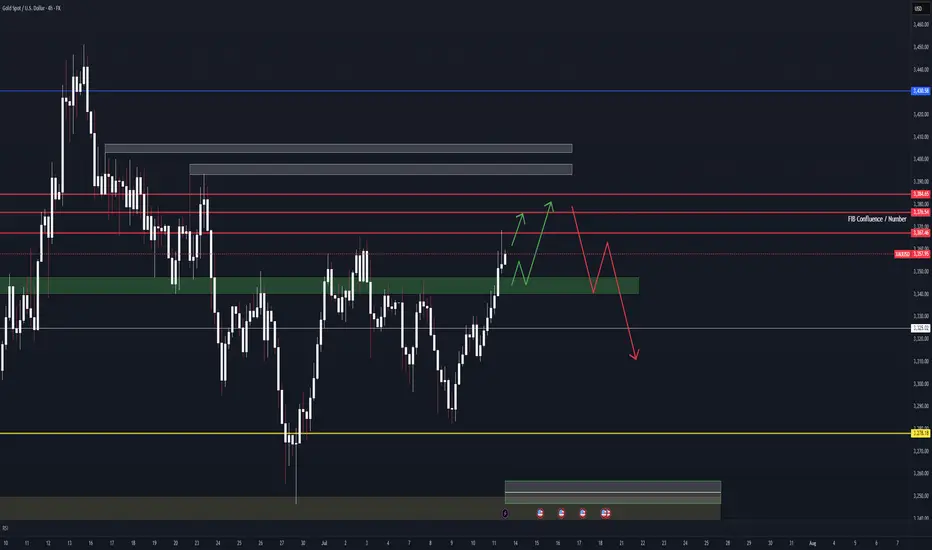
XAUUSD: Market analysis and strategy on July 14Gold technical analysis
Daily chart resistance 3412, support below 3339
Four-hour chart resistance 3400, support below 3349
One-hour chart resistance 3390, support below 3353
Gold news analysis: In the Asian market on Monday, spot gold hit a high of 3374, a new high since June 23. Trump announced last weekend that he would impose a 30% tariff on goods imported from the European Union from August 1, further heating up the market's concerns about international trade and providing momentum for gold prices to rise. Gold prices rose 1% last Friday, closing at 3357, as investors sought safe-haven assets after US President Trump announced multiple tariff measures. Analysts said the uncertainty premium has returned to the market again. Last week, Trump stepped up his tariff offensive against Canada, saying that the United States would impose a 35% tariff on Canadian imports in August and planned to impose a comprehensive tariff of 15% or 20% on most other trading partners. Trump also announced last week that he would impose a 50% tariff on imported copper and a 50% tariff on Brazilian goods.
Gold operation suggestions:
From the current trend analysis, the support below focuses on the four-hour level 3349--53 range support, and the upper pressure focuses on the suppression near the 3400-3412 range. The short-term long and short strength dividing line is 3350. If the four-hour level stabilizes above this position, continue to buy on dips.
Buy: 3350near
Buy: 3356near

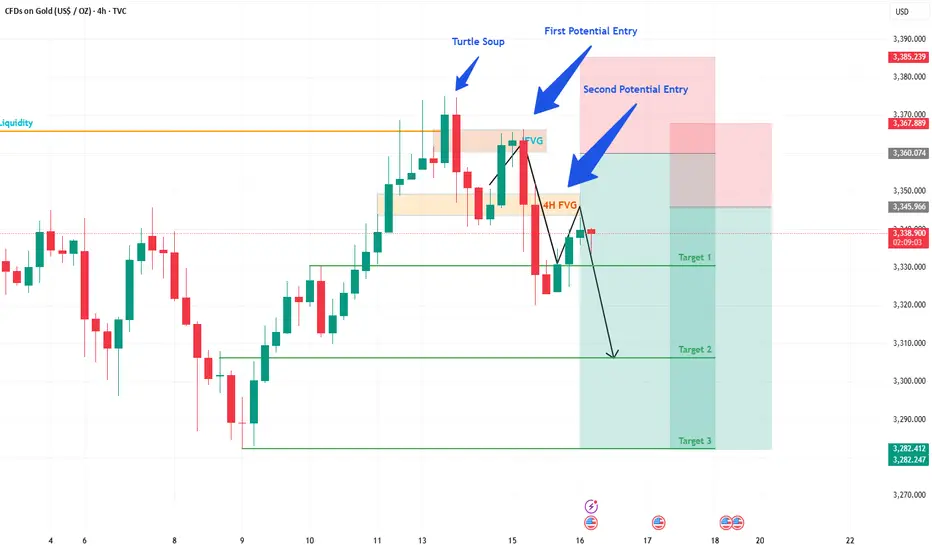
Gold Trade Update: Another Win & What's Next!Hey Fellow Traders! 👋
What a week for Gold! On Monday, I shared my Gold analysis and trade idea, pinpointing a key 1H FVG zone. And guess what? The trade played out perfectly! 🎉 The price dropped ~400 pips from our highlighted area with a tiny drawdown of just 30-40 pips. We smashed Target 1 (TP1), and the market even pushed beyond it! 🙌 Huge congrats to everyone who jumped on this trade! 💰
📈 What's Happening Now?
The price action is heating up! Gold has broken through the 4H FVG, which now acts as an IFVG. The price has retraced almost perfectly to this IFVG, triggering our second layer of entry. 🚦 This is a prime setup, and we’re eyeing TP1 again—and potentially beyond! 🌟
💡 What's the Plan?
Entry: Triggered at the IFVG retracement.
Target: Aiming for TP1, with room for more upside.
Stay sharp and manage your risk—let’s keep those drawdowns tight!
🗣️ Join the Conversation!
What did you think of this move? Did you catch the Gold trade? Drop a comment below, give this post a LIKE 👍, and FOLLOW for more trade ideas and updates! Let’s keep the momentum going and crush it together! 💪
#TradingView #Gold #PriceAction #TradingSuccess
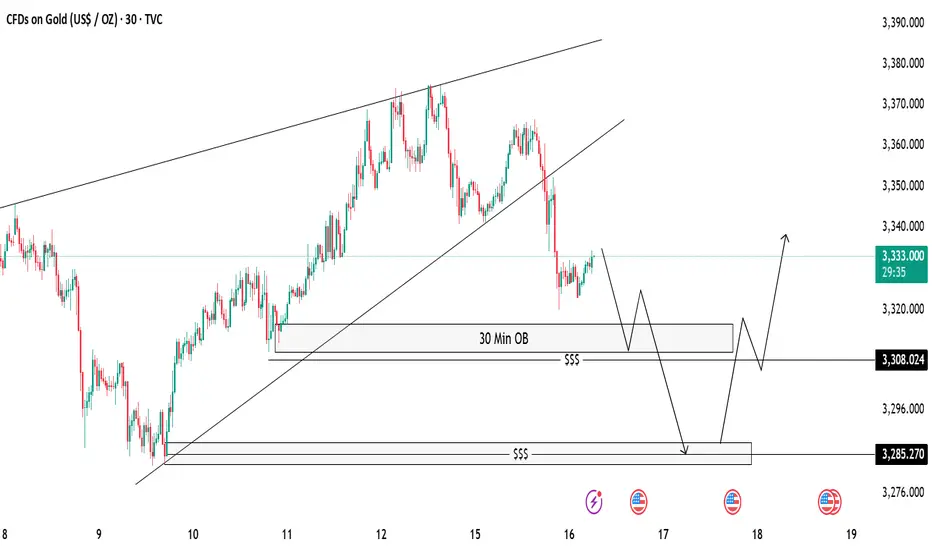
Gold 30-Min OB Analysis – Bounce or Drop..?Gold is showing a break of structure after a big sell-off 🔻. We have marked a 30-Minute Order Block (OB) 📍 which can act as a possible reaction zone.
📌 Two Scenarios We Are Watching:
✅ Scenario 1 (Bullish):
If price taps into the 30M OB and shows bullish rejection 🟢, we can look for buy opportunities, targeting the previous highs near 3335-3340 🎯.
❌ Scenario 2 (Bearish):
If price fails to hold the OB, we will watch for a liquidity sweep (marked with $$$) and expect price to move lower towards the next demand zone near 3285 📉.
⚠️ Key Notes:
Always wait for confirmation before entry.
Patience is the key 🧘♂️ — let the market come to us.
Gold Buying back every dip as expectedTechnical analysis: Interesting turn of events regarding the Short-term as Gold crossed the second Resistance (and is Trading #2 points above it currently) on the Hourly 4 chart and crossed aswell #6-session High’s, which may result as an traditional Buying back every dip (as I advice Traders to Buy every local Low’s recently / what I am doing personally), offering no Selling continuation patterns to Trade by. This is an additional Short-term Buying signal similar to cycle of February #2 - #5 #2020 parabolic rise, which ended as an correction. Hourly 4 chart is under much needed consolidation (current dip Buying) near #3,352.80 benchmark and is again leaning on Bullish side rather than Neutral, as Gold is still ignoring strong Overbought levels following mostly losses on DX (taking strong hits), turning as well Oversold in the process as global Geo-politics dust rises, and as long those guide the market sentiment, further uncertainty on Gold is inevitable and Buying underlying trend will persist.
My position: I repeat / keep in mind that Swing Trading is not possible currently on Gold as Scalp / in & out aggressive orders are key to make excellent Profits (I will advise when to continue with Swing orders). I have firstly Bought Gold on #3,324.80 throughout yesterday’s session and closed my set of Buying orders on #3,332.80 Resistance and since I knew news may push Gold down, had Buy limit on one of my possible reversal points of #3,307.80 / #3,310.80 / #3,313.80 which worked nicely. This was one of many brilliant weeks of Scalping the market. Keep in mind that #MA50 on Daily chart plays big role currently and whether Gold establishes it as an Support or Resistance, major trend will continue. I do believe it will be established as an Support and that’s why I maintain my #3,377.80 and #3,400.80 Medium-term Targets. Enjoy the Profits!

Gold. Swing Signal ONLY no detail. 17/July/25XAUSD.. For the past I try to give as detailed as possible on my chart for learning purpose BUT end up fewer likes and "complicated" to understand comments.. I hope this time you are not getting signals only But nothings to learn...
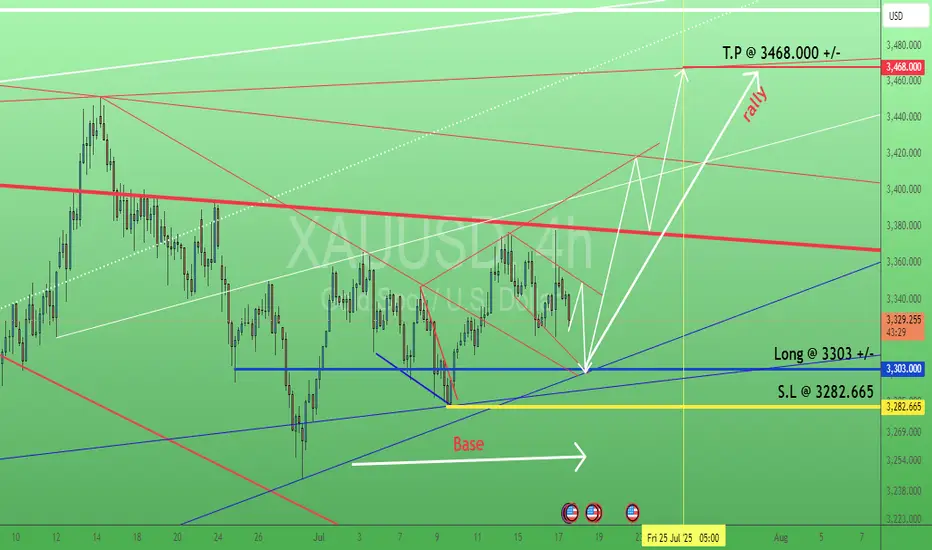
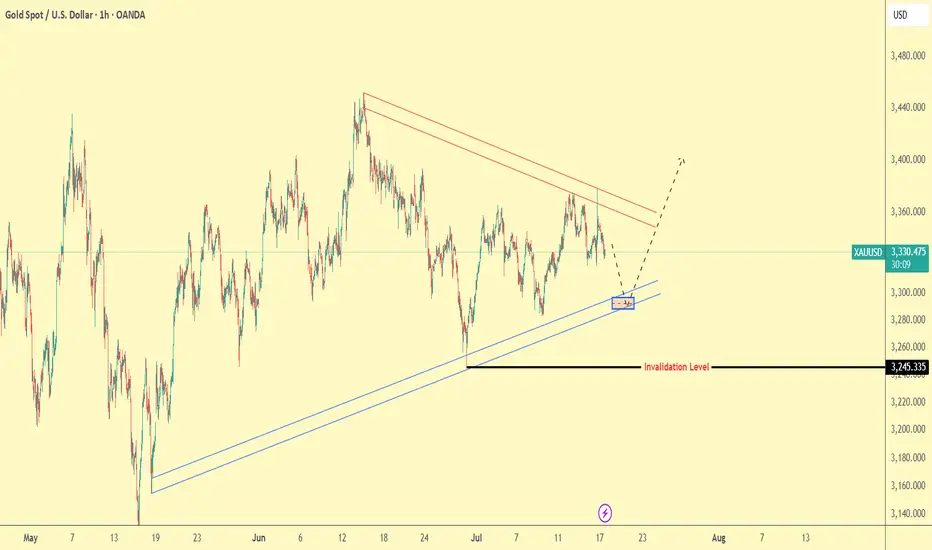
Gold Trade Plan 17/07/2025Dear Traders,
The chart shows that XAU/USD is currently trading near the bottom of a long-term ascending channel (blue lines). At the same time, a descending triangle pattern (red lines) indicates bearish pressure.
🔹 Price is around $3,331, and a strong support zone near $3,285–$3,290 is highlighted. This area could serve as a launch point for a bullish reaction.
🔹 If price bounces here, the expected move could aim for the upper triangle resistance zone around $3,380–$3,390.
🔹 The invalidation level is at $3,245. A break below this level would negate the bullish scenario and potentially lead to further decline.
📌 Summary:
Key support: $3,285–$3,290
Bullish target: $3,380–$3,390
Invalidation level: $3,245
Regards,
Alireza!
Public short selling profit, NY short-term multiple layoutInterest rate futures data showed that the results were in line with our previous expectations, with a lower rate cut this month and a higher probability of a 25 basis point cut in September. In the short term, gold may first take profits and then rebound. NY session trading has just begun. Bros can pay attention to the 3335-3330 area below. If it falls back and stabilizes, you can consider participating in long positions, defending 3325 and targeting 3355-3365.
OANDA:XAUUSD

XAUUSD - Breakdown: CPI Week The only news I am focusing on this week is the mighty CPI coming up this week. With oil & energy prices creeping higher, I expect CPI to come in just in line to prediction or slightly elevated, though nothing too drastic, this keeps us in a higher-for-longer rate environment, fueling a DXY bullish bounce and keeping the Gold bears in play. If the data surprises, we’ll adjust accordingly and trade accordingly.
If the numbers land in line with forecasts: No real surprises, market already priced in. In this case, the outlook is neutral to slightly bearish.
If below forecast, a weaker CPI print could increase the odds of an early rate cut. That will likely weaken the dollar, which is good for $Gold. So, this will lead to bullish sentiment for $XAUUSD.
Will also watch RISK ON/OFF Sentiment
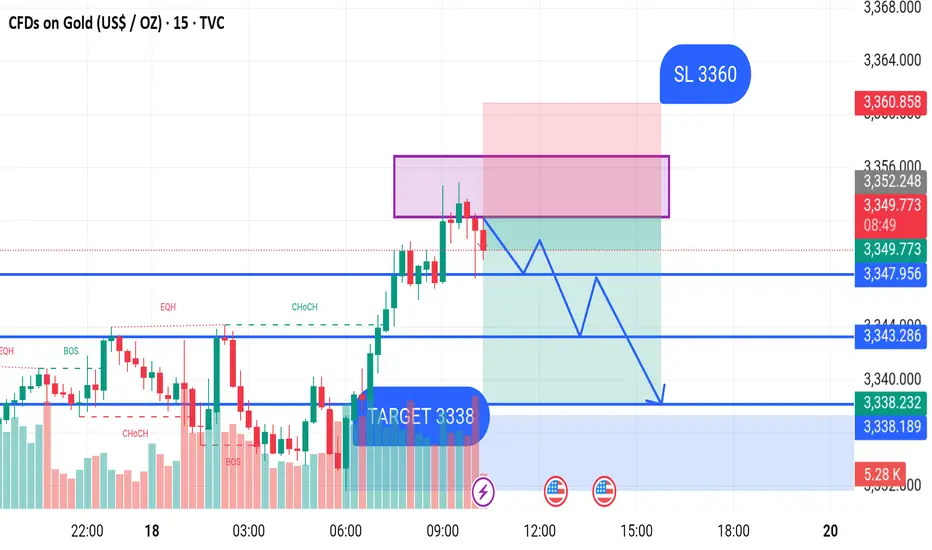
GOLD SELL M15 Gold (XAU/USD) 15-Min Chart Analysis – July 18, 2025
Overview:
This chart shows a bearish outlook on gold with a potential short-selling opportunity. The price has recently reacted to a supply zone and is expected to move lower.
---
Key Levels:
Entry Zone (Supply Area): Around $3,350–$3,352
Stop Loss (SL): Above the supply zone at $3,360
Target (TP): $3,338 (primary target)
---
Market Structure:
CHoCH (Change of Character) and BOS (Break of Structure) suggest a bearish reversal from the previous bullish move.
EQH (Equal Highs) acted as liquidity grab before price dropped.
Price has tapped into a supply zone and shown signs of rejection.
---
Trade Idea:
Expecting price to form a lower high and then continue the downward trend.
The projected move is a series of lower highs and lower lows toward the $3,338 target level.
This area is also supported by a previous demand zone and may act as a strong take-profit region.
---
Summary:
A short position is favored from the $3,350 area, with a stop loss at $3,360 and a target of $3,338. The bearish bias is based on multiple CHoCH and BOS confirmations, indicating potential downside momentum.

Gold is in the Bearish DirectionHello Traders
In This Chart GOLD HOURLY Forex Forecast By FOREX PLANET
today Gold analysis 👆
🟢This Chart includes_ (GOLD market update)
🟢What is The Next Opportunity on GOLD Market
🟢how to Enter to the Valid Entry With Assurance Profit
This CHART is For Trader's that Want to Improve Their Technical Analysis Skills and Their Trading By Understanding How To Analyze The Market Using Multiple Timeframes and Understanding The Bigger Picture on the Charts
