GOLD (XAUUSD): Sticking to the Plan
Update for my last Sunday's post for Gold.
Previously, we spotted a cup & handle pattern on a daily time frame.
It turned into an ascending triangle pattern - another bullish formation this week.
I am sticking to the same plan - our strong bullish signal is a breakout
of a neckline of the pattern and a daily candle close above 3378.
It will confirm a strong up movement.
❤️Please, support my work with like, thank you!❤️
I am part of Trade Nation's Influencer program and receive a monthly fee for using their TradingView charts in my analysis.
CFDGOLD trade ideas

Gold Buying every dip as expectedTechnical analysis: Interesting turn of events regarding the Short-term as Gold crossed the second Resistance (and is Trading #2 points above it currently) on the Hourly 4 chart and crossed aswell #6-session High’s, which may result as an traditional Buying back every dip (as I advice Traders to Buy every local Low’s recently / what I am doing personally), offering no Selling continuation patterns to Trade by. This is an additional Short-term Buying signal similar to cycle of February #2 - #5 #2020 parabolic rise, which ended as an correction. Hourly 4 chart is under much needed consolidation (current dip Buying) near #3,352.80 benchmark and is again leaning on Bullish side rather than Neutral, as Gold is still ignoring strong Overbought levels following mostly losses on DX (taking strong hits), turning as well Oversold in the process as global Geo-politics dust rises, and as long those guide the market sentiment, further uncertainty on Gold is inevitable and Buying underlying trend will persist.
My position: I repeat / keep in mind that Swing Trading is not possible currently on Gold as Scalp / in & out aggressive orders are key to make excellent Profits (I will advise when to continue with Swing orders). I have firstly Bought Gold on #3,324.80 throughout yesterday’s session and closed my set of Buying orders on #3,332.80 Resistance and since I knew news may push Gold down, had Buy limit on one of my possible reversal points of #3,307.80 / #3,310.80 / #3,313.80 which worked nicely. This was one of many brilliant weeks of Scalping the market. Keep in mind that #MA50 on Daily chart plays big role currently and whether Gold establishes it as an Support or Resistance, major trend will continue. I do believe it will be established as an Support and that’s why I maintain my #3,377.80 and #3,400.80 Medium-term Targets. Enjoy the Profits!

GOLD Is Very Bullish! Buy!
Please, check our technical outlook for GOLD.
Time Frame: 9h
Current Trend: Bullish
Sentiment: Oversold (based on 7-period RSI)
Forecast: Bullish
The market is approaching a key horizontal level 3,328.03.
Considering the today's price action, probabilities will be high to see a movement to 3,388.97.
P.S
Overbought describes a period of time where there has been a significant and consistent upward move in price over a period of time without much pullback.
Disclosure: I am part of Trade Nation's Influencer program and receive a monthly fee for using their TradingView charts in my analysis.
Like and subscribe and comment my ideas if you enjoy them!

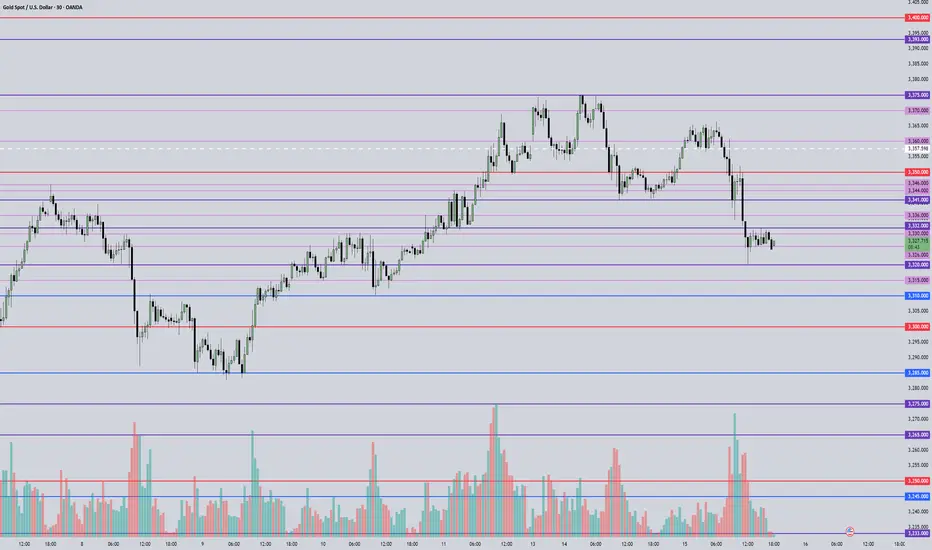
Gold----Sell near 3357, target 3330---3320Gold market analysis:
Yesterday's gold daily Asian session was still a normal shock drop. We sold at 3340 and 3341 twice to 3322 to make all profits. 3320 is the previous low point and the moving average support position. This position is also a strong support today. Yesterday, the Trump and Powell incidents made gold strongly rise to around 3377. In addition, the Middle East bully bombed Syria again, which is also the main reason for the surge in gold. However, the fundamentals are only short-lived. In the end, the gold daily line closed positive, but closed with a super long upper shadow line. Selling is still not dead. Today's gold buying and selling have opportunities, and the possibility of a direct decline is small. I estimate that the Asian session will be repaired, and our ideas for buying and selling in the Asian session can be intercepted. If it breaks 3320, consider chasing and selling again, which means that selling has started again.
The highest rebound in the Asian session was around 3352, and the highest position in 1 hour was around 3357. Today's small suppression in the white session is 3357. The following support focuses on two positions, one is 3320, and the other is 3330. I estimate that the fluctuation range of the Asian session is 3320-3357. Let's observe and wait for the position in the Asian session.
Pressure 3352 and 3357, strong pressure 3366, support 3320 and 3330, and the watershed of strength and weakness in the market is 3350.
Fundamental analysis:
Trump's dissatisfaction with Powell has not been a day or two, and the conflict is inevitable. The impact on gold is also short-term. Yesterday's pull-up and dive is a case in point.
Operation suggestion:
Gold----Sell near 3357, target 3330---3320

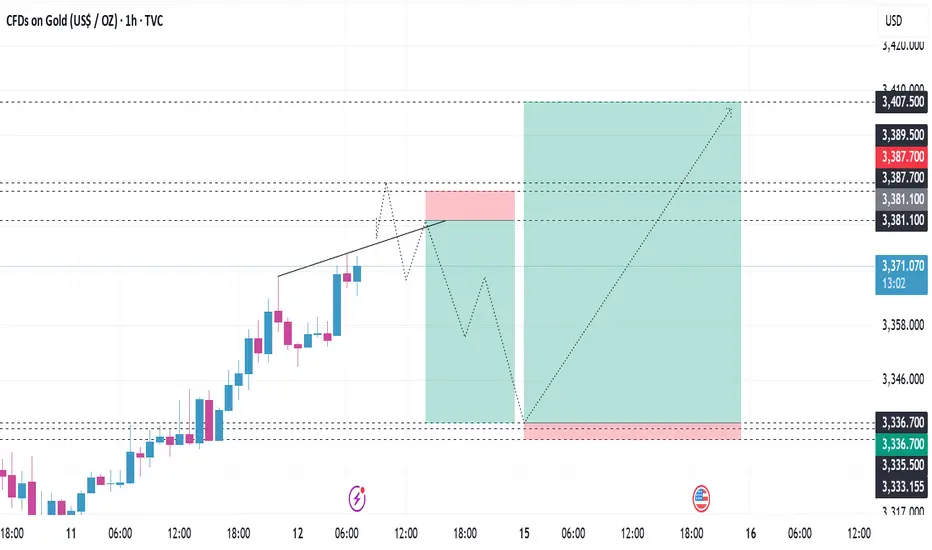
Excellent Profits / quick updateAs discussed throughout my yesterday's session commentary: "My position: My strategy remains the same, Buying every dip on Gold on my calculated key entry points which Gold respects and ultimately, anticipating #3,377.80 Resistance break-out to the upside."
I have broken my personal record throughout yesterday's session (#200.000 EUR Profit) using #25 and #50 Lots, Buying Gold with set of Scalp orders within #3,340's, #3,330's and final #3,327.80 reversal zone. I will not make any more moves today, will call it for the session and await tomorrow's E.U. session Highly satisfied with Profit. Needless to mention, #3,377.80 and #3,400.80 mark remains my Medium-term Target zones as I continue Buying every local Low's for us.

XAU / USD 4 Hour ChartHello traders. Taking a look at the 4 hour chart i have marked my area of interest to watch for potential scalp buy / sell trade set ups. Lower time frame confirmation is a must. This is speculation for what could be a trade, not a signal or advice to just click buy or sell. All time frames must align. Remember that all we are doing as spot gold day traders on leveraged accounts is trying to ride the wave as it moves. Don't try to force or rush a trade. Big G gets my thanks and a shout out. Let's see how the Pre NY volume that is starting to come in now does for gold. Be well and trade the trend.

XAU / USD 1 Hour ChartHello traders. Happy Wednesday. Taking a quick look at the hourly chart, as per my last analysis, we did move down, a bit lower than i expected, and then pushed back up. Saying that, I have marked my current area to watch for the retest to push up some more, or do we move back down to retest the support area. Patience is key, and I can see both scalp buys and sell trade set ups. Big G gets my thanks. Let's see how things play out with the current 4 hour and 1 hour candles. Be well and trade the trend.

XAUUSDThese two scenarios are expected for gold this week, and analyses will be presented in shorter time frames in the open time.

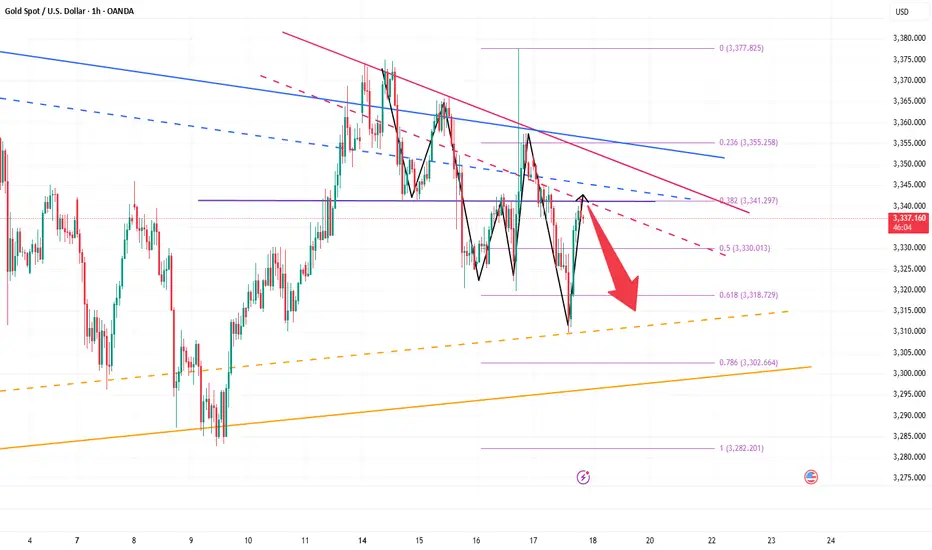
short recovery, trend line✍️ NOVA hello everyone, Let's comment on gold price next week from 07/14/2025 - 07/18/2025
⭐️GOLDEN INFORMATION:
Gold prices surged nearly 1% on Friday as market sentiment soured in response to US President Donald Trump’s controversial trade policies targeting Canada, while hinting at broader tariffs on other nations and copper. At the time of writing, XAU/USD is trading at $3,354, rebounding from intraday lows of $3,322.
On Thursday, Trump announced a 35% tariff on Canadian imports, though goods complying with the 2020 USMCA trade agreement remain exempt. He also signaled intentions to expand tariffs across most trading partners, proposing blanket rates ranging from 15% to 20%.
With a light US economic calendar, attention turned to Fed commentary. Chicago Fed President Austan Goolsbee pushed back on calls for rate cuts aimed at reducing government borrowing costs, stressing the central bank’s focus remains firmly on employment and price stability.
⭐️Personal comments NOVA:
growth according to the trend, maintaining the accumulation price zone above 3300
🔥 Technically:
Based on the resistance and support areas of the gold price according to the H4 frame, NOVA identifies the important key areas as follows:
Resistance: $3392, $3447
Support: $3330, $3308, $3246
🔥 NOTE:
Note: Nova wishes traders to manage their capital well
- take the number of lots that match your capital
- Takeprofit equal to 4-6% of capital account
- Stoplose equal to 2-3% of capital account
- The winner is the one who sticks with the market the longest

XAUUSD MULTI TIME FRAME ANALYSISHello traders , here is the full multi time frame analysis for this pair, let me know in the comment section below if you have any questions , the entry will be taken only if all rules of the strategies will be satisfied. wait for more price action to develop before taking any position. I suggest you keep this pair on your watchlist and see if the rules of your strategy are satisfied.
🧠💡 Share your unique analysis, thoughts, and ideas in the comments section below. I'm excited to hear your perspective on this pair .
💭🔍 Don't hesitate to comment if you have any questions or queries regarding this analysis.

Gold 30Min Engaged ( Reversal Entry's Detected )Time Frame: 30-Minute Warfare
Entry Protocol: Only after volume-verified breakout
🩸Bullish Reversal 3285 : 3272 Zone
🩸Bearish Reversal 3326 : 3334 Zone
➗ Hanzo Protocol: Volume-Tiered Entry Authority
➕ Zone Activated: Dynamic market pressure detected.
The level isn’t just price — it’s a memory of where they moved size.
Volume is rising beneath the surface — not noise, but preparation.
🔥 Tactical Note:
We wait for the energy signature — when volume betrays intention.
The trap gets set. The weak follow. We execute.
Gold 30Min Engaged ( Reversal Entry's Detected )

XAUUSD MULTI TIME FRAME ANALYSISHello traders , here is the full multi time frame analysis for this pair, let me know in the comment section below if you have any questions , the entry will be taken only if all rules of the strategies will be satisfied. wait for more price action to develop before taking any position. I suggest you keep this pair on your watchlist and see if the rules of your strategy are satisfied.
🧠💡 Share your unique analysis, thoughts, and ideas in the comments section below. I'm excited to hear your perspective on this pair .
💭🔍 Don't hesitate to comment if you have any questions or queries regarding this analysis.

July 16, 2025 - XAUUSD GOLD Analysis and Potential OpportunitySummary:
As long as 3332 holds as resistance, the early session plan is to sell on pullbacks into resistance.
An update will follow before the Asian session opens to confirm or adjust the plan.
Stay flexible and watch price behavior at key levels — follow the trend and manage risk carefully.
🔍 Key Levels to Watch:
• 3366 – Previous high resistance
• 3357 – Resistance
• 3350 – Midpoint resistance
• 3341 – Resistance
• 3332 – Key resistance
• 3320 – Intraday key support
• 3310 – Support
• 3300 – Psychological support
• 3285 – Critical support
• 3275 – Support
📈 Intraday Strategy
• SELL if price breaks below 3320 → target 3315, then 3310, 3300, 3285
• BUY if price holds above 3332 → target 3335, then 3341, 3346, 3350
👉 If you’d like to learn how I time my entries and place stop-losses, give this post a like — if enough people are interested, I’ll update this post to include more details soon!
Disclaimer: This is my personal opinion, not financial advice. Always trade with proper risk management.
XAUUSD on consolidation Gold is currently holding Range of 3340-3375 along with rising channel.
What's possible scanarios we have?
▪️I'm looking for Buying towards at 3340-3345 support area if it's sustained
Secondly 3330-3335 consider as structural support H4 remains above then keep buy set targets at 3370 then 3380.
-> Moral of Day buy the Dips
Additional TIP:
Below 3330-3325 I will Activate my resell and hold till 3315 then 3305.
#XAUUSD

GOLD 4H CHART ROUTE MAP UPDATEHey Everyone,
Please see update on our 4H Chart route map, also playing out perfectly with our levels being respected, as analysed.
We have our bearish target hit at 3295 and currently testing for support and bounce. Ema5 cross and lock below this level will open the swing range and failure to lock will see price reject and head up for the Bullish target. The 1h chart route map from yesterdays update also has the swing range open, which we need to keep in mind when planning to buy dips.
We will keep the above in mind when taking buys from dips. Our updated levels and weighted levels will allow us to track the movement down and then catch bounces up.
We will continue to buy dips using our support levels taking 20 to 40 pips. As stated before each of our level structures give 20 to 40 pip bounces, which is enough for a nice entry and exit. If you back test the levels we shared every week for the past 24 months, you can see how effectively they were used to trade with or against short/mid term swings and trends.
The swing range give bigger bounces then our weighted levels that's the difference between weighted levels and swing ranges.
BULLISH TARGET
3364
EMA5 CROSS AND LOCK ABOVE 3364 WILL OPEN THE FOLLOWING BULLISH TARGETS
3429
EMA5 CROSS AND LOCK ABOVE 3429 WILL OPEN THE FOLLOWING BULLISH TARGET
3499
EMA5 CROSS AND LOCK ABOVE 3429 WILL OPEN THE FOLLOWING BULLISH TARGET
3499
EMA5 CROSS AND LOCK ABOVE 3499 WILL OPEN THE FOLLOWING BULLISH TARGET
3561
BEARISH TARGETS
3295 - DONE
EMA5 CROSS AND LOCK BELOW 3295 WILL OPEN THE SWING RANGE
3242
3171
EMA5 CROSS AND LOCK BELOW 3171 WILL OPEN THE SECONDARY SWING RANGE
3089
3001
As always, we will keep you all updated with regular updates throughout the week and how we manage the active ideas and setups. Thank you all for your likes, comments and follows, we really appreciate it!
Mr Gold
GoldViewFX

Gold’s Last Stand? Major Retest at 3310–3300 Under the influence of negative news, gold today fell below the recent low of 3320 and continued to fall to around 3310. The current gold structure looks particularly obvious, the center of gravity of gold gradually moves downward, and the short trend is extremely obvious; however, as gold repeatedly probes the 3320-3310 area, we can clearly see the resistance of gold to falling, and multiple structural supports are concentrated in the 3320-3300 area. So as long as gold does not fall below this area, gold bulls still have the potential to rebound.
However, for now, after experiencing discontinuous sharp rises and falls, gold needs to undergo a short-term technical repair, so it may be difficult for a unilateral trend to appear in the short term. So I have reason to believe that gold will focus on rectification and repair next. The important resistance area we have to pay attention to above is in the 3340-3350 area; and the important support below is in the 3310-3300 area.
Currently, gold is fluctuating in a narrow range around 3340, and the short-term rebound momentum is sufficient, but I still believe that gold will fall back again and test the support of 3320-3300 area after consuming the bullish energy. So for short-term trading, first of all, I advocate shorting gold in the 3340-3350 area, and expect gold to retreat to the 3320-3300 area during the consolidation process.
SellTrend Line Break
Previous Day Volume
Rejection Point
Untapped Order Point
Asian Session
High Structure Swing

Update gold time 1 hourI checked on the 15 minute time frame and saw liquidity points for us to consider trading, Gold price is being supported, candlestick patterns are showing signs of breaking resistance so consider volume for the sell-off plan. If you do not have a buy order in the idea below 👇
then set up a buy order according to this trading idea, good luck to you and us.
Gold Intraday Trading Plan 7/18/2025I should follow through my trading plan on weekly trend. Instead of rising up, gold fell through early yesterday and rose back above 3340 in late US session.
I will trust my weekly analysis and based on the red daily candle, I expect gold continue to fall and it should break 2320 today. After that, we could see 2280 or even 2250 today.

XAUUSD on retest (swing ready)Gold is currently holding Rangebound 3345-3375.Also market has potential of buying towards 3400 then Drop again.
What's possible scanarios we have?
▪️I'm looking for Buying at 3340-3345 support area ,if we found 3340-3345 as correction and H4-H1 remains above then keep buy set targets at 3365 then 3375.
Additional TIP:
Below 3330 I will Activate my resell and hold till 3315 then 3305.
All the entries should be taken if all the rules are applied
#XAUUSD

Bottom-out rebound, 3338 short orders enteredYesterday, the gold market was affected by Trump's remarks about firing Federal Reserve Chairman Powell. After briefly falling below 3320, the price quickly rose by nearly 60 points, reaching a high of 3377. Trump later clarified that the news was false, triggering a gold sell-off, and the market rose and fell. As of Thursday's European session, gold prices fell back to around 3320. After a rapid rise and fall in the US market on Wednesday, the downward trend continued on Thursday, with the US market hitting a low of 3310 before rebounding. Judging from the 4-hour chart, the Bollinger Bands failed to open downward, indicating that the current market lacks continuity and the overall market remains in a volatile pattern. In a volatile market, it is recommended to pay attention to key support and resistance levels for high-selling and low-buying operations. The upper resistance range is currently at 3343-3351, and the important watershed support level below is at 3310.
OANDA:XAUUSD

XAUUSD AND GOLD NEXT MOVR DOWN TREND 🧠 OANDA:XAUUSD Professional Trading Idea (Smart Money Concept Based)
🔍 Market Structure Overview:
CHoCH → confirmed on bullish move (July 11–13), signaling reversal from bearish to bullish.
LH to LL → clean bearish leg formed post FVG mitigation and rejection.
BMS (Break of Market Structure) confirmed → shift back to bearish structure.
Price recently tapped into a deep FVG + demand zone, showing rejection wick and bounce.
---
🎯 Trading Plan: Intraday Sell-Bias Idea (Unless Proven Otherwise)
🔴 Bias: Bearish
📍 Entry Zone: Around 3340–3345 (inside FVG + previous supply zone)
🛑 SL (Invalidation): Above 3350–3355 zone
🎯 TP1: 3330
🎯 TP2: 3315
🎯 TP3: 3304 (major demand zone)
---
✅ Entry Conditions (Confirmation Required):
Rejection candlestick or bearish engulfing in 3340–3345 zone
EMA resistance hold
No bullish BMS on lower timeframes
---
⚠️ Invalidation Plan:
If price breaks above 3355 with momentum and closes bullish → structure flips to bullish, look for buys only on retracement to 3345–3350 zone.

XAU / USD 30 Minute ChartHello taders. We have news here in the US in under an hour. Saying that, I marked the scalp buy and sell areas. Smarter trading would be for a break out of the range so I can take trades with clean traffic and less choppiness. Let's see if I can get an entry, otherwise I will wait for post news / NY open to look again. Big G gets a shout out. Be well and trade the trend.
