The market is bullish, but I am bearish. Don't regret it.📰 News information:
1. Focus on tomorrow's CPI data
2. Bowman's speech at the Federal Reserve
3. Tariff information outflows and countries' responses to tariff issues
📈 Technical Analysis:
This week, the US CPI data, consumer index, tariff issues and geopolitical situation are all key points to pay attention to. In the morning, both our long and short positions had good gains, making a good start to the week. The best way is to follow the trend and grab limited profits!
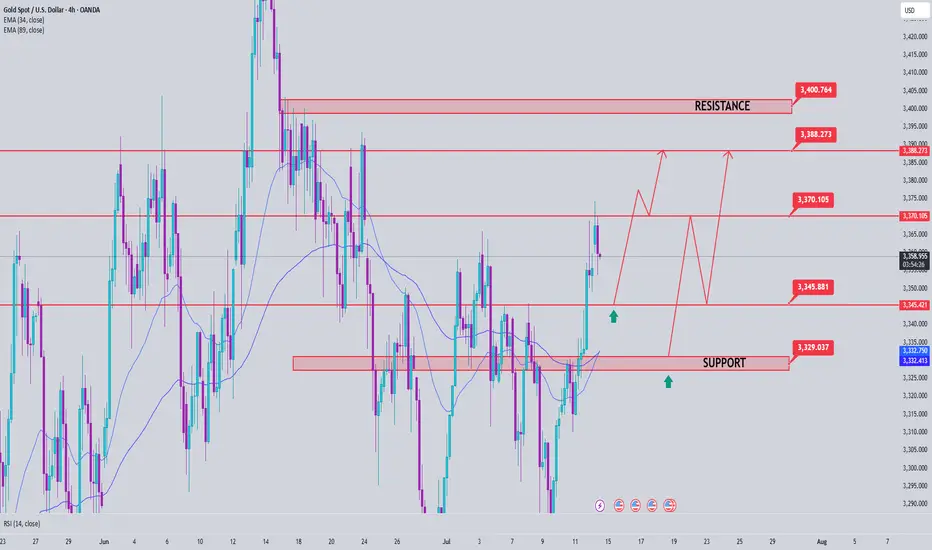
In the 4H cycle, the current trend shows a Zhendan upward pattern, and bulls still occupy the dominant low position in the short term. At the daily level, three consecutive positive days at the end of last week broke through the middle track, and the high point broke through the previous high, indicating that the short-term adjustment is over, and the rise in the market to test 3400 will be a high probability event. At present, the MACD daily line is bullish, the Bollinger Bands are flat, and the gold price is above the middle track. The bulls are strong, but there is still a need for a correction. Intraday trading focuses on the strength of the European session. If the European session is strong, the US session will continue to rise, and if the European session is weak, the US session will bottom out again. In the short term, if it touches 3370-3375 again, you can consider shorting and look towards 3365-3355 SL 3380.
🎯 Trading Points:
sell 3370-3375
tp 3365-3355-3345
In addition to investment, life also includes poetry, distant places, and Allen. Facing the market is actually facing yourself, correcting your shortcomings, facing your mistakes, and exercising strict self-discipline. I share free trading strategies and analysis ideas every day for reference by brothers. I hope my analysis can help you.
FXOPEN:XAUUSD TVC:GOLD FX:XAUUSD FOREXCOM:XAUUSD PEPPERSTONE:XAUUSD OANDA:XAUUSD
CFDGOLD trade ideas

XAUUSD (Gold) - Future Outlook (as of mid-July 2025)In continuation :-
The future outlook for Gold (XAUUSD) is a complex interplay of various macroeconomic factors, geopolitical developments, and market sentiment. As of mid-July 2025, several key themes are likely to shape its trajectory:
Monetary Policy and Interest Rate Expectations (Central Bank Actions):
Impact: Gold is a non-yielding asset. Therefore, its attractiveness is highly sensitive to interest rate movements. Higher interest rates (or expectations of them) tend to increase the opportunity cost of holding gold, as investors can earn more from interest-bearing assets like bonds. Conversely, lower rates or a more dovish stance from central banks (like the U.S. Federal Reserve, ECB, BoJ) reduce this opportunity cost, making gold more appealing.
Current Context: As of mid-2025, markets are closely watching central bank rhetoric regarding potential rate cuts. If inflation continues to moderate, leading to clearer signals or actual rate cuts, this would likely be a positive catalyst for gold prices. However, if inflation proves stickier or central banks maintain a "higher for longer" policy, gold could face headwinds.
Inflation Outlook:
Impact: Gold has historically been considered a hedge against inflation and a store of value during periods of rising prices.
Current Context: If inflation remains elevated or shows signs of re-accelerating, demand for gold as an inflation hedge could increase, providing support to prices. If inflation falls back significantly to central bank targets, this traditional appeal might lessen somewhat, unless other safe-haven drivers emerge.
U.S. Dollar Strength:
Impact: Gold is primarily priced in U.S. dollars. A stronger U.S. dollar makes gold more expensive for international buyers holding other currencies, potentially dampening demand. A weaker dollar has the opposite effect, making gold cheaper and generally supportive of higher gold prices.
Current Context: The dollar's strength is heavily influenced by U.S. interest rate differentials and the relative economic performance of the U.S. versus other major economies. A "risk-off" environment can also lead to dollar strength (as a safe-haven itself), which can create a counteracting force for gold.
Geopolitical Risks and Economic Uncertainty:
Impact: Gold is a classic "safe-haven" asset. In times of increased geopolitical tension, economic instability, financial market turmoil, or escalating conflicts, investor demand for gold typically surges as a store of value.
Current Context: Global geopolitical landscape remains complex, with ongoing regional conflicts, trade disputes, and political uncertainties. Any escalation in these areas would likely contribute to increased safe-haven demand for gold. Similarly, if there are growing concerns about a global economic slowdown or recession, gold's appeal as a safe haven could strengthen.
Central Bank Gold Demand:
Impact: Central banks globally have been significant buyers of gold in recent years, diversifying their reserves away from the U.S. dollar. Their sustained buying provides a structural floor to gold demand.
Current Context: Continued strong buying by central banks, particularly from emerging economies, is expected to remain a supportive factor for gold prices in the medium to long term.
Overall Future Outlook (Mid-July 2025 Perspective):
The outlook for Gold (XAUUSD) appears cautiously bullish in the medium term, with potential for continued appreciation.
Positive Drivers: The primary drivers are the increasing likelihood of future interest rate cuts (even if gradual), potentially persistent underlying inflation concerns, and the ongoing elevated geopolitical risks and global economic uncertainties. Continued strong central bank demand further underpins this outlook.
Potential Headwinds: A significantly stronger-than-expected U.S. dollar (e.g., due to a major global "risk-off" event that drives dollar demand, or robust U.S. economic outperformance leading to delayed rate cuts) could provide a counteracting force. Rapid disinflation could also temper some of gold's appeal.
In summary, Gold is likely to remain an important asset in investor portfolios, acting as both an inflation hedge and a safe haven. Its price action will be particularly sensitive to central bank policy shifts and global stability.
⚠️ Disclaimer: This post is educational content and does not constitute investment advice, financial advice, or trading recommendations. The views expressed here are based on technical analysis and are shared solely for informational purposes. The stock market is subject to risks, including capital loss, and readers should exercise due diligence before investing. We do not take responsibility for decisions made based on this content. Consult a certified financial advisor for personalized guidance

Gold Price Analysis July 14Gold confirmed a break above the key 3330 level on Friday, opening a clear uptrend. The reaction at the 3368 GAP zone further strengthens the current bullish momentum. With the current market structure, the bias is leaning towards buying on corrections around support zones.
🔍 Technical levels to watch:
Support: 3345 – 3331 (potential buying zone)
Resistance: 3387 – 3400 (bullish target)
📌 Trading strategy:
BUY Trigger 1: Price tests and rejects the 3345 support zone
BUY Trigger 2: Buy around 3331 – strong support zone
🎯 Target: 3400
The current trend favors a buying strategy on reasonable price correction conditions. It is necessary to monitor price action around support zones to confirm effective entry points.
Gold elliot wave countMarket Structure – Corrective Wave 2 Still in Progress
We're currently in a Wave 2 correction, unfolding as a classic ABC structure – labeled with Circle A → Circle B → Circle C.
✅ Circle A and Circle B are already complete.
We're now in the move from Circle B → Circle C, which itself is unfolding as a:
→ (A) → (B) → (C) (in parentheses)
Currently, we are in the move from (B) to (C), which again is breaking down as a smaller A → B → C move.
🔍 Key Levels to Watch:
📈 We might now be completing Wave A of (C) around the 3362 level.
🔁 A pullback to around 3322 could follow as Wave B,
➡️ leading to a final Wave C (of (C), of Circle C, completing Wave 2) targeting around 3405.
⏳ What’s Next?
Once we hit the 3405 zone, that would potentially complete the entire Wave 2 correction.
From there, I expect a trend reversal to the downside, beginning the next impulsive wave down.


Daily live trade with XAUUSD in 15m/30m/1h 20250718Daily live trade with XAUUSD in 15m/30m/1h 20250718

Gold Trading Idea: Short Opportunity on 15-Min Descending ChanneHello TradingView Community,
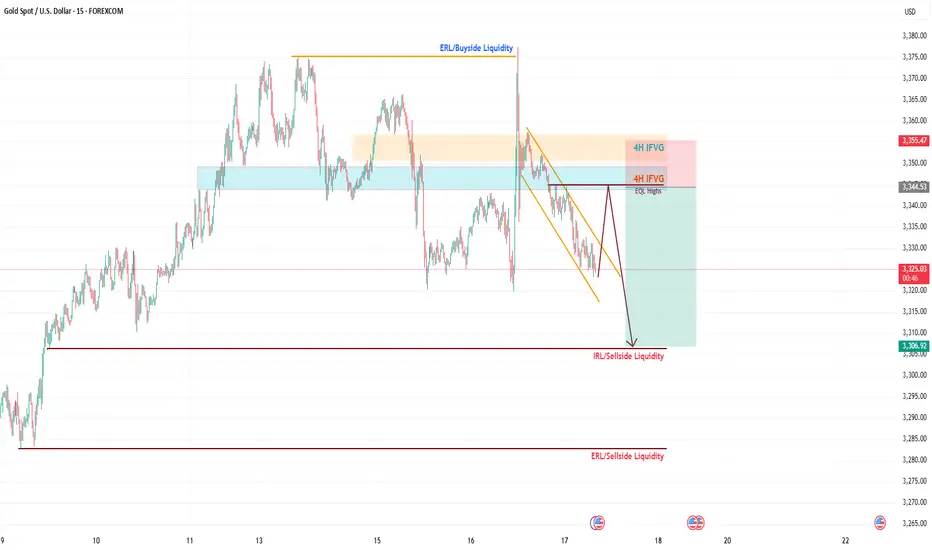
Following up on my Gold analysis from Monday, the price action has respected the levels I outlined (check my previous posts for the breakdown), delivering solid trade opportunities except yesterday's news-driven volatility. Today, we're eyeing a short setup on Gold based on the 15-minute timeframe.
Technical Analysis:
Gold is moving within a descending channel on the 15-min chart.
I've identified equal highs and a small FVG (Fair Value Gap) aligning with the 61.8% Fibonacci retracement of the channel's range.
This confluence zone is where I expect the price to react, potentially clearing liquidity above the channel before reversing.
Trade Plan:
Entry: Wait for the price to reach the confluence zone (equal highs + 61.8% Fib + FVG) and show a clear reaction (e.g., rejection or reversal pattern) before entering a short position.
Take Profit: Targeting 3310 level.
Risk Management: If the price fails to reach the zone and breaks lower, I'll stay out to avoid chasing trades. Patience is key here.
Stay disciplined, traders! Let the price come to our zone, and always manage your risk.
Follow for more setups, like this post if you found it helpful, and drop your thoughts in the comments below! Let’s discuss!
#Gold #XAUUSD #ShortSetup #TechnicalAnalysis
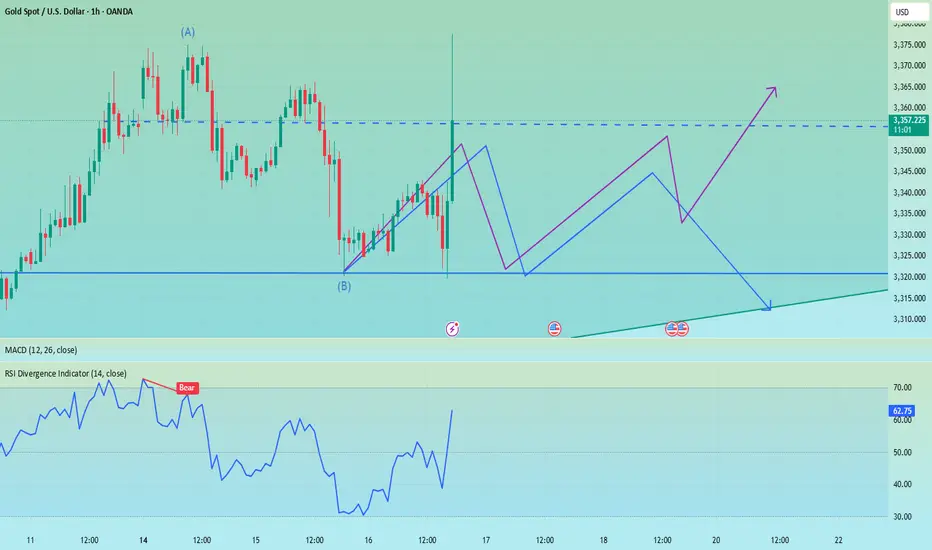
Gold Market Analysis (XAU/USD) – MMC Analysis + Liquidity Target🧠 Market Context Overview:
Gold recently experienced a highly impulsive move from a major demand zone, suggesting strong smart money activity. The market is currently in the redistribution phase of the MMC (Market Maker Cycle), transitioning between a reversal impulse and a liquidity targeting move.
Let’s dissect the key zones, structure, and confluences that support the ongoing market narrative.
📍 1. Strong Demand Reaction (3X Demand Spike):
We start with a triple-tap demand rejection, where the price sharply reversed to the upside. This kind of movement typically represents:
Institutional Entry Points
Stop-Hunt Below Previous Lows
Liquidity Grab Before Expansion
This strong bullish engulfing candle signifies position building by smart money, often the beginning of a significant leg up.
🧱 2. Reversal Zone & Liquidity Imbalance:
The highlighted green zone between $3,370–$3,375 is crucial. Why?
It’s an inefficiency zone where price moved too fast with low resistance.
This created a liquidity void that typically needs to be revisited (also known as FVG – Fair Value Gap).
The area also coincides with structural resistance, making it a high-probability target for price to revisit and reject again or break through with intent.
📌 Smart money always returns to areas of unfilled liquidity to close their positions or trap late retail entries.
🔺 3. Volume Contraction (Wedge Pattern Formation):
After the explosive push upward, the market started compressing, forming a descending wedge — a classical volume contraction pattern.
What does this mean?
Volatility is decreasing
Liquidity is building up
Big breakout is expected
It’s like pulling a slingshot — the more it contracts, the stronger the release will be. The direction will depend on which side breaks first.
🔁 4. Previous Structure Flipped (Support turned Resistance):
You’ll notice a key level around $3,353–$3,355 acting as a flipped structure.
This was previously a support zone that got broken.
Now it’s acting as resistance — a classic example of support/resistance flip.
This adds confluence to the idea of a possible rejection or reaction in this area.
🧠 Structure flipping is a smart money trick — break structure, retrace to trap liquidity, and then run the opposite direction.
📊 5. MMC Logic – Market Maker Cycle in Play:
Here’s how the MMC is flowing:
Accumulation (bottom consolidation)
Manipulation (liquidity sweep below demand)
Expansion (aggressive upward move)
Contraction (volume dies, price slows down)
Now we’re waiting for the next manipulation or expansion phase.
The current wedge is the pause before the next move, which could fill liquidity in the reversal zone or go lower to sweep resting sell-side liquidity.
🎯 Trading Scenarios:
✅ Bullish Bias (if breakout happens):
Break and close above the wedge
Retest previous flipped structure successfully
Target: Liquidity zone at $3,370–$3,375
🎯 This move would fill the imbalance and potentially tag sell-side liquidity sitting at the top.
❌ Bearish Bias (if rejection holds):
Failure to break above flipped structure
Breakdown from the wedge
Target: Demand origin around $3,325–$3,315
🧲 A move lower would make sense if liquidity remains uncollected beneath the range.
🧵 Final Thoughts:
Gold is currently in a high-probability setup zone. We have:
✅ Clear demand reaction
✅ Imbalance above
✅ Volume contraction
✅ Flipped structure
✅ Strong MMC confluence
Now it's a waiting game. Let the market show its hand — either a clean breakout with volume or a fakeout/rejection and reversal.
📌 "Trade what you see, not what you think. Let the levels and liquidity guide your decision."

XAU / USD 30 Minute ChartHello traders. Here is a quick 30 minute chart showing where I am looking for potential buy scalp and sell scap trade set ups. Let's see how the current 30 minute candle closes. Pre NY volume starts coming in about 40 minutes from this writing. Big G gets a shout out. Be well and trade the trend.

Xausd techinical analysis.This chart shows the Gold Spot price vs. the U.S. Dollar (XAU/USD) on a 1-hour timeframe, with some key technical analysis elements applied. Here's a breakdown of the key components:
---
🔍 Chart Analysis
1. Current Price:
The current market price is 3,344.875, down 0.32%.
2. Support Zones (Purple Rectangles at Bottom):
Around 3,335 – 3,340
Lower support around 3,325 – 3,330
3. Resistance Zone (Purple Rectangle at Top):
Around 3,370 – 3,375
4. **Trendline (Pink


GOLD - 1H VIEWStill looking for a move lower in the coming weeks. There are 2 possible zones I would like to see Gold sell off from:
Zone 1: $3,356 - $3,340 (CMP)
Zone 2: $3,406 - $3,426
Being patient, with no current sells. This analysis is just my current theory. If $3,450 (Wave 2 high) is taken out, then we are heading towards $3,600+

Short position profit, focus on 3355-3345 support📰 News information:
1. Focus on tomorrow's CPI data
2. Bowman's speech at the Federal Reserve
3. Tariff information outflows and countries' responses to tariff issues
📈 Technical Analysis:
The short-term bears have successfully hit the TP to realize profits, and the trading strategy is still valid. Continue to pay attention to the 3355-3345 support during the day. If effective support is obtained here, you can consider going long. For the rebound, the first TP can focus on the 3365 line. If the gold price breaks through 3380 in the future, it will not be far from 3400. If it falls below, pay attention to the support of 3330-3320 below. It is expected that this is the limit position of short-term bearishness. The impact of tariffs is still there, and the bullish trend remains optimistic in the short term, unless Europe, Japan and other countries have a new solution to tariffs.
🎯 Trading Points:
BUY 3355-3345
TP 3365-3380-3400
In addition to investment, life also includes poetry, distant places, and Allen. Facing the market is actually facing yourself, correcting your shortcomings, facing your mistakes, and exercising strict self-discipline. I share free trading strategies and analysis ideas every day for reference by brothers. I hope my analysis can help you.
OANDA:XAUUSD PEPPERSTONE:XAUUSD FOREXCOM:XAUUSD FX:XAUUSD TVC:GOLD FXOPEN:XAUUSD

Gold Price Analysis: Bearish Trend Likely to ContinueGold Price Analysis: Bearish Trend Likely to Continue
Gold prices have been forming lower lows, signaling a sustained **bearish trend in the market. This downward movement indicates weakening bullish momentum, with sellers dominating price action. Currently, the price is moving in a secondary trend (a short-term correction within the broader primary trend). However, in the upcoming trading sessions, this secondary trend may conclude, leading to a resumption of the primary bearish trend.
A key factor to watch is the emergence of a candlestick reversal pattern, such as a bearish engulfing or evening star formation, which could confirm further downside momentum. If such a pattern appears, gold prices may extend their decline, potentially testing the critical support level near $3,250. A decisive break below this level could accelerate selling pressure, opening the door for deeper corrections.
On the upside, $3,450 remains a strong resistance zone. Any rebound attempts could face rejection near this level unless there is a significant shift in market sentiment—such as a dovish Fed policy change or renewed safe-haven demand. Traders should monitor key economic data, including inflation reports and interest rate decisions, as these factors heavily influence gold’s direction.
Key Levels to Watch:
- Support: $3,250 (Break below may trigger further selling)
- Resistance: $3,450 (Reversal point if buyers regain control)
Trading Strategy:
- Short-term traders may look for selling opportunities near resistance levels, targeting $3,250.
- Long-term investors should wait for a confirmed trend reversal before entering bullish positions.

XAU / USD 4 Hour ChartHello traders. New week, gold opened with a nice push up. Taking a look at the 4 hour chart I have marked my areas of interest for me to see what happens during the overnight sessions. Wishing everyone a safe and profitable trading week. Shout out to Big G. Be well and trade the trend. I will post again in the later part of the London session or when Pre NY volume starts in the morning here in the US. Thanks so much.

XAUUSD Daily Outlook – July 21, 2025Hey traders 💙
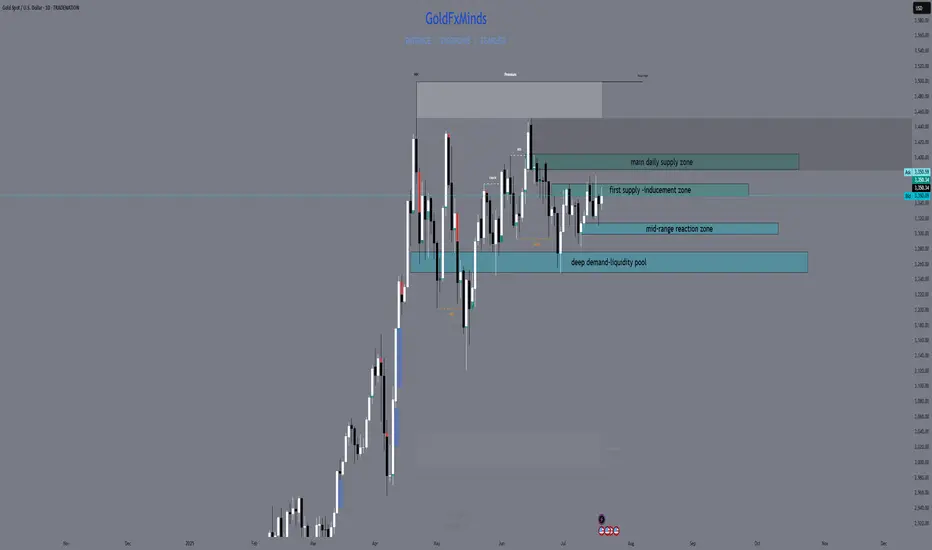
Gold continues to move inside a high timeframe range, with both bulls and bears defending structure at the edges. Price remains stuck between supply and demand — and only the strongest levels matter now. Here’s how the chart truly looks:
🔸 Key Supply Zones
1. 3380–3405: Main Daily Supply / Liquidity Pool Above
This is the top wall of the current range and the zone with the highest supply. Multiple failed breakouts, long upper wicks, and a clear cluster of liquidity just above. Unless we get a solid daily close above 3405, this area remains a trap for late buyers and a magnet for liquidity grabs.
2. 3355–3375: Internal Supply / Inducement Block
This zone has acted as an internal ceiling since the last CPI event. Here, price repeatedly failed to close above, and every return has produced quick rejections or fake breakouts. It often works as an inducement, catching breakout buyers and flipping the market lower.
🔹 Key Demand Zones
1. 3312–3300: Internal Demand / Mid-range Reaction
Here we see a clear reaction point where buyers have defended aggressively after CPI and NY session moves. It’s an internal demand area, often working as a temporary bounce or a place for stop hunts before larger moves.
2. 3275–3250: Main Daily Demand / Liquidity Pool Below
This is the base of the range, holding as support multiple times this month. Every dip into this zone has triggered large bounces, but the liquidity sitting below is also a key magnet for potential sweeps. Only a full daily breakdown here would flip the higher timeframe bias bearish.
📊 Technical Structure & Strategy
We are stuck between Main Supply (3380–3405) and Main Demand (3275–3250).
Every “middle” move is either inducement or a set-up for liquidity collection — not a real trend.
No daily close above 3405 → no bullish continuation.
No breakdown below 3250 → no clean bearish momentum.
Your edge: Only act when price confirms a reaction at a major zone with CHoCH/BOS, strong OB, or a liquidity sweep.
🧠 Takeaway:
This is not the time to guess direction — let the market show its intent at the edges. Use TradingView alerts on your key levels, be ready for volatility from macro news, and don’t get trapped in the mid-range games.
💬 Comment your bias or questions below.
Follow GoldFxMinds for more advanced XAUUSD updates and sniper-level education.
Stay patient, stay precise, and let structure work for you!
Posted using Trade Nation broker feed. As a participant in the Trade Nation Influencer program, I receive a monthly fee for using their TradingView charts in my educational content.
— GoldFxMinds 💙
The short-selling idea remains unchanged, defend 3355📰 News information:
1. Powell responds to White House issues
2. Will other countries impose reciprocal sanctions on tariffs?
📈 Technical Analysis:
Gold closed with a long lower shadow on the daily line yesterday and closed with a doji on the hourly line. In the short term, gold may continue to rise and is expected to touch the 3355 line. If gold cannot break through and stabilize above 3355, then gold may fall back. We can still consider shorting, and the target can be 3330. If the trend is as expected, it may form the embryonic form of a head and shoulders bottom. On the contrary, if the gold price breaks through 3355, stop loss on short positions and pay attention to the high resistance of 3375-3385.
🎯 Trading Points:
SELL 3340-3355
TP 3330-3320
In addition to investment, life also includes poetry, distant places, and Allen. Facing the market is actually facing yourself, correcting your shortcomings, facing your mistakes, and exercising strict self-discipline. I share free trading strategies and analysis ideas every day for reference by brothers. I hope my analysis can help you.
TVC:GOLD PEPPERSTONE:XAUUSD FOREXCOM:XAUUSD FX:XAUUSD OANDA:XAUUSD FXOPEN:XAUUSD

Treat it as a long-short wash-out shock, and go long on pullback📰 News information:
1. Initial jobless claims data
2. June retail data
3. Beware of Trump's remarks about firing Powell
📈 Technical Analysis:
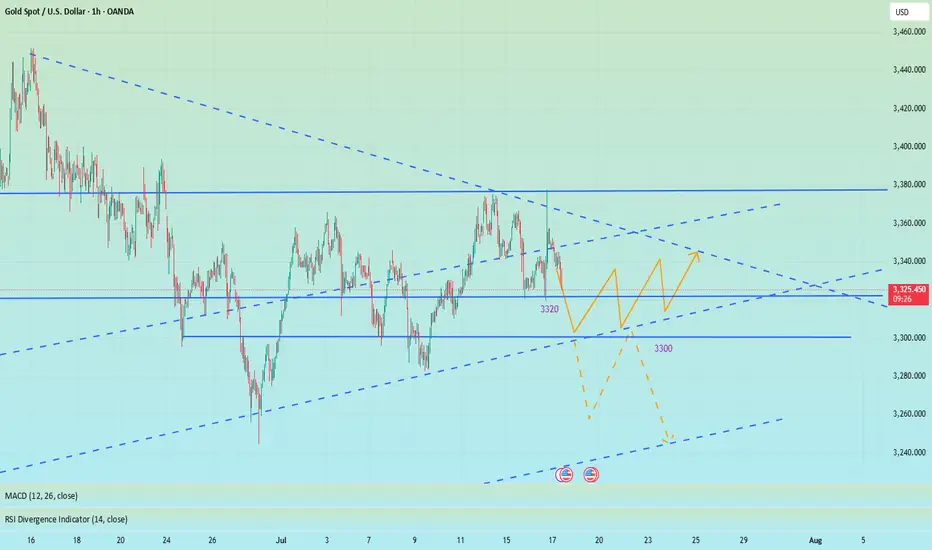
Last night, the daily line closed at around 3347. The current short-term daily line range is 3355-3300. The short-term support below is still 3320. Once it falls below 3320, it will look to 3310-3300. Short-term trading is still volatile. If the intraday retracement reaches 3320-3310, consider going long, and the defense is 3300, with the target at 3340-3350. Under the current rhythm of long and short wash, don't chase the rise and sell the fall, look at it rationally, and brothers who trade independently must bring SL.
🎯 Trading Points:
BUY 3320-3310
TP 3340-3350
In addition to investment, life also includes poetry, distant places, and Allen. Facing the market is actually facing yourself, correcting your shortcomings, facing your mistakes, and exercising strict self-discipline. I share free trading strategies and analysis ideas every day for reference by brothers. I hope my analysis can help you.
FXOPEN:XAUUSD OANDA:XAUUSD FX:XAUUSD FOREXCOM:XAUUSD PEPPERSTONE:XAUUSD TVC:GOLD
The firing of Powell set off the market, don't chase the longsTrump showed a draft of the letter to fire Powell, but whether Powell will be fired in the end remains to be seen, but the impact on the gold market is undoubtedly huge. The wolves have now smelled a very dangerous scent. Don’t chase high prices. Don’t chase high prices! ! ! After all, the impact of the news comes and goes quickly, and there is a high possibility of a reversal later in the evening. The final suppression position of the current gold daily line is 3340. If the closing line today can maintain above 3340, then gold will usher in a real bullish trend in the future.
OANDA:XAUUSD
XAU / USD 1 Hour ChartHello traders. Taking a look at the hourly chart, I have marked my no trade zone / area of interest for the upcoming sessions. I also marked where I would look for a long position if we dipped down to said area. Let's see how the overnight sessions play out. Big G get all my thanks. Be well and trade the trend. Thank you for checking out my analysis.

GOLD - SHORT TO $2,800 (1H UPDATE)Taking a HIGH RISK ENTRY here for sell's. Bearish momentum seems to be kicking in, so I am willing to take a high risk entry, with a smaller lot size then usual.
Our second entry zone still sits higher around $3,400 so I am being careful here with tight risk management.

XAU/USD analysis & outlookWeekly Outlook: GOLD (XAUUSD)
This week, I’ll be monitoring different scenarios, as price is currently far from any of my key Points of Interest (POIs).
My nearest potential buy is around the 3-hour demand zone. While it's not the most ideal entry—since it isn’t located in a discounted area—I’ll still keep an eye on it.
That said, I would prefer to see a deeper retracement into the 6-hour demand zone, which is in a far more discounted region. This zone offers a stronger setup, and I could see price launching from there again if tapped.
We’ve already seen a strong bullish reaction from last week’s demand zone, and based on current momentum, I could see price continuing upward until it reaches my next sell opportunity—the 3-hour supply zone, which sits at a premium level.
Confluences for GOLD Buys:
✅ Bullish structure — price has broken to the upside and remains overall bullish.
✅ Fresh 3H and 6H demand zones formed, which price could return to.
✅ Liquidity above — including trendline liquidity and previous Asia highs.
✅ Fundamentals — potential tariff cuts could fuel long-term bullish momentum for gold.
✅ Bearish Dollar Index (DXY) aligns with the bullish gold outlook.
📌 If price doesn’t retrace and instead continues to push higher, I’ll wait for another break of structure to the upside on the way toward the supply zone before reassessing entries.
Let’s stay focused and let the market come to us. Wishing everyone a great trading week ahead! 👊📈

