Treat it as a long-short wash-out shock, and go long on pullback📰 News information:
1. Initial jobless claims data
2. June retail data
3. Beware of Trump's remarks about firing Powell
📈 Technical Analysis:
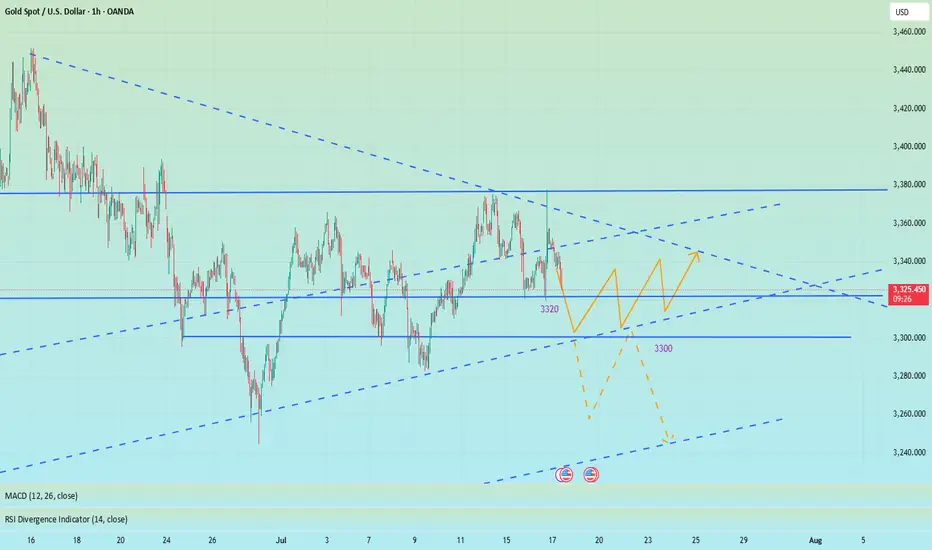
Last night, the daily line closed at around 3347. The current short-term daily line range is 3355-3300. The short-term support below is still 3320. Once it falls below 3320, it will look to 3310-3300. Short-term trading is still volatile. If the intraday retracement reaches 3320-3310, consider going long, and the defense is 3300, with the target at 3340-3350. Under the current rhythm of long and short wash, don't chase the rise and sell the fall, look at it rationally, and brothers who trade independently must bring SL.
🎯 Trading Points:
BUY 3320-3310
TP 3340-3350
In addition to investment, life also includes poetry, distant places, and Allen. Facing the market is actually facing yourself, correcting your shortcomings, facing your mistakes, and exercising strict self-discipline. I share free trading strategies and analysis ideas every day for reference by brothers. I hope my analysis can help you.
FXOPEN:XAUUSD OANDA:XAUUSD FX:XAUUSD FOREXCOM:XAUUSD PEPPERSTONE:XAUUSD TVC:GOLD
CFDGOLD trade ideas
The firing of Powell set off the market, don't chase the longsTrump showed a draft of the letter to fire Powell, but whether Powell will be fired in the end remains to be seen, but the impact on the gold market is undoubtedly huge. The wolves have now smelled a very dangerous scent. Don’t chase high prices. Don’t chase high prices! ! ! After all, the impact of the news comes and goes quickly, and there is a high possibility of a reversal later in the evening. The final suppression position of the current gold daily line is 3340. If the closing line today can maintain above 3340, then gold will usher in a real bullish trend in the future.
OANDA:XAUUSD
XAU / USD 1 Hour ChartHello traders. Taking a look at the hourly chart, I have marked my no trade zone / area of interest for the upcoming sessions. I also marked where I would look for a long position if we dipped down to said area. Let's see how the overnight sessions play out. Big G get all my thanks. Be well and trade the trend. Thank you for checking out my analysis.

GOLD - SHORT TO $2,800 (1H UPDATE)Taking a HIGH RISK ENTRY here for sell's. Bearish momentum seems to be kicking in, so I am willing to take a high risk entry, with a smaller lot size then usual.
Our second entry zone still sits higher around $3,400 so I am being careful here with tight risk management.

XAU/USD analysis & outlookWeekly Outlook: GOLD (XAUUSD)
This week, I’ll be monitoring different scenarios, as price is currently far from any of my key Points of Interest (POIs).
My nearest potential buy is around the 3-hour demand zone. While it's not the most ideal entry—since it isn’t located in a discounted area—I’ll still keep an eye on it.
That said, I would prefer to see a deeper retracement into the 6-hour demand zone, which is in a far more discounted region. This zone offers a stronger setup, and I could see price launching from there again if tapped.
We’ve already seen a strong bullish reaction from last week’s demand zone, and based on current momentum, I could see price continuing upward until it reaches my next sell opportunity—the 3-hour supply zone, which sits at a premium level.
Confluences for GOLD Buys:
✅ Bullish structure — price has broken to the upside and remains overall bullish.
✅ Fresh 3H and 6H demand zones formed, which price could return to.
✅ Liquidity above — including trendline liquidity and previous Asia highs.
✅ Fundamentals — potential tariff cuts could fuel long-term bullish momentum for gold.
✅ Bearish Dollar Index (DXY) aligns with the bullish gold outlook.
📌 If price doesn’t retrace and instead continues to push higher, I’ll wait for another break of structure to the upside on the way toward the supply zone before reassessing entries.
Let’s stay focused and let the market come to us. Wishing everyone a great trading week ahead! 👊📈

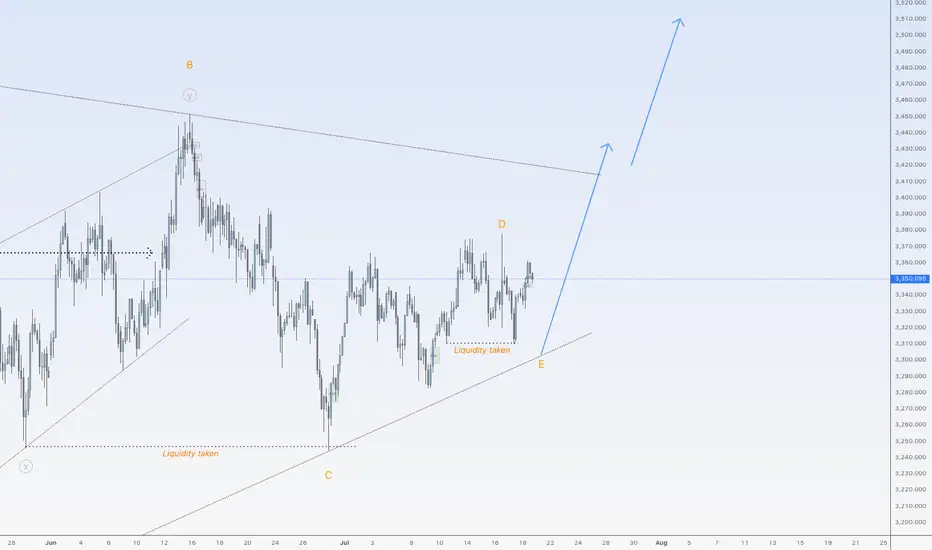
Gold is ready to go upHi traders,
Last week gold made another correction down for Wave E but after that it broke the low again. This could be wave 2 of the next impulsive wave up and gold will continue to rise next week.
Or price makes one more move down for wave E and then start the next impulsive wave up.
Let's see what price does and react.
Trade idea: Wait for a small correction down on a lower timeframe and a change in orderflow to bullish to trade longs.
If you want to learn more about trading FVG's & liquidity sweeps with wave analysis, please make sure to follow me.
This shared post is only my point of view on what could be the next move in this pair based on my technical analysis.
Don't be emotional, just trade your plan!
Eduwave


Gold Spot / U.S. Dollar (XAU/USD) 4-Hour Chart4-hour chart from OANDA displays the price movement of Gold Spot (XAU/USD) against the U.S. Dollar, showing a current price of $3,329.145 with a decrease of $18.455 (-0.55%). The chart highlights key levels including a sell price of $3,328.920 and a buy price of $3,329.370, with a recent trading range between $3,355.339 and $3,312.393. The data spans from late June to mid-July 2025, with notable price fluctuations and a shaded area indicating a potential trading zone.

XAUUSD: Market analysis and strategy for July 16.Gold technical analysis
Daily chart resistance level 3382, support level 3300
Four-hour chart resistance level 3365, support level 3320
One-hour chart resistance level 3342, support level 3325.
Yesterday, the lowest price fell to 3320, then fluctuated upward, and rebounded to 3343. As the price fell below 3341 yesterday and accelerated downward, a transition from support to resistance was formed here. Focus on the high point of the NY market rebound yesterday, 3352. Whether it can break through here will determine whether the market continues to rise or is blocked and then falls back like yesterday.
It is worth noting that the trend of the past two days is that Asia is rising and rebounding, and the NY market is falling. Today may be a cycle of yesterday and the day before yesterday. At present, gold is fluctuating and rebounding at 3320. If the NY market cannot break through 3352, it will continue to fall. For the time being, it can be sold high and bought low in this range. After falling below 3320, the next short-term target is 3310~3300.
BUY: 3324 SL: 3320
SELL: 3320 SL: 3325
SELL: 3352 SL: 3357

Excellent Profits / quick updateAs discussed throughout my yesterday's session commentary: "My position: My strategy remains the same, Buying every dip on Gold on my calculated key entry points which Gold respects and ultimately, anticipating #3,377.80 Resistance break-out to the upside."
I have broken my personal record throughout yesterday's session (#200.000 EUR Profit) using #25 and #50 Lots, Buying Gold with set of Scalp orders within #3,340's, #3,330's and final #3,327.80 reversal zone. I will not make any more moves today, will call it for the session and await tomorrow's E.U. session Highly satisfied with Profit. Needless to mention, #3,377.80 and #3,400.80 mark remains my Medium-term Target zones as I continue Buying every local Low's for us.

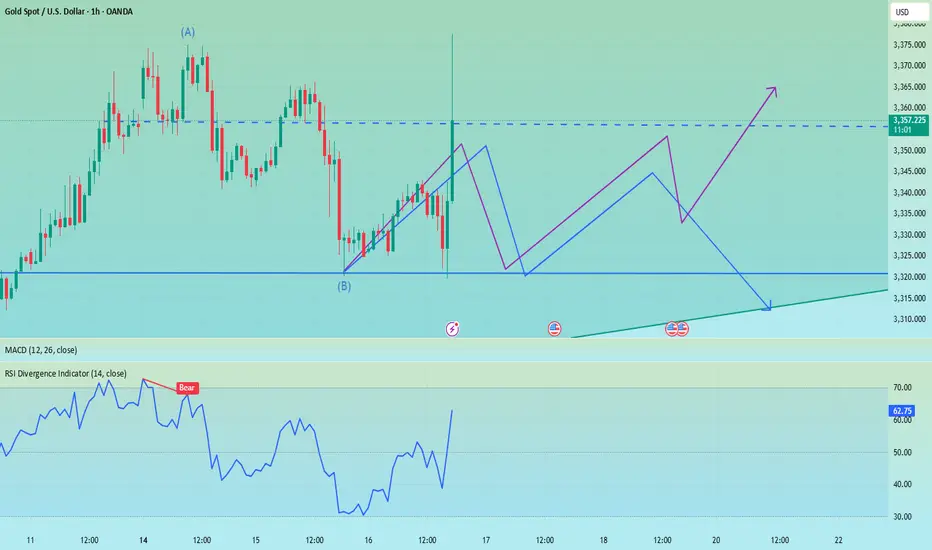
XAUUSD Trade Plan | 15 July 2025After observing the recent low breakdown and a clear liquidity grab, we saw a strong direction confirmation breakout. This suggests that the market is likely to continue its upward momentum.
🔄 Breakdown/Seller Trap triggered the reversal
🔹 Last Important Low respected
📈 Breakout confirms bullish direction
✅ Plan:
I’ll be watching for a pullback into the grey demand zone (highlighted area) for a potential long entry.
🕵️♂️ No FOMO — I’ll only enter after price shows clear bullish behavior in this zone.
🎯 Target: 3,365.89 resistance
📍 Entry Zone: Grey box (based on previous structure)
Let me know your thoughts — are you also watching this zone?
#XAUUSD #GoldAnalysis #LiquidityGrab #SmartMoneyConcepts #PriceAction #TradingPlan #TradingView

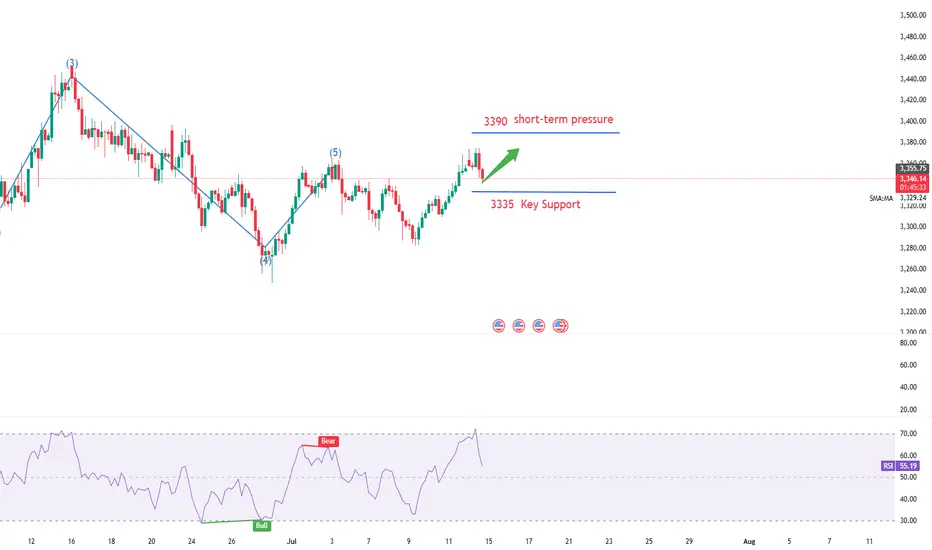
Gold----Buy near 3348, target 3369-3389Gold market analysis:
Looking back at last week's market, the market performance on Monday and Tuesday last week was quite abnormal, belonging to the rhythm of a big oscillation. The following three trading days were basically relatively normal, and the market rose all the way after the buy-in. The overall market was a bottoming-out and rebounding market. Recently, investors are very confused about whether the general trend is bullish or bearish? First of all, we need to distinguish how long the general trend cycle is? If you look at the weekly line, you can at least see a 2-4 week trend. If you want to see a trend for a month, then you have to look at the weekly K-shaped and monthly trend. I understand that the long-term trend is at least a trend of one month to half a year. With the current instability of the international situation, the trend of Russia and Ukraine, the situation in the Middle East, and Trump's global tariff war, I think the half-year trend is bullish. We are short-term traders, and basically can't see that far. Looking at the trend of one week at most is the limit. Playing with long-term trends requires a 100-point mentality, and playing with short-term trends only requires technology. The first thing every Monday is to figure out the trend of the week. Buy short-term climb at the weekly close. This week's thinking is bullish first. We estimate that there will be a decline in the second half of the week. Today's weekly line is treated as a low-price buy first, and pay attention to the retracement to the support to buy. The low point of Friday's retracement near 3348 is a new support, and it is also the starting point of the pattern support 3344. In addition, the hourly stepping point is near 3342. If it does not break 3342 today, insist on buying. If it breaks, adjust the thinking to be bearish in time. A small step on the Asian session is also an opportunity to get on the train.
Pressure 3397, support 3348, 3345, 3342, the watershed of strength and weakness in the market is 3342.
Fundamental analysis:
Last week, Trump increased tariffs on Canada and will soon increase tariffs on Brazil. There is no signal of stopping the tariff war. It is long-term bullish for gold. The situation in the Middle East has not completely stopped, and it is also a long-term suppression of the US dollar to support gold.
Operation suggestion:
Gold----Buy near 3348, target 3369-3389

Gold surged higher but encountered resistance and pulled back.Spot gold edged higher, with the highest level reaching $3,374.71 per ounce, the highest since June 23. Over the weekend, Trump announced that a 30% tariff would be imposed on goods imported from the European Union starting from August 1, which further intensified market concerns about international trade and provided upward momentum for gold prices.
Gold prices rose 1% last Friday, closing at $3,357.39 per ounce, as investors turned to safe-haven assets after U.S. President Trump announced a series of tariff measures. Analysts said that the uncertainty premium has returned to the market again.
U.S. President Trump threatened on Saturday (July 12) to impose a 30% tariff on goods imported from Mexico and the European Union starting from August 1. Prior to this, he had engaged in weeks of negotiations with these two largest U.S. trading partners but failed to reach a comprehensive trade agreement. The escalation of the trade war has angered U.S. allies and unsettled investors.
It is worth noting that U.S. President Trump plans to make a "major announcement" on the Russia issue on Monday, which also requires attention from investors.
you are currently struggling with losses,or are unsure which of the numerous trading strategies to follow,You have the option to join our VIP program. I will assist you and provide you with accurate trading signals, enabling you to navigate the financial markets with greater confidence and potentially achieve optimal trading results.
XAUUSDsell gold for a continuous bearish order flow
Looking a a continuous downside to 3000 till September when rate cut is more probable

Patience Before Pump GOLD? | Setup of the Week?Gold (XAU/USD) | Liquidity Grab + Fib Zone
Price swept liquidity and respected ascending channel support.
If bulls hold above 3,330, next target = 3,377.
📊 Is this the reversal we’ve been waiting for?
Are you long or short on gold? Let’s talk below 👇

GOLD - Wave 2 Bullish Towards $3,406 (1H UPDATE)I see a possible buy opportunity towards $3,406 on Gold, as part of its bigger Wave 2 correction, before we can consider selling again.
Confluences👇
⭕️Wave 2 Correction Not Complete (2 Sub-Waves So Far).
⭕️Distribution Schematic Forming.
⭕️Early Sellers ($3,377) & Buyers ($3,310) Liquidated In Past 2 Days.
Now we've seen both buyers & sellers liquidated, we can expect to see a cleaner move back towards $3,400 where there is a lot of pending liquidity.

US CPIs came out. Gold is at an interesting spot.TVC:GOLD is currently struggling with one of its key resistance barriers, at around 3365. We need a clear break above that area in order to aim for higher areas. However, we are not getting bearish yet. Let's dig in!
MARKETSCOM:GOLD
Let us know what you think in the comments below.
Thank you.
75.2% of retail investor accounts lose money when trading CFDs with this provider. You should consider whether you understand how CFDs work and whether you can afford to take the high risk of losing your money. Past performance is not necessarily indicative of future results. The value of investments may fall as well as rise and the investor may not get back the amount initially invested. This content is not intended for nor applicable to residents of the UK. Cryptocurrency CFDs and spread bets are restricted in the UK for all retail clients.

GOLD - SHORT TO $2,800 (UPDATE)I am not inclined towards buy's at this level blindly, because overall my bias remains bearish on Gold. Buyers closed very weak above this 'resistance turned support' zone, so we can possibly see sellers take back control.
For now I'm holding back from any new trades, but will take sell's when market structure offers an opportunity.

XAUUSD Analysis todayHello traders, this is a complete multiple timeframe analysis of this pair. We see could find significant trading opportunities as per analysis upon price action confirmation we may take this trade. Smash the like button if you find value in this analysis and drop a comment if you have any questions or let me know which pair to cover in my next analysis.

XAU/USD H8 AnalysisAfter breaking the bullish trend last month, we saw an impulse of selling and a low price of $3245 per troy ounce.
Since then, a corrective pattern has been forming.
Will we see another impulse of selling after the correction is over?
If you agree with this analysis, look for a trade that meets your strategy rules.

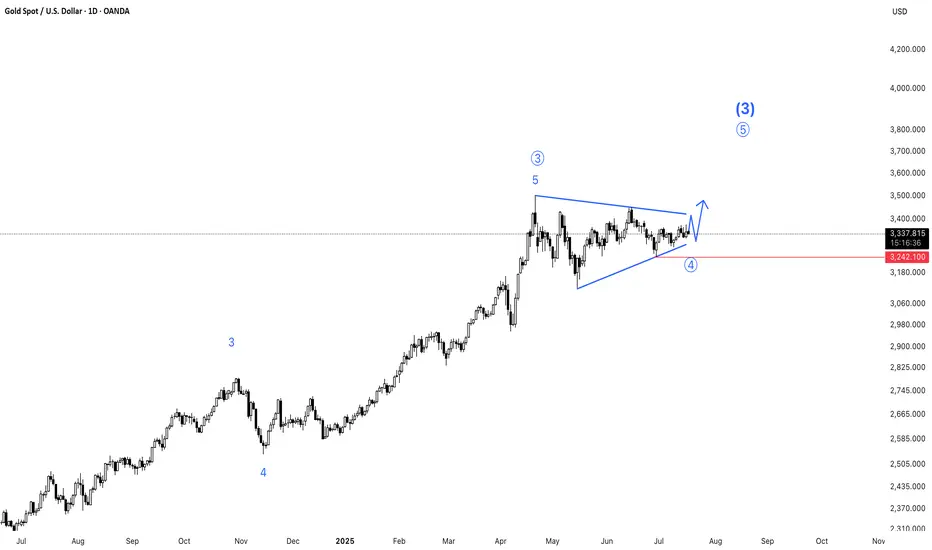
GOLD is Sideways – Wave 4 in Progress (Daily Chart)Gold is currently moving sideways, reflecting a period of consolidation that appears to be Wave 4 in the Elliott Wave structure on the daily timeframe. This phase often represents a pause before the next impulsive move. Traders should stay patient and watch for clear breakout signals, as Wave 5 could bring strong momentum once the correction completes.
GOLD LONG TERMGOLD Live Trading Session/ GOLD analysis #forex #forextraining #forexHello Traders
In This Video GOLD HOURLY Forecast By World of Forex
today GOLD Analysis
This Video includes_ (GOLD market update)
Gold Analysis today | Technical and Order Flow
#usdjpy #usdchftechnicalanalysis #usdjpytoday #gold
What is The Next Opportunity on GOLD Market
how to Enter to the Valid Entry With Assurance Profit?
This Video is For Trader's that Want to Improve Their Technical Analysis Skills and Their Trading By Understanding How To Analyze The Market Using Multiple Timeframes and Understanding The Bigger Picture on the Charts.
Disclaimer: Financial Trading Has Large Potential Rewards, But Also Large Potential Risk. You must be aware of the Risk and Be Welling to Accept Them in order to Trade the Financial Market . Please be Carefully With Your Money.
We are talking about future market, anything can Happen,Markets are Always like that.dnt Risky more Than 2% of your account
Now you can join with our "vip premium" service
Join us and let's make trading together
