XAU/USD Update: Ready for a 12% Surge?Welcome back, traders, it’s Skeptic! 😎 Is XAU/USD about to explode or crash?
We’ve formed a symmetrical triangle pattern , and its breakout triggers could deliver solid profits for longs or shorts. Let’s dive into the details with the Daily timeframe to see the big picture.
✔️ Daily Timeframe: Our HWC is strongly bullish. After hitting $ 3,497.80 , we entered a secondary retracement phase, forming a symmetrical triangle. If we break resistance at $ 3,444.18 , my targets are the next ceiling at $ 3,494.50 and, long-term, $ 3,796.64 . But if we break support at $ 3,796.64 , it could signal a major trend change from uptrend to downtrend, opening shorts. Next supports are $ 3,206.32 and $ 3,019.31 —use these as your targets.
📊 Key Insight : Risk management is key to surviving financial markets. Stick to max 1%–2% risk per trade to stay safe.
📉 Market Context: Markets are predicting a major recession in the U.S. economy. If it happens, Gold will be the only safe-haven asset. So, I personally favor riding Gold’s uptrend.
This historic drop screams one thing: global markets are losing faith in U.S. monetary and fiscal policies, big time.
And that’s a loud wake-up call for investors: It’s time to bulletproof your portfolio. What’s that mean?
Your stocks, real estate, cash, bonds , you name it...
They’re slowly but surely turning to Gold .
💬 Let’s Talk!
Which Gold trigger are you eyeing? Hit the comments, and let’s crush it together! 😊 If this update lit your fire, smash that boost—it fuels my mission! ✌️
CFDGOLD trade ideas

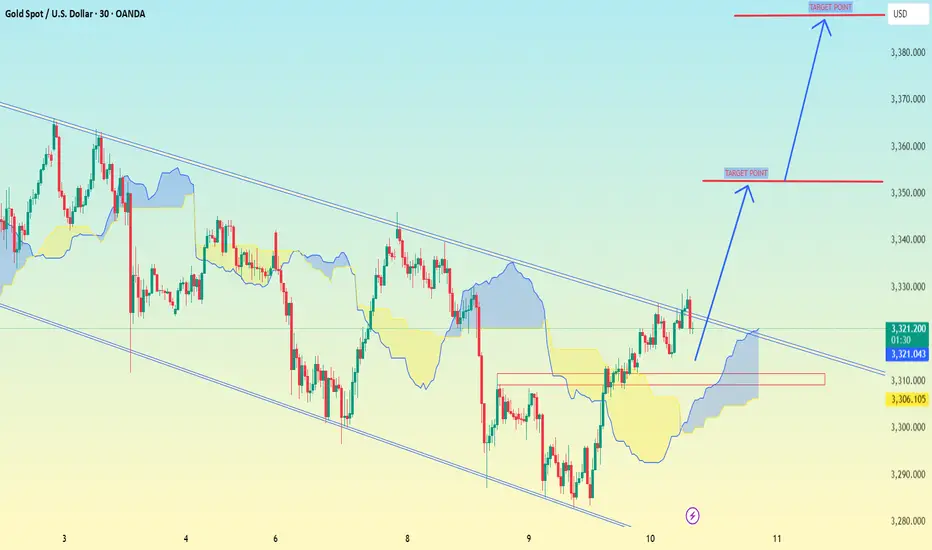
XAUUSD (Gold Spot / U.S. Dollar) on the 30-minute timeframe.XAUUSD (Gold Spot / U.S. Dollar) on the 30-minute timeframe,
📈 Key Observations:
The price has broken out of a descending channel to the upside.
There is Ichimoku Cloud support below the breakout, indicating potential bullish momentum.
Two bullish target levels are marked with arrows and horizontal red lines.
🎯 Target Levels:
1. First Target (TP1): Around 3,350.000
2. Second Target (TP2): Around 3,390.000
These targets are based on the visual structure and the projected breakout move.
🛡 Support Zone (Possible Stop-Loss):
Near the 3,300.000 level — this is the last consolidation area before the breakout, and it's also aligned with the lower Ichimoku Cloud boundary.
---
⚠ Note:
Always manage your risk and consider fundamentals or major news events, especially with commodities like gold.
THE LONG SHOT 〉POTENTIAL OUTLOOKAs illustrated, I'm trying to visualize how a potential continuation impulse could look like during " Bullish July " and toward the end of the year (depending on how aggressive buyers step in; specially central banks and institutions).
As you can see on this Daily chart, price respected a long term trend line + is forming higher lows, funneling into a shorter and shorter range of accumulation.
This is a very strong bullish behavior; when price gets tighter and tighter respecting a resistance level, but making higher lows. It tends to indicate that price is accumulating and "loading" (sort of speak).
Now, analyzing gold from the fundamental aspect, one MUST align those factors with price. In other words: DOES IT MAKE SENSE TO BE BULLISH OR "THINK" PRICE COULD RISE?
Well, ask yourself and do the research on the following (but not limited to) questions:
1. How is the US dollar doing? (Since it is the world's "reserve" currency)
2. Are the interest rates in the USA favoring the economy?
3. How is the world economy as a whole doing?
- inflation in the top world powers and important economies?
4. How is international trade policy looking like for the world?
- Positive or negative? Are countries happy with each other currently, trading without any issues? (Or maybe... there's a tariff war and a trade war goin on?...)
5. Politically speaking, is the general public UNITED or POLARIZED? (politics is a key fundamental aspect for the price of gold, as it either adds to uncertainty and tensions, or it calms things down).
6. Geopolitically speaking (and most importantly); is the "conflict" (war) ending, getting better, resolving? ...
7. Where is the money going and flowing? Black rock, vanguard, and other top hedge funds; where are they investing their money? ( because central banks keep BUYING gold... )
Those are some of many many questions one must study and understand, in order to align the technical aspects of the price of the yellow metal.
If any question/factor DOES NOT POINT to bullishness in price, then the technical and price projection of any analysis starts to have weakness.
On the other hand, if the fundamental factors and questions in play INDEED POINT toward an uncertain situation, adding bullishness to the price, any analysis and bullish projection simply has those aspects to its favor.
--
GOOD LUCK!
persaxu

GOLD has entered a NEW BULL CYCLE this month!GOLD, has been on a consistent ascend since 2k levels hitting a series of ATH taps week after week.
As with any parabolic event -- a trim down is warranted.
After hitting its ATH zone at 3500, gold significantly corrected back to 38.2 fib levels at 3100 area. 38.2 fib levels has been acting as a strong support for GOLD for quite a bit and as expected buyers has started to converge and positioned themselves back again for that upside continuation -- long term.
After hitting this fib key level gold has been making consistent higher lows on the daily conveying clear intentions on its directional narrative -- to go NORTH.
As of this present, July 2025, GOLD has seen renewed elevation in momentum metrics signifying definitive blueprint towards its next upside move.
Based on our diagram above. WE have now entered a new bull cycle that only transpires every 6 months. The last cycles happened on July 2024, January 2025, then presently July 2025 which is in progress. This is very special as we dont get to see this bullish setup on a regular basis.
Ideal seeding zone is at the current range of 3300-3350.
Mid-Long Term Target at 3400

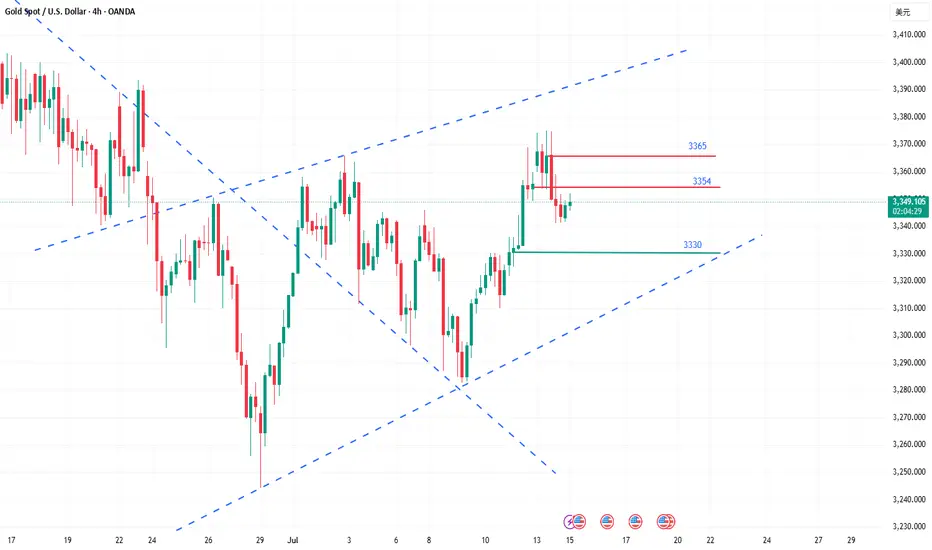
How to grasp the key trading points of gold?Yesterday, gold tested the 3375 line several times but failed to break through effectively. The selling pressure on the market was obvious, and the price immediately fell back, reaching a low of around 3341. The daily line closed with a long upper shadow, indicating that the bullish momentum has weakened and the short-term market has entered an adjustment phase. From the perspective of the 4-hour cycle, the continuous negative trend has led to the gradual closing of the Bollinger Bands, and the middle track position has temporarily gained support, but the overall market is volatile and weak. Today, we will focus on the 3354 watershed. If the rebound fails to effectively stand at this position, the pressure on the upper side will still be strong, and there is a risk of a short-term decline.
Key technical positions: upper resistance: 3365, 3354, lower support: 3340, 3330. In terms of operation rhythm, it is recommended to deal with it with a high-selling and low-buying, oscillating approach, and maintain flexible adjustments.
The operation suggestions are as follows: You can choose to short in the 3360-3365 area, with the target around 3350 and 3340; if the rebound is blocked below 3354, you can also enter the short order in advance. It is recommended to enter and exit quickly in the short-term weak market; strictly control the stop loss to avoid risks caused by sudden changes in the market.
The current market is obviously volatile, so don't blindly chase the rise and fall. It is particularly important to operate around the key pressure and support areas. The grasp of the rhythm will determine the final profit, and steady trading is the kingly way.
Gold bearishness once again in line with expectationsThe data released so far show that the US inflation data is stable and tends to decline, which increases the possibility of the Fed's monetary policy. The US dollar index fell first and then rose. Gold opened at around 3344 and rebounded all the way. The current highest rebound is around 3366. It fell back to 3352 before the data was released, and then quickly rebounded to 3360. After the data was released, it fell again quickly, and the current lowest touched around 3346. The short orders around 3360-3365 that we shared with brothers before were basically the highest short orders of the day, and we successfully completed our first goal. The brothers who participated in it all made good profits. Judging from the current trend of gold, we continue to participate in short orders during the rebound, and the long position is still around 3335-3330. After the release of the CPI data, it is bearish overall. The core is that it is lower than market expectations but higher than the previous value. Inflation has heated up again, which has once again suppressed the expectation of interest rate cuts. After this data, it also laid a good foundation for the decline in the market. If the price goes up again, it will still rely on the 3365 level to go short again. The data is obviously bearish, and it scared a lot of long positions before it was released.
Gold reference ideas:
Continue to short when it rebounds to around 3358-3365, with a target around 3350-3340;
Go long when it falls back to around 3335-3330, with a target around 3350.
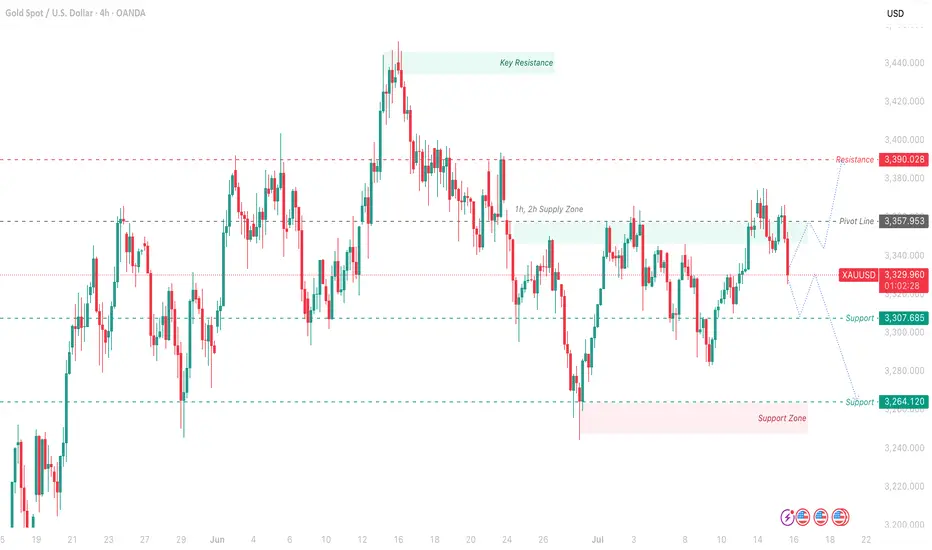
GOLD Outlook – Bearish Confirmed Post-CPIWith the CPI data released at 2.7%, gold’s bearish momentum is confirmed below the Pivot Line of 3,357.953 USD.
The market reaction suggests no immediate Fed rate cuts, supporting downward pressure. Expect a move toward Support at 3,307.665 USD and the Support Zone around 3,264.120 USD. A close above 3,357.953 USD on a 1H or 4H candle could indicate a bullish reversal toward Resistance at 3,390.028 USD.
Trade Setup:
Short Entry: Near 3,357.953 USD with bearish confirmation, Stop Loss above 3,390.028 USD.
Take Profit: Initial target at 3,307.665 USD, with a second target at 3,264.120 USD.
Long Entry: Only if price breaks and holds above 3,357.953 USD, with a Stop Loss below 3,250 USD, targeting 3,390.028 USD.
Pivot Line: 3,357.953 USD
Support: 3,307.685 USD – 3,264.120 USD (Support Zone)
Resistance: 3,390.028 USD – ~3,400 USD (Key Resistance)
1h, 2h Supply Zone: Between 3,357.953 USD and 3,390.028 USD
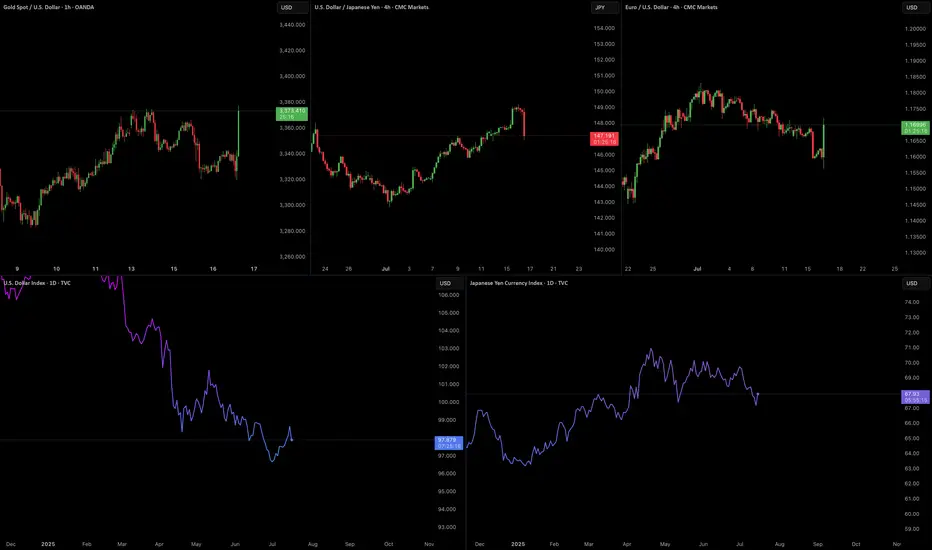
Market Outlook - Trump Questions Powell’s Job - Gold RalliesNordKern active market outlook, reacting to the latest news.
Market Alert | Trump Questions Powell’s Job - Gold Rallies, Dollar Slips
Jul 16 2025 16:56:19 CET: CBS CITING SOURCES:
TRUMP ASKED REPUBLICAN LAWMAKERS IF HE SHOULD FIRE FED'S POWELL
Market Reaction:
OANDA:XAUUSD +$45/oz intraday, currently trading near session highs.
Safe-haven demand and inflation hedge as Fed credibility is questioned.
TVC:DXY Weakens notably against both the TVC:EXY and the TVC:JXY
Markets pricing in higher political risk premium, potential dovish tilt under Trump.
Volatility: Spiking across FX and commodities. VIX and MOVE indexes also showing upward pressure.
Context Matters:
While the Fed Chair cannot be dismissed without cause, even the suggestion of removal injects significant uncertainty into the macro backdrop. Historically, markets react negatively to perceived threats to Fed autonomy (see: Nixon-Burns, Trump-Powell 2018). This development comes just months before the U.S. election, adding a new layer of complexity for macro traders.
What to Watch:
- Fed Speakers: Any defense of Powell or pushback could stabilize markets. Or not.
- Trump Campaign Statements: Will he double down or walk it back?
- Upcoming Data: A dovish-leaning CPI/Jobs print could supercharge gold and further weigh on the dollar.
- Volatility: Traders should adjust position sizing and risk accordingly.
Increased geopolitical and monetary risk are back on the table. Traders should remain nimble, reduce leverage where appropriate, and stay alert to headline risk. Gold and FX are likely to remain reactive into the US session.
NordKern
GOLD again targets $3,371, new bullish cycle conditionToday (Tuesday, July 15), in the Asian market, the spot OANDA:XAUUSD maintained a slight recovery trend, currently at around 3,360 USD/ounce.
The spot OANDA:XAUUSD rose to a 3-week high on Monday, but quickly fell back and finally closed lower. Trump's open attitude towards trade negotiations has improved the market's risk-on sentiment and negatively impacted gold, a safe-haven asset. But gold still has a lot of potential risks for price increases, and personally, the fundamental trend for gold has not changed.
The US Bureau of Labor Statistics will release its June Consumer Price Index (CPI) report today (Tuesday).
According to a Reuters survey, economists expect the US CPI to increase year-on-year in June to 2.7% from 2.4% the previous month, while the core CPI is expected to increase year-on-year to 3% from 2.8%.
The survey also showed that the US CPI is expected to increase 0.3% month-on-month in June, and the core CPI is also expected to increase 0.3% month-on-month.
According to the Chicago Mercantile Exchange's "FedWatch Tool", the market believes that the Fed is unlikely to cut interest rates in July and the probability of keeping interest rates unchanged in September is about 30%.
If the US core CPI rises by 0.4% or more in June, this could prompt market participants to reassess the possibility of a rate cut in September. In this case, the US Dollar could hold steady and push gold prices lower. On the other hand, if the data is lower than expected, gold will become more attractive while a weaker Dollar will be positive for gold prices.
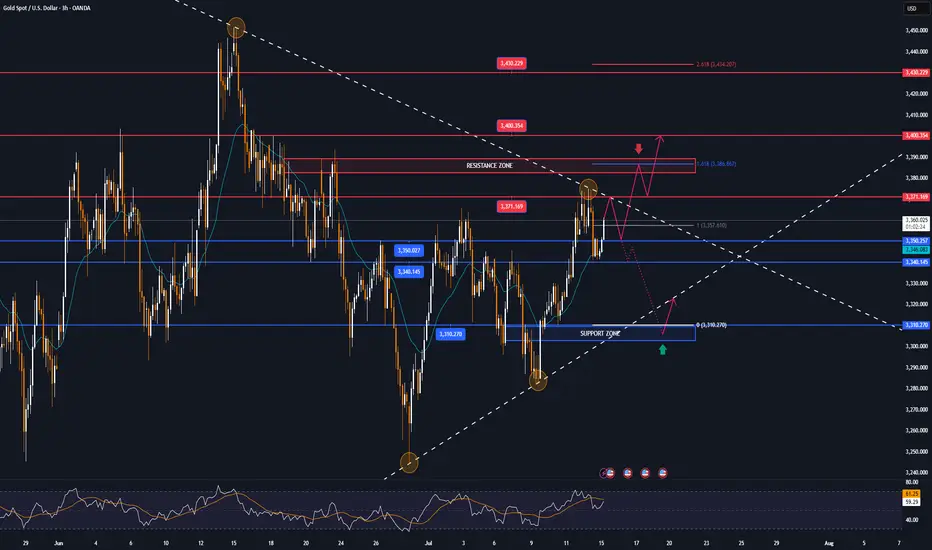
Technical Outlook Analysis OANDA:XAUUSD
After gold reached the resistance target of attention to readers in the weekly publication at 3,371 USD, which is the location of the 0.236% Fibonacci retracement, it fell slightly but is now recovering positively.
Currently, gold is trading in the range of 3,360 USD, the price action above the lower edge of the long-term rising price channel with support from the EMA21, gold is now likely to continue to retest the 0.236% Fibonacci retracement level.
If gold breaks above $3,371 it will be eligible for a new bullish cycle, with the target then being around $3,400 in the short term, more so than $3,430.
On the other hand, the RSI is pointing up, maintaining activity above 50, and this should be considered a positive signal in terms of momentum. It shows that there is still a lot of room for growth ahead.
However, as of now, gold is still neutral in terms of trend, with conditions gradually tilting towards the possibility of price increase.
Along with that, the notable positions will be listed as follows.
Support: $3,350 – $3,340 – $3,310
Resistance: $3,371 – $3,400 – $3,430
SELL XAUUSD PRICE 3390 - 3388⚡️
↠↠ Stop Loss 3394
→Take Profit 1 3382
↨
→Take Profit 2 3376
BUY XAUUSD PRICE 3304 - 3306⚡️
↠↠ Stop Loss 3300
→Take Profit 1 3312
↨
→Take Profit 2 3318
The rebound is not a reversal, continue to shortGold showed a trend of rising and falling back and closing low on Tuesday. The highest intraday rise was 3366, and the lowest fell to 3320. The daily line recorded a medium-sized Yin line with a long upper shadow. The K-line was negative, and the closing line broke the resonance support of the middle track and the short-term moving average, suggesting that the bullish momentum has slowed down and the bears are ready to move. Today, we need to pay attention to the further downward performance of gold. From the 4H level, the price stood firm at the four-hour resistance position last Thursday, and then rebounded upward in the short term. Yesterday, the price fell below the daily support level. Currently, the short-term market is bearish, and attention is paid to the resistance in the 3340-3345 range above. In the one-hour period, the price is in short-term shock adjustment. On the whole, it will be treated as a shock decline before breaking yesterday's low, and the lower side pays attention to the 3225-3320 area support. In the short term, you can consider shorting at 3340-3350 in the European session, and look towards 3330-3320
OANDA:XAUUSD
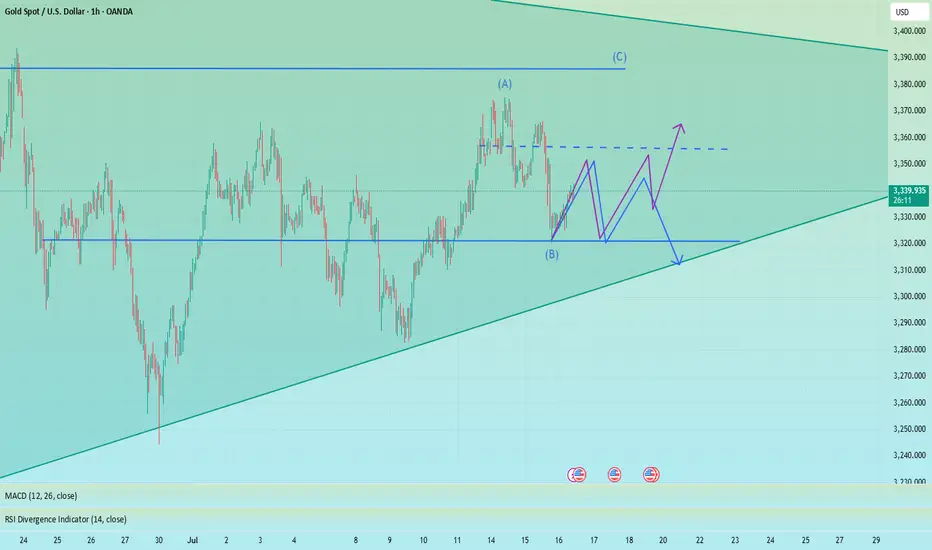
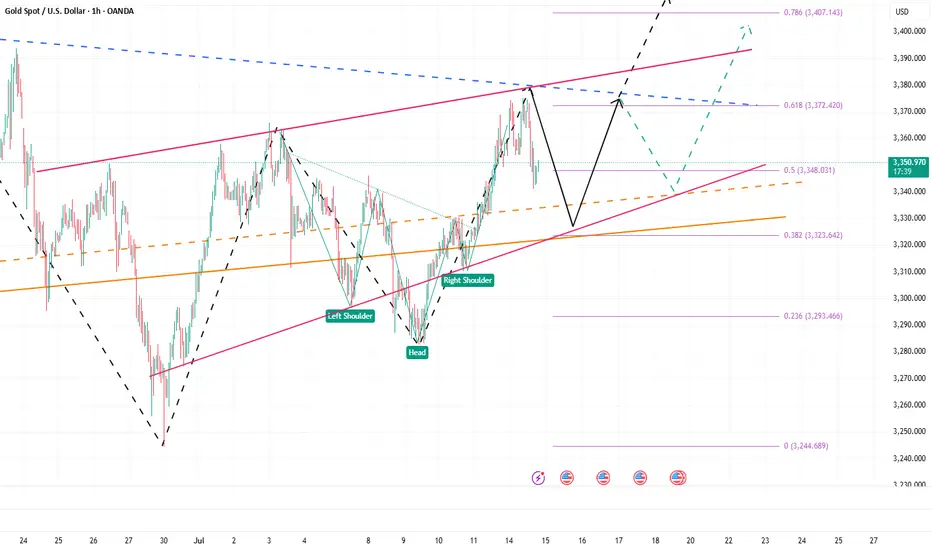
XAUUSD Expecting bullish Movement Price has now entered a strong demand zone between 3310 to 3305, as highlighted on the chart. This area has previously acted as a key support, and current price action indicates potential for a bullish reversal.
Structure Breakdown
Wave A Strong bearish leg
Wave B Minor consolidation
Wave C Final push into demand zone (3310–3305)
Buy Entry Zone: 3310–3305
First Target: 3365
Second Target: 3380
Risk Management is essential. Always use stop loss based on your strategy

XAU/USD Setup THIS WEEK
Expecting a drop into the 3300–3310 zone, where we have:
4H Fair Value Gap
Trendline confluence
Liquidity below New York Low
From there, looking for a potential bullish reaction targeting:
📈 3405 – area with resting liquidity above recent highs.
📍 No confirmed bullish structure yet — waiting for a shift on the 5M/15M timeframe to confirm entry.

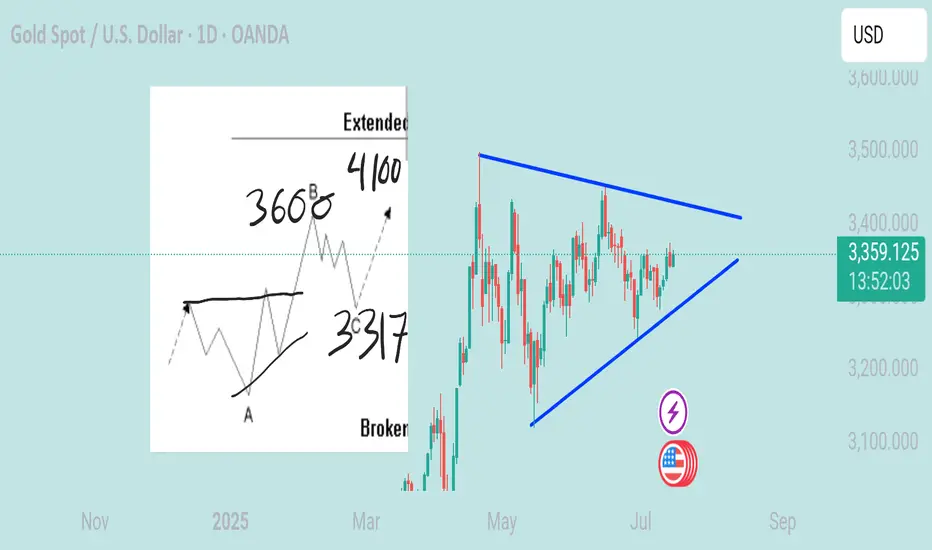
Monitoring a Flat correction extension breakoutIts same with Mar 2020 situation we will see a correction extension not usual correction
Anticipate 3600-3700$ this year with correction to 3317-3392 before rally to 4100$ next year
I also draw Triangle as weekly TF bullish flag
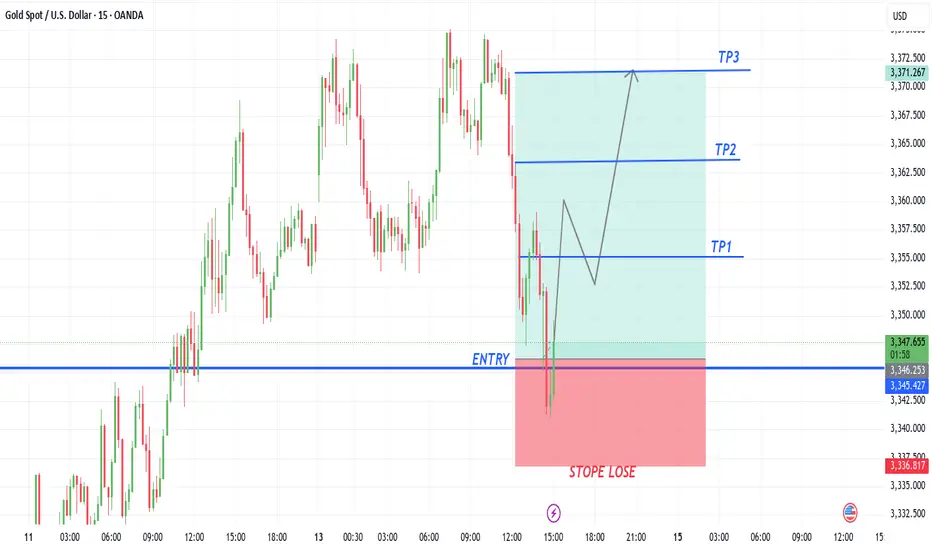
XAUUSD CAN FLY HIGHGold buy from 3346
Tp1 3354
Tp2 3363
Tp3 3373
Stope lose 3337
Trade at your own risk
Gold’s Last Stand? Major Retest at 3310–3300 Under the influence of negative news, gold today fell below the recent low of 3320 and continued to fall to around 3310. The current gold structure looks particularly obvious, the center of gravity of gold gradually moves downward, and the short trend is extremely obvious; however, as gold repeatedly probes the 3320-3310 area, we can clearly see the resistance of gold to falling, and multiple structural supports are concentrated in the 3320-3300 area. So as long as gold does not fall below this area, gold bulls still have the potential to rebound.
However, for now, after experiencing discontinuous sharp rises and falls, gold needs to undergo a short-term technical repair, so it may be difficult for a unilateral trend to appear in the short term. So I have reason to believe that gold will focus on rectification and repair next. The important resistance area we have to pay attention to above is in the 3340-3350 area; and the important support below is in the 3310-3300 area.
Currently, gold is fluctuating in a narrow range around 3340, and the short-term rebound momentum is sufficient, but I still believe that gold will fall back again and test the support of 3320-3300 area after consuming the bullish energy. So for short-term trading, first of all, I advocate shorting gold in the 3340-3350 area, and expect gold to retreat to the 3320-3300 area during the consolidation process.
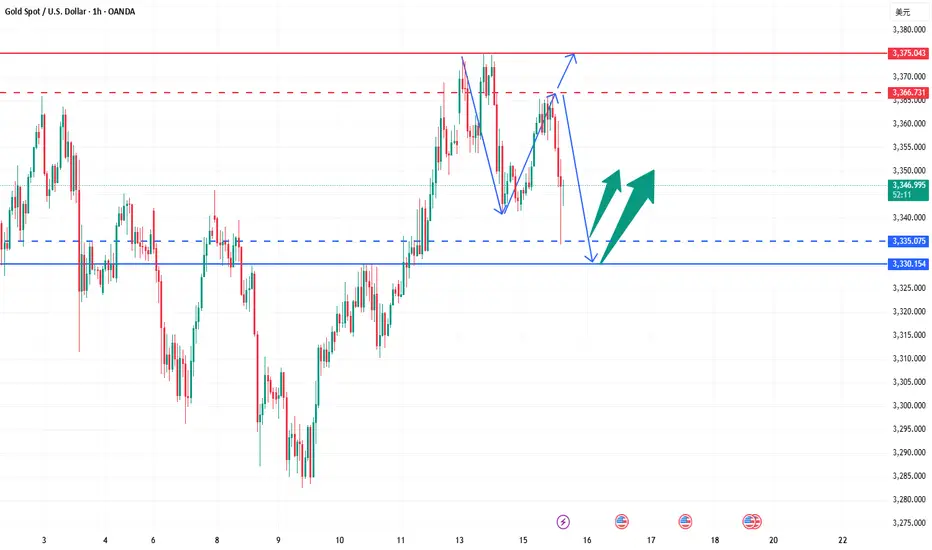
Eyes on 3335–3325: Next Bullish Launchpad!!!Today, gold hit 3375 several times and then fell back after encountering resistance. The lowest has reached 3341. Although the rising structure has not been completely destroyed, and the technical double bottom structure and the inverted head and shoulder structure support resonance effect still exist below, since gold fell below 3350, it has not even been able to stand above 3350 in the current rebound. The gold bull pattern has been weakened to a certain extent, and the market has begun to diverge in the long and short consciousness.
Gold encountered resistance and fell back near 3375 three times, proving that the upper resistance is relatively strong. Gold must increase liquidity by retracement to store more energy for breakthrough, so the short-term correction of gold is actually within my expectations, which is why I advocate brave shorting of gold today! However, according to the current retracement range and the fact that gold has been unable to stabilize above 3350, I believe that gold has not fallen to the right level and there is still room for retracement below. So I think gold will continue to pull back to test the 3335-3325 area. If gold retests this area and does not fall below, we can boldly go long on gold in this area.
Once gold rebounds after testing the 3335-3325 area, as liquidity increases, the market may form a strong bullish force to support gold to continue its rebound and continue to the 3380-3390 area, or even the 3400-3410 area.
THE KOG REPORT - UpdateEnd of day update from us here at KOG:
Today was another choppy day on gold with price accumulating in a small range before the break out. We had the bullish above and bearish below level so no choice but to wait for the break. Ultimately, 3320 broke on the 15min indi and then we managed to complete all of our bearish targets for the day. Well worth the wait!
Now we have support below at the 3285 level with resistance sitting at 3310 which is the level that will need to hold us down to target lower. Lower first, which would be ideal, we may get a RIP over the session to come.
RED BOX TARGETS:
Break above 3350 for 3355, 3360, 3362, 3365, 3374, 3388 and 3396 in extension of the move
Break below 3335 for 3331✅, 3324✅, 3321✅, 3310✅, 3306✅ and 3293✅ in extension of the move
Todays levels from Camelot:
Price: 3324
RED BOXES:
Break above 3336 for 3340, 3346, 3350 and 3360 in extension of the move
Break below 3320 for 3310✅, 3306✅, 3304✅ and 3297✅ in extension of the move
As always, trade safe.
KOG

End of week analysis (19/07/2025)Here I explain the weekly and market structure for the week. Thanks for watching.

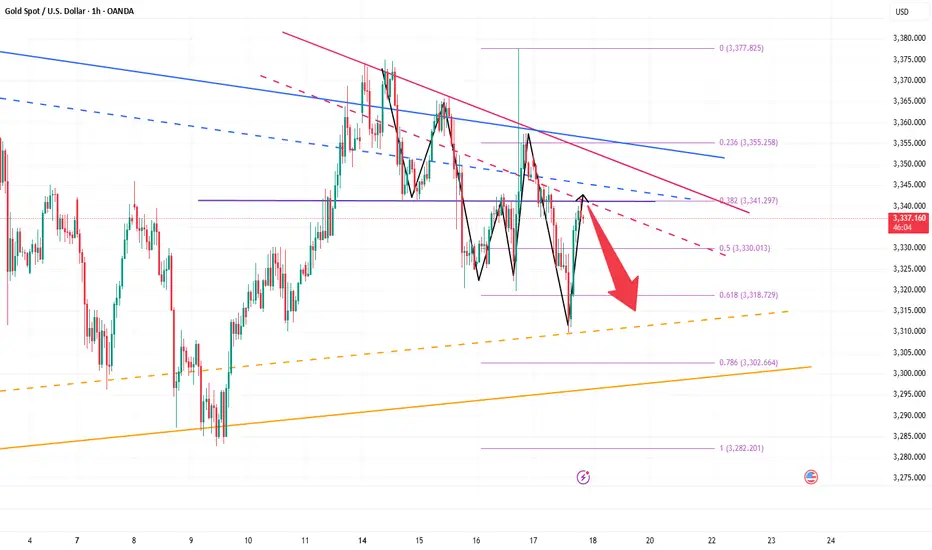
GOLD - Its Breakout? Short now??#GOLD.. perfect move as per our analysis, and now market just break hit current supporting area that was actually 3328
so keep close it and if market stay below that then we can expect a further drop towards our next supporting areas.
good luck
trade wisely
GOLD BUYGold defends 50-day SMA ahead of US PPI inflation data
Gold price attempts a tepid bounce early Wednesday as focus shifts to trade updates and US PPI data. The US Dollar retreats alongside Treasury bond yields even as risk-off flows persist. Gold price needs to crack the 50-day SMA support at $3,323; daily RSI reclaims midline.
As observed on the daily chart, Gold price is stuck between two key barriers, with the 21-day Simple Moving Average (SMA) support-turned-resistance at $3,335 checking the upside.
On the other hand, the 50-day SMA at $3,323 cushions the downside.
The 14-day Relative Strength Index (RSI) is sitting just above the midline, currently near 50.50, suggesting that buyers could retain control.
Acceptance above the 21-day SMA is critical to sustaining the renewed upside, above which the 23.6% Fibonacci Retracement (Fibo) level of the April record rally at $3377 will be put to the test once again.
Further north, the $3,400 round level will challenge bearish commitments.
In contrast, rejection at the 21-day SMA could attack the 50-day SMA support.
Sellers must find a strong foothold below the 50-day SMA on daily closing basis.
The next healthy support levels are located at the 38.2% Fibo level of the same rally at $3,297 and the July low of $3,283.
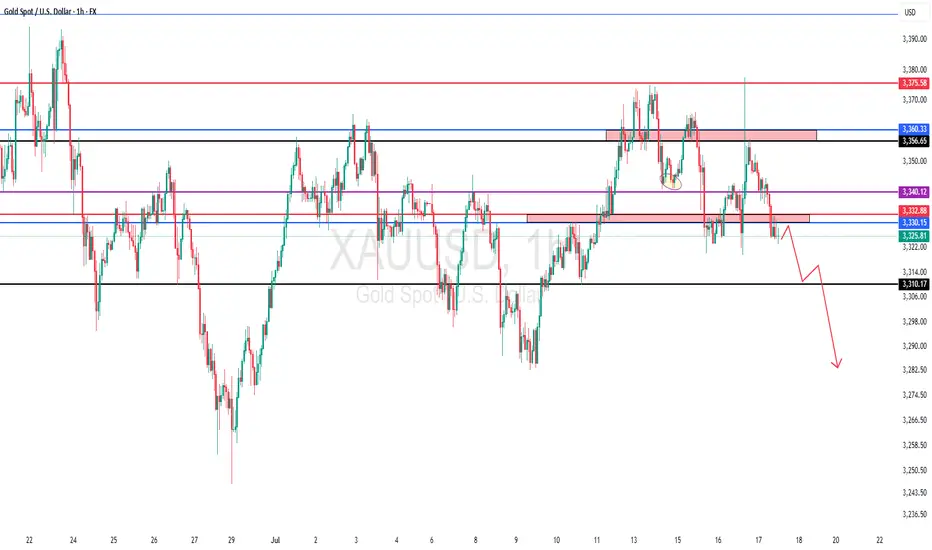
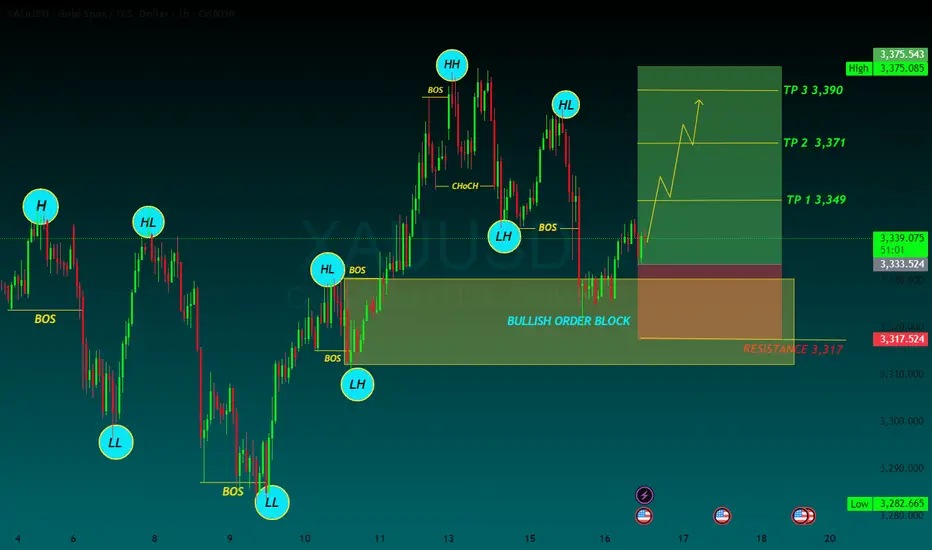
TP 1 3,349
TP 2 3,371
TP 3 3,390
RESISTANCE 3,317
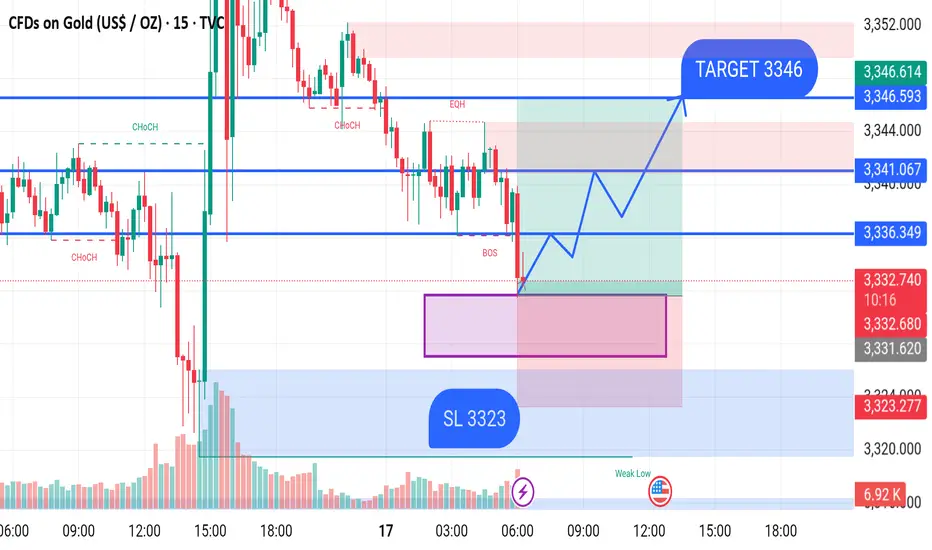
GOLD BUY M15 Gold (XAU/USD) 15-Minute Chart Analysis – July 17, 2025
Price is currently trading around the 3,333.71 level after a Break of Structure (BOS) to the downside. The market has entered a demand zone (highlighted in pink), suggesting potential bullish momentum if the zone holds.
A possible bullish scenario is illustrated on the chart:
Price is expected to retest the demand zone between 3,331 – 3,324.
From this zone, a bullish reversal is anticipated with higher highs and higher lows.
If the bullish move plays out, the first resistance level lies around 3,336 – 3,341.
The final target is set at 3,346, marked as the Take Profit (TP) level.
Key Levels:
Entry Zone (Demand Zone): 3,331 – 3,324
Stop Loss (SL): 3,323
Target (TP): 3,346
Intermediate Resistance Levels: 3,336 and 3,341
GOLD Local Rebound Ahead! Buy!
Hello,Traders!
GOLD made a retest of
The horizontal support
Level of 3343$ and as
We are locally bullish
Biases we will be expecting
A local bullish rebound
Buy!
Comment and subscribe to help us grow!
Check out other forecasts below too!
Disclosure: I am part of Trade Nation's Influencer program and receive a monthly fee for using their TradingView charts in my analysis.

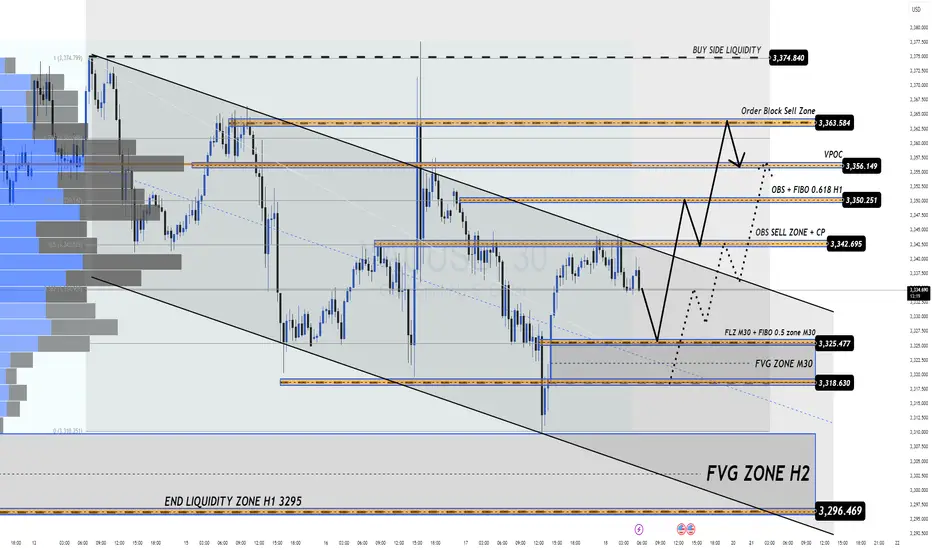
18/07 Gold Outlook Market Tensions Mount Liquidity Zones in Play Gold Outlook – Market Tensions Mount, Liquidity Zones in Play
Price action heats up as we enter the final trading day of the week. Are you ready to ride the wave or get caught in the liquidity sweep?
🔍 Market Sentiment & Global Highlights
Gold rebounded strongly after dropping on better-than-expected US data. However, several macro risks are keeping gold buyers in the game:
Buy-the-dip activity emerged amid concerns that Trump’s tariff policies may fuel inflation.
Rate cut expectations remain strong as US core inflation shows no signs of cooling.
Geopolitical risks intensified as Israel conducted fresh airstrikes on Syria.
EU threatens $84B in tariffs on US goods should trade talks break down.
💡 These tensions are giving gold strong support — especially as traders prepare for potential volatility into the weekend.
📈 Technical Overview – Liquidity Zones at Play
Yesterday's bounce from FLZ H2 (3310) — a critical demand and liquidity zone — triggered a clean reversal. Sellers took profit, volume shifted, and buyers regained control. Price has since pushed up to retest the OBS SELL ZONE + CP Pattern near the 334x area with a sharp reaction.
For today, price is likely to revisit lower liquidity pockets (M30–H2) before making the next directional move.
🔑 Key Levels to Watch
🟢 BUY ZONE: 3318 – 3316
Stop Loss: 3312
Take Profits: 3322 – 3326 – 3330 – 3335 – 3340 – 3345 – 3350 – 3360+
⚡ BUY SCALP ZONE: 3326 – 3324
Stop Loss: 3320
Take Profits: 3330 – 3335 – 3340 – 3345 – 3350 – 3360
🔴 SELL ZONE: 3363 – 3365
Stop Loss: 3370
Take Profits: 3360 – 3355 – 3350 – 3346 – 3342 – 3338 – 3335 – 3330
⚠️ Final Notes
Today’s session has no major news releases, but as it’s the end of the week, we may see liquidity grabs and unexpected volatility. Stay disciplined, stick to your plan, and always respect TP/SL.
🔔 Follow the key zones carefully – volatility loves indecision.