Gold Bullish Momentum
📈 XAU/USD Gold Technical Analysis – Smart Money Concept Perspective
🕒 Timeframe: 1H | Date: July 16, 2025
Overview:
This analysis follows a Smart Money Concept (SMC) framework, focusing on market structure shifts, liquidity zones, and potential high-probability setups. Gold (XAU/USD) is showing signs of a possible bullish reversal after forming a clear accumulation zone near a significant low.
Key Highlights:
🔹 BOS (Break of Structure):
A bullish break of structure confirms a shift in momentum, indicating that the prior bearish trend might be weakening.
🔹 LL (Lower Low) and LH (Lower High):
The market previously formed a Lower Low, followed by a Lower High, maintaining bearish structure until the recent BOS occurred.
🔹 Accumulation Phase:
Price is consolidating in a defined accumulation range, suggesting smart money might be absorbing liquidity before a move higher. This zone may serve as the springboard for the next bullish leg.
🔹 Inducement:
An inducement zone lies just below the trendline support and accumulation range. It’s designed to trap early sellers before a bullish continuation.
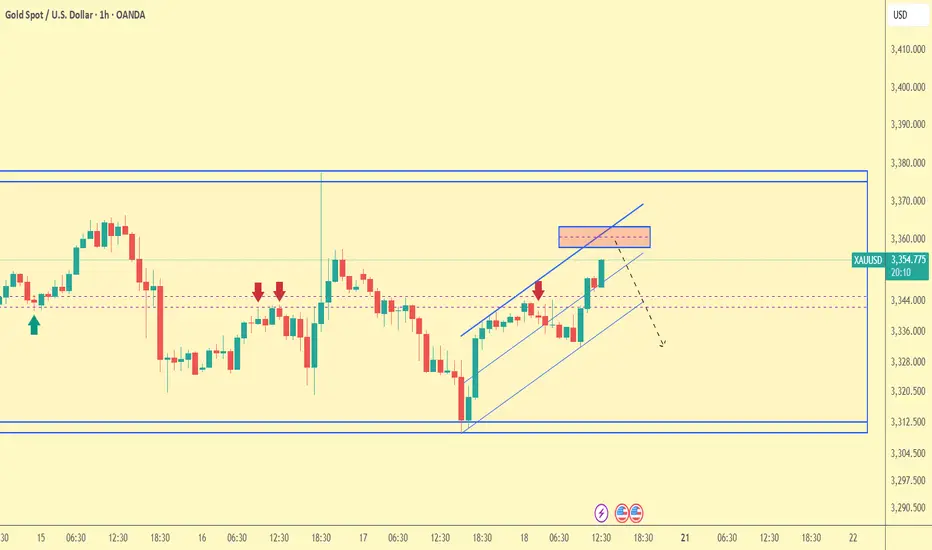
🔹 POI (Point of Interest):
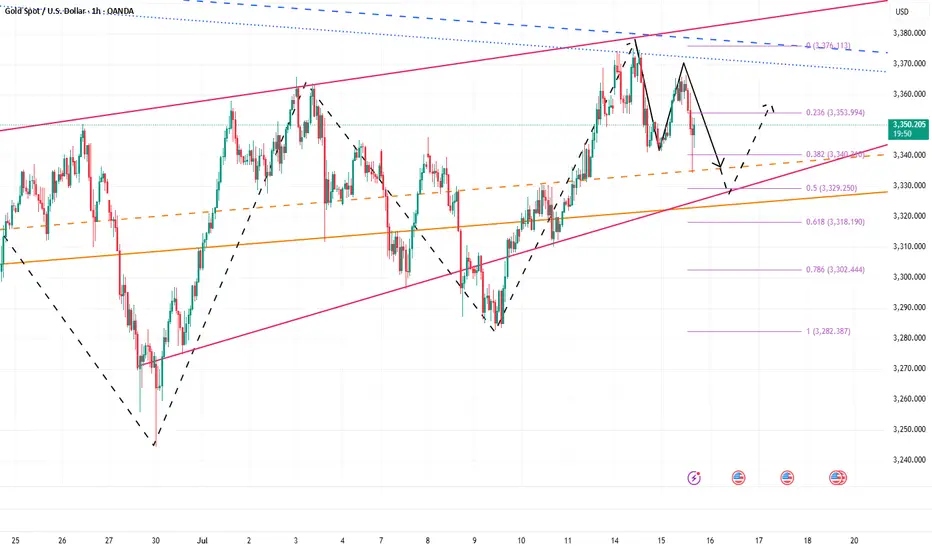
A key supply or mitigation zone lies around the $3,355.75 level. We expect price to move into this POI before reacting.
🔹 Target:
If price successfully clears the POI and confirms strength, the projected target is in the $3,375–$3,380 zone based on confluence from upper channel resistance and previous structure.
🔄 Forecast Path:
Short-Term Pullback: Price may dip slightly to mitigate the inducement zone near trendline support.
Bullish Breakout: Strong impulse toward POI.
Reaction from POI: Potential minor retracement before a continuation toward the target.
🧠 Market Psychology Insight:
This setup reflects smart money accumulation and manipulation at its core — inducing retail traders into short positions before a potential bullish move. Watch for confirmations like bullish engulfing candles or break of lower highs on smaller timeframes.
📌 Conclusion:
Gold is poised for a possible bullish move after showing accumulation and breaking bearish structure. The $3,328–$3,335 range is key for entries, with the $3,355 POI and $3,375+ as targets. Manage risk and wait for confirmation before entering trades.
💬 Let me know your thoughts or drop your own chart ideas below!
📊 #XAUUSD #Gold #SmartMoney #TradingView #Forex #TechnicalAnalysis #SMC #PriceAction
CFDGOLD trade ideas

check the trendIt is expected that a trend change will form within the current support area and we will witness the beginning of the upward trend.
If the price breaks through the support zone, the continuation of the correction is likely.
If the price breaks through the support levels, the continuation of the downtrend is likely.

Gold is in the Bearish Direction after Breaking Triangle PatternHello Traders
In This Chart GOLD HOURLY Forex Forecast By FOREX PLANET
today Gold analysis 👆
🟢This Chart includes_ (GOLD market update)
🟢What is The Next Opportunity on GOLD Market
🟢how to Enter to the Valid Entry With Assurance Profit
This CHART is For Trader's that Want to Improve Their Technical Analysis Skills and Their Trading By Understanding How To Analyze The Market Using Multiple Timeframes and Understanding The Bigger Picture on the Charts
Converging triangle, may rise again in the short termUnder the influence of recent tariffs and the Federal Reserve's interest rate cuts, the main trend of the gold market remains bullish, but from the weekly and monthly level analysis, there is a high probability that it will pull back again after this round of highs and maintain a large range of fluctuations at a high level. Technical analysis shows that gold currently does not have the conditions for a unilateral surge at the daily level. Although the key level of 3345 has been broken, the continuity of the market is extremely poor, and volatility is still the main theme. At present, the trend of gold has formed a converging triangle pattern, and it may rise again in the short term. However, we need to be vigilant that the weekly line may form a high-rise and fall pattern, and the price of gold may fall back to 3300! Therefore, in today's late trading, you can consider retreating to the 3335-3330 area to go long
OANDA:XAUUSD
The latest gold trend analysis and strategic suggestionsYesterday, the price of gold showed a range of fluctuations. The long and short sides fought fiercely but failed to break through the existing range. The overall trend direction is still unclear. From a fundamental point of view, the market is still dominated by risk aversion, which makes it difficult for the price of gold to form a clear trend reversal. However, it should be noted that the main funds may take extreme suppression measures in the future to force the price of gold to fall. From the 4-hour chart, gold has been under pressure near the upper track 3377 and continued to fall. Yesterday, it broke through the middle track support and touched the lower track. The current price is temporarily supported near the lower track, but the overall trend still shows a wide range of fluctuations and has not formed an obvious trend. The short-term strength of the US dollar suppresses the upward movement of gold, but the key support and resistance levels have not been effectively broken; in terms of intraday short-term operation suggestions, the current callback near 3320-3325 can try to do ultra-short-term longs. It is recommended to stop profit and exit in the 3340-3345 range. It can be combined with the K-line pattern to short-sell, and the target is the lower track area. If the downward momentum is strong, it may fall below yesterday’s low to form a continuous decline.
Operation suggestions:
1. Go long when gold falls back to around 3320-3325, stop loss at 3312, target at 3340-3345.

7/17: Key Support for Gold Bulls at 3343–3337During the Asian session today, gold rose as expected into the 3337–3343 resistance zone. After failing to break through, the price retraced during the European and U.S. sessions, reaching the 3323–3313 support area. A sharp rally followed due to unexpected news, pushing the price into the 3372–3378 resistance zone. Overall, the intraday bullish strategy performed well, yielding solid profits.
After this sharp volatility, price movement has stabilized somewhat. The MA60 support on the daily chart remains intact.
For tomorrow’s trading, key levels to watch are:
🔽 Support: 3343–3337, with secondary support at 3328–3323
🔼 Resistance: 3372–3378
On the 2-hour chart, bullish momentum appears likely to continue as long as price holds above the support zone.
Additionally, upcoming economic data releases and any further developments on the report regarding Trump potentially firing Powell could have a significant impact on market sentiment—these factors should be closely monitored.
In summary, tomorrow’s initial trading focus can remain within the 3337–3358 range, with strategies adjusted as market conditions evolve.
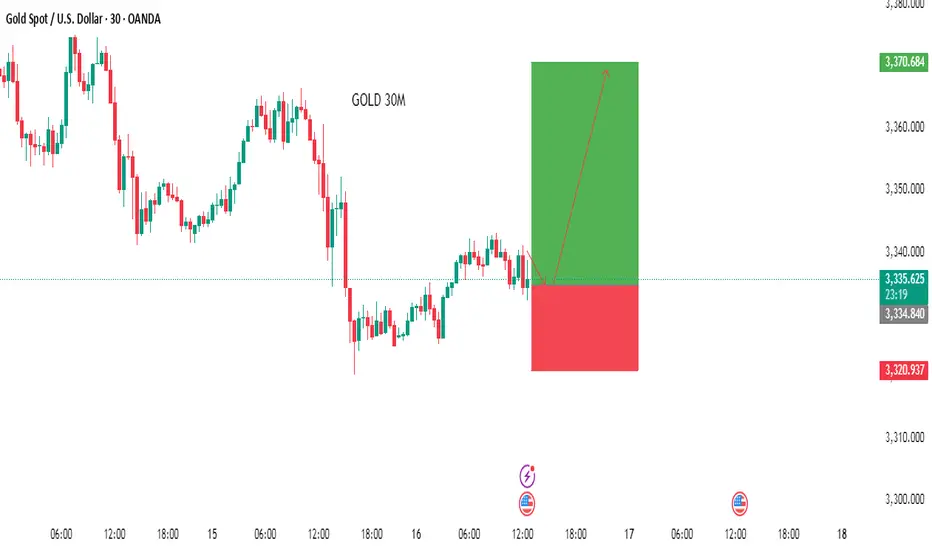
Be in Lon Position for GOLDDears
After breakout red zone we can fill buy order with small stop lose for big target.

Don’t hesitate, a massive gold move Is brewingRefer to my previous trading idea. Gold retreated as expected. We almost caught the highest point of the day and shorted gold near 3365, and successfully hit TP: 3346, which enabled us to successfully profit 190pips in short-term trading, with a profit of nearly $10K, which is a good result in short-term trading.
Currently, the lowest point of gold in the retracement process has reached around 3335, which has fully released the short energy and vented the bearish sentiment in the market. All the bad news is out, which means good news! Although gold fell from 3375 to 3335, the retracement was as high as $40, but the rising structure has not been completely destroyed. The previous W-shaped double bottom support structure and the resonance effect of the inverted head and shoulder support structure still exist. As long as gold stays above 3325, gold bulls still have the potential to attack.
Moreover, after this round of retracement, the bearish sentiment of gold was vented, and the liquidity was greatly increased, attracting more buyers to actively enter the market. Gold may start a retaliatory rebound, and even touch 3375 again or even break through and continue to the 3380-3390 area.
So for short-term trading, I think we can try to go long on gold in the 3335-3325 area appropriately, first looking forward to gold regaining lost ground: 3350-3360 area, followed by 3380-3390 area.
XAUUSD 4H – Break & Retest With Bullish Continuation | SMC🚨 Gold (XAUUSD) is setting up for a potential bullish move after a successful break and retest of a key resistance zone at 3346 – 3348, now turned into fresh support.
🔍 Technical Breakdown:
📌 Structure:
Gold previously formed a strong resistance near 3346, which aligned with multiple rejections in past sessions. After a liquidity sweep and break above this level, price retraced for a textbook break-and-retest setup.
📌 CHoCH & BOS (Break of Structure):
The market showed a bullish Change of Character followed by a clean Break of Structure to the upside, confirming bullish intent.
📌 Smart Money Perspective:
Institutional demand was respected at 3296–3305 zone.
Liquidity below this zone has been taken.
Current bullish candles are printing higher highs and higher lows.
📌 Confluences:
✅ Break & Retest of major structure
✅ Clean demand zone below
✅ Imbalance filled
✅ Bullish market structure
✅ SMC confirmation (CHoCH + BOS + Mitigation)
📈 Trade Idea (Long Setup):
💰 Buy Entry: 3359
🔻 Stop Loss: 3305 (below demand + structure)
🎯 Take Profit 1: 3400
🎯 Take Profit 2: 3440 – 3442 (major resistance)
🧮 Risk-to-Reward: 1:2+
This setup provides a strong bullish continuation opportunity targeting the upper resistance zone. Monitor candle confirmations and session volume for more precise entries.
📢 💬 Like this idea? Follow for more Smart Money trades on Gold, US30, NAS100, and V75!

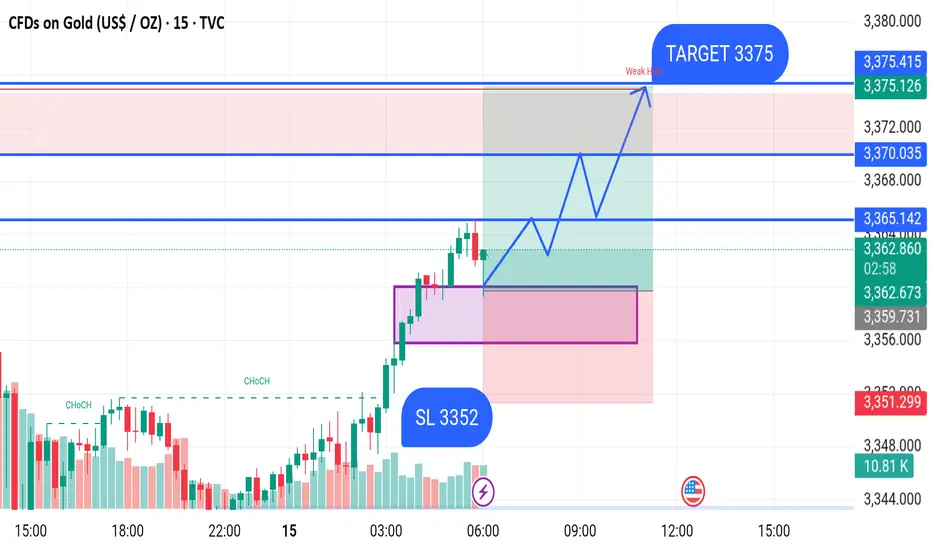
GOLD BUY M15 XAU/USD (Gold) 15-Minute Chart Analysis – July 15, 2025
Gold is currently trading around 3362.050, showing strong bullish momentum after a Change of Character (CHoCH) confirmation. Price has broken previous structure highs and is now expected to continue the upward trend.
A bullish order block (marked in purple) has been identified as a demand zone, which could act as a strong support if the price pulls back.
Entry Plan:
Buy on a retest near the demand zone.
Stop Loss (SL): 3352
Target (TP): 3375
Key Levels:
Support Zone (Demand Area): 3352–3360
Resistance Levels:
Minor resistance: 3365.142, 3370.035
Final target zone: 3375 (Weak High)
Price is expected to form higher highs and higher lows on its way toward the target. Watch for a clean retest of the demand zone for a potential long entry.
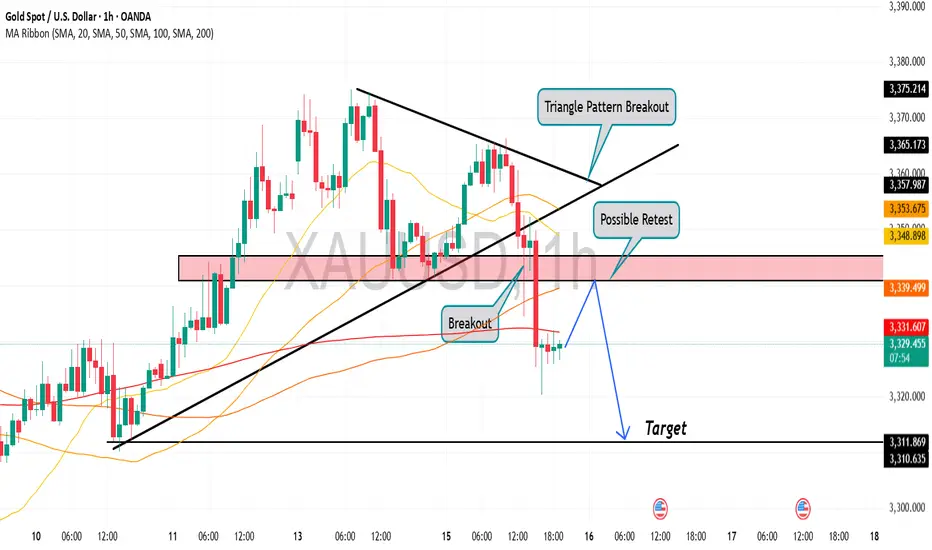
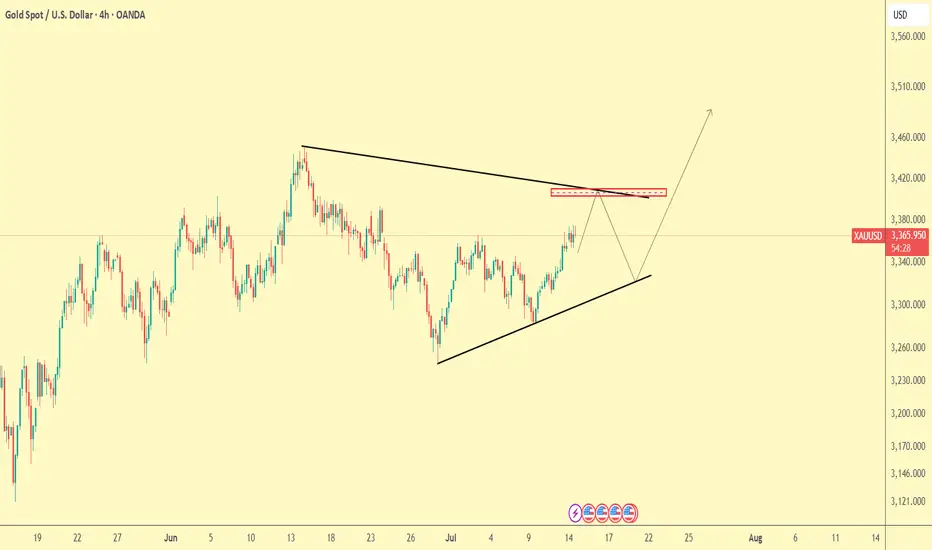
Gold Trade Plan 14/07/2025Dear Traders,
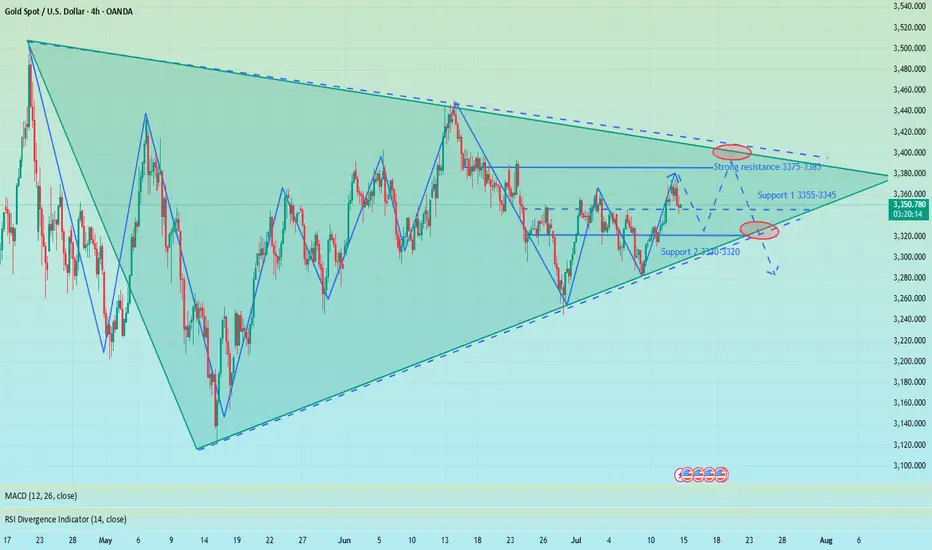
On the 4H chart, gold (XAUUSD) is forming a symmetrical triangle, with price approaching a key resistance zone (highlighted in red) around 3375 - 3385, which aligns with the descending trendline.
📍 Two possible scenarios:
Pullback scenario (more likely short-term):
Price gets rejected from the red box and pulls back to the ascending trendline below (~3300-3320).
Bullish breakout scenario:
If price breaks and holds above the red resistance and descending trendline, the next bullish target could be 3450 - 3470.
For now, the best strategy: Wait for price reaction at resistance before entering a trade.
Regards,
Alireza!
the market still uprend my analyse gold target 3390the market still uprend my analyse gold target 3390, good buy zone at 3345 - 3350

GOLD → Readiness to test the local bottomFX:XAUUSD is under pressure from the rising dollar and uncertainty, breaking through support levels, which opens up a corridor for the market to fall to 3255 - 3246
The price of gold is consolidating around $3300 after falling more than 1% amid expectations of the Fed minutes and news about tariffs.
Investors remain cautious: the dollar is supported by hopes for US trade deals, while the threat of new tariffs from August 1 is holding back gold's growth.
Weak inflation data in China did not support the metal, while expectations that the Fed will not rush to cut rates due to inflationary pressure from tariffs are also limiting interest in gold. Traders are waiting for the Fed minutes and new statements from Trump to determine the further direction.
Technically, the market looks weak (on D1, the price closed below the key level of 3300 on Tuesday) and there is a chance of a further decline.
Resistance levels: 3300, 3311
Support levels: 3295, 3255, 3246
Consolidation below 3295-3300 could trigger a further decline to 3255, from which the market could react with a correction.
Buying can be considered if gold reverses the short scenario, manages to strengthen to 3311, and consolidates above this level. At the moment, the price is in the selling zone...
Best regards, R. Linda!

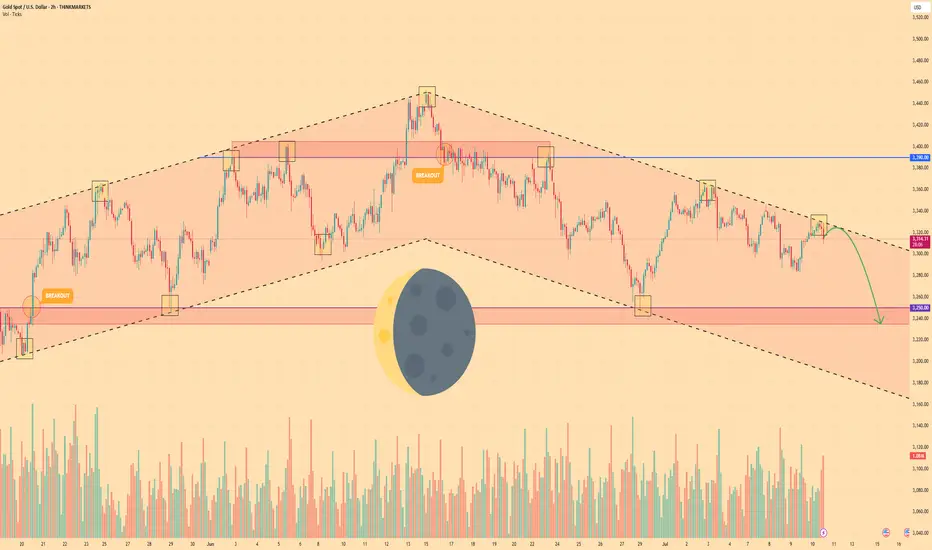
GOLD - Price can bounce down from resistance line of channelHi guys, this is my overview for XAUUSD, feel free to check it and write your feedback in comments👊
Gold broke out of its long-term rising channel and hit $3390 resistance level before momentum definitively stalled.
That failure marked a shift in control, as sellers forced price into a falling channel, establishing lower highs and lower lows.
Price fell to support level, after whcih it turned around and bounced up to resistance line of falling channel.
Now, Gold tests the upper boundary of the falling channel near $3318, where each bounce has been capped by declining volume.
Key support lies in the $3250 - $3235 area, aligned with multiple prior demand tests and the former rising-channel floor.
I expect Gold to reverse from the channel resistance and slide toward $3235, decisively breaking below the $3250 level.
If this post is useful to you, you can support me with like/boost and advice in comments❤️
Disclaimer: As part of ThinkMarkets’ Influencer Program, I am sponsored to share and publish their charts in my analysis.
Gold Trade Plan 18/07/2025Dear Traders,
Gold (XAUUSD) – Short-Term Outlook – July 18, 2025
Price is currently moving within an ascending channel and approaching a key resistance zone around 3355–3360, highlighted in red. This zone has acted as previous supply (marked with red arrows), and we anticipate potential bearish reaction from here.
As long as price fails to break and hold above 3375, we remain bearish near the top of the range, with short opportunities targeting the mid-range (~3340) and possibly the bottom of the channel (~3315–3320).
If price breaks above 3375 with strong momentum and closes above it, the bullish breakout scenario becomes active, invalidating the short setup.
📌 Strategy:
Watch for bearish confirmation in the resistance zone
Sell near the top, targeting lower range levels
Invalidation: Break and close above 3375
Regards,
Alireza!
Today's GOLD Analysis (MMC) – Bullish Momentum Building Ahead🔍 Market Overview:
Gold is currently showing signs of a bullish reversal structure after experiencing a downward correction. Price action has reacted strongly from well-defined demand zones, suggesting institutional buying activity at key levels. The current setup highlights a clear accumulation phase transitioning into a potential markup phase, driven by buyers regaining control.
🧱 Chart Structure Breakdown:
1️⃣ Initial Channel Formation (Left Side of Chart)
After a major downtrend, price began consolidating within a rising channel, indicating a retracement or correction phase.
This ascending channel showed a short-term bullish effort, but eventually broke to the downside, resuming the dominant bearish flow temporarily.
2️⃣ Previous Reversal Zone ($3,312 – $3,322)
This is the origin of the recent bullish move, where price strongly reversed after heavy selling.
The reversal formed a long bullish wick and an engulfing candle—clear signs of buying absorption.
This level has historical confluence, acting as both support and prior demand.
3️⃣ Mini SR - Interchange Zone ($3,327 – $3,335)
This zone is a mini structure level where previous resistance has now become support (SR Flip).
The area acted as a platform for the recent bullish reaction.
This zone also aligns with the interchange of order blocks, adding more confluence to the bullish argument.
4️⃣ Bullish Pattern Formation
Price formed a micro double bottom/inverse head and shoulders structure just above the Mini SR.
The pattern suggests strong base-building and provides momentum for the current bullish move.
Confirmation came after the neckline breakout and retest within the Central Zone.
5️⃣ Central Zone ($3,340 – $3,345)
This is an intraday pivot area, acting as a decision-making zone between buyers and sellers.
Price is currently testing this zone with strong bullish candles.
A clean break above this level increases the probability of further upside.
6️⃣ Reversal Zone 1 ($3,345 – $3,353) – ✅ Condition 1
Price is now entering this zone, where previous price rejections occurred.
If buyers can maintain momentum and break above this zone on strong volume, it will validate the bullish continuation thesis.
This zone is also an ideal area to monitor for partial profit-taking or potential short-term rejection.
7️⃣ Reversal Zone 2 ($3,365 – $3,375) – ✅ Condition 2
This is the next significant resistance block.
If price reaches this level, it could face heavy resistance and profit-booking from swing traders.
However, a breakout above this zone could lead to a much larger bullish wave, targeting $3,390+.
🎯 Trade Setup Idea:
Long Bias: Above $3,335 with targets at $3,353 (TP1) and $3,370 (TP2)
Risk Invalidation: Break below Mini SR zone ($3,327) may invalidate bullish thesis
Aggressive Entry: At retest of Mini SR after pattern breakout
Conservative Entry: On breakout and close above Reversal Zone 1 with confirmation
🧠 Trader’s Mindset:
The market is showing a clear shift in momentum, but buyers must sustain control above key levels.
Stay patient at resistance zones; avoid chasing.
Watch for rejection wicks or bearish divergence near Reversal Zone 2 if you're looking for a counter-trade.
📌 Summary:
📈 Bias: Bullish (as long as $3,335 holds)
💡 Opportunity: Breakout from Mini SR with structure support
📉 Risk: Failure to hold central zone could trigger retest of lower support
🚀 Potential: If momentum continues, gold could revisit July highs near $3,390–$3,400

Leqidity huntHTF OB in a 1H OB , 3 circles of rejection and IMB/FVG below that boost the direction,
OB is the game,. FVG is confirmation and Liquidity is Love, so sell on any FVG down becauE that is rhe confirmation we need

GOLD LONG FROM RISING SUPPORT|
✅GOLD is trading in an uptrend
And the bullish bias is confirmed
By the rebound we are seeing
After the price retested the support
So I think the growth will continue
LONG🚀
✅Like and subscribe to never miss a new idea!✅
Disclosure: I am part of Trade Nation's Influencer program and receive a monthly fee for using their TradingView charts in my analysis.

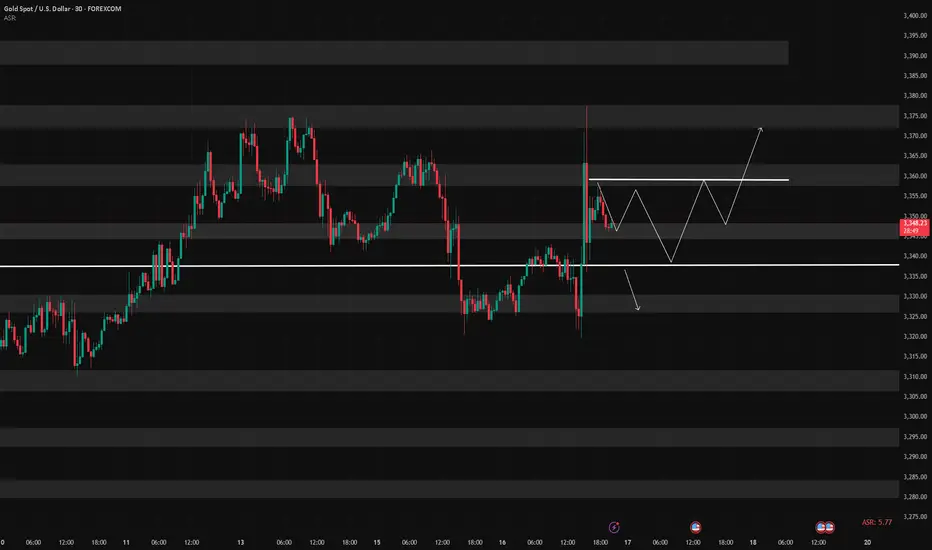
Gold 30 min ideaWe said by previous analysis gold down to 3312 ( see my previous chart). Now we booked that profits. So next will be 3296.

XAUUSD M30 BEST BUYING SETUP FOR TODAY📈 GOLD TRADING SCENARIO 🪙
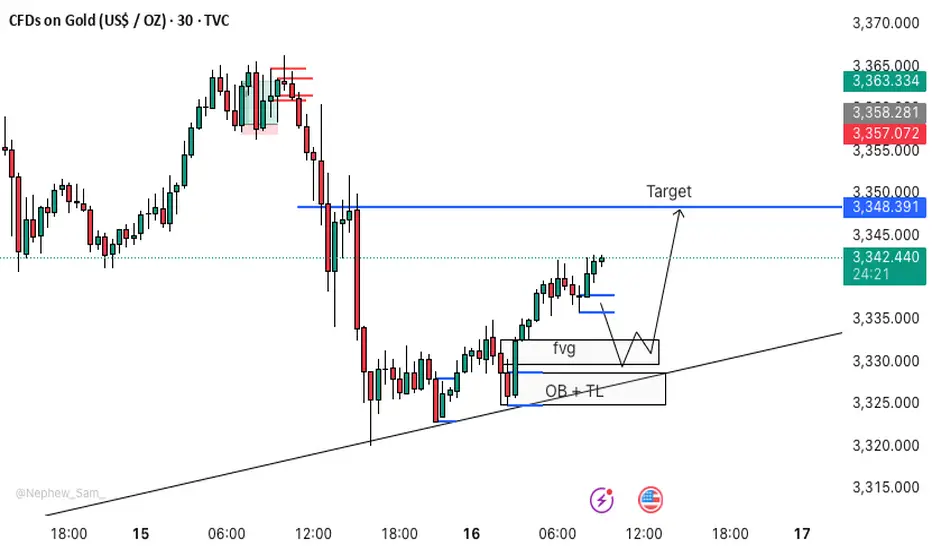
Gold is currently in bullish momentum, making this the perfect buying zone. ✅
🟨 Buy Zone: 3332 – 3327
We have three strong confirmations in this zone:
🔹 FVG (Fair Value Gap)
🔹 OB (Order Block)
🔹 TL (Trendline)
This is a valid entry point for gold. 📌
🔔 Action: If price reaches the 3332–3327 zone, buy gold and wait patiently for the move to play out. 🧘♂️
Expecting Gold bullish Movement Gold (XAU/USD) has exhibited a strong bullish reversal from the key support zone near 3325 marked by the red area on the chart The price formed a series of higher lows indicating bullish momentum buildup before breaking out sharply above the descending channel and resistance zone around 3340
Following this breakout, the market is now consolidating above the broken resistance, which is acting as new support signaling a potential continuation of the upward trend
Key Levels
Target 1 3365 3370 grey resistance zone
Target 2 3385 3390 major resistance zone
If price holds above the support at 3340 and continues forming higher lows, we expect bullish continuation toward Target 1 and eventually Target 2 if momentum sustains Traders should monitor price action closely at each target zone for potential reactions or reversals

CURRENT situation on XAUUSD 30M CHART Signal processgold buy singnal analysis keep holding market may be long side and good analysis
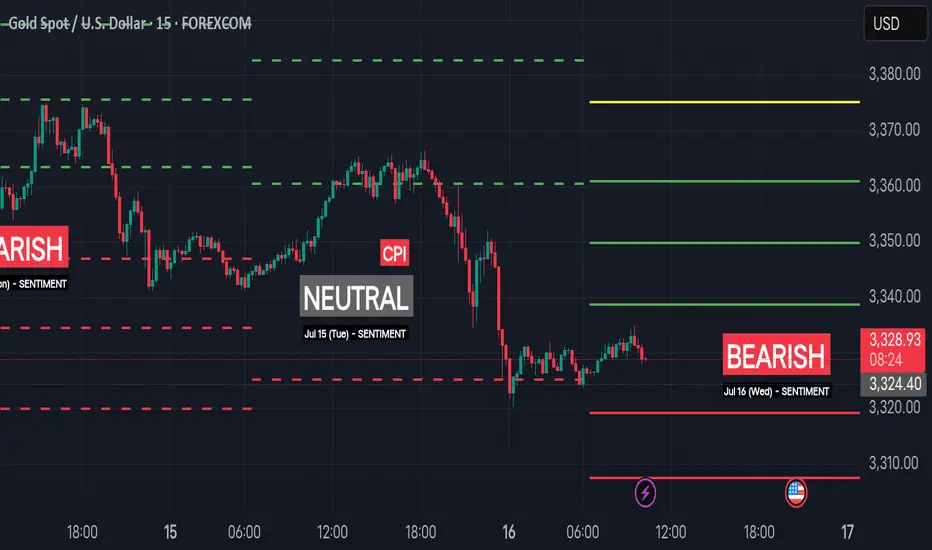
Bearish Sentiment (Jul 16 Wed) | Intraday S/R for Swing TradingSentiment: Bearish
🟢 Support Levels
1. 3319.20 – Minor support near Friday’s bounce zone
2. 3307.60 – Key support from early U.S. session rejection zone
3. 3296.10 – Institutional support / demand buildup
4. Extreme Support: 3283.40 – Break below this opens extended sell-off zone
🔴 Resistance Levels
1. 3338.70 – Minor resistance from overnight price action
2. 3349.80 – Key resistance aligned with previous close and seller defense
3. 3361.00 – Strong intraday ceiling, potential short trigger
4. Extreme Resistance: 3375.20 – Break above this signals risk-on bullish momentum