Gold Aiming Higher: Bullish Momentum Toward Key S&D ZoneHello guys!
The main bullish trend remains intact on Gold. After forming a solid base near the QML level, price has been respecting the ascending channel structure and is now pushing toward the upper boundary of that channel.
The current price action shows strength and momentum, and with the recent breakout above the midline of the channel, it signals that buyers are likely to push price toward the next key area of interest.
The target is clearly defined: the supply zone around 3409–3423, which has previously acted as a major resistance area.
Core idea:
Main trend: Bullish
Structure: Ascending channel
Support confirmed: QML zone bounce
Current behavior: Price moving along the top of the channel
Target: 3409–3423 supply zone
CFDGOLD trade ideas

GOLD - Price may bounce up to $3375 level from support lineHi guys, this is my overview for XAUUSD, feel free to check it and write your feedback in comments👊
Initially, the price action was confined within a descending channel before a decisive bullish breakout occurred.
This first breakout triggered a strong upward impulse, setting the stage for the current market structure.
The price is now consolidating in a wide flat range, bounded by support near the $3285 level and resistance at $3375.
An ascending support line is providing dynamic support within this consolidation pattern, indicating underlying buying pressure.
I expect a brief retest of this support line, which should act as a launchpad for the price to move higher.
The primary target for this long setup is the $3375 resistance level, marking the top of the current flat range.
If this post is useful to you, you can support me with like/boost and advice in comments❤️
Disclaimer: As part of ThinkMarkets’ Influencer Program, I am sponsored to share and publish their charts in my analysis.

Gold Breakout and Potential RetraceHey Traders, in tomorrow's trading session we are monitoring XAUUSD for a buying opportunity around 3,340 zone, Gold was trading in a downtrend and successfully managed to break it out. Currently is in a correction phase in which it is approaching the retrace area at 3,340 support and resistance area.
Trade safe, Joe.

XAUUSD: Time For Swing Sell, 1 Hour Timeframe! Gold is currently trading at crucial level where we have witnessed a strong bearish presence. This is a small time frame overview and price may not complete the target fully, so close when you think it is the time. Good luck and trade safe!
Team Setupsfx_

1H CHART ROUTE MAP UPDATEHey Everyone,
Quick follow up on yesterday’s 1H chart update
Today, we saw exactly the type of reaction we were looking for at the 3328 retracement level. Price respected the zone perfectly, offering a clean bounce, just as we anticipated and stated yesterday. There was no EMA5 cross and lock below 3328, confirming a strong rejection and aligning perfectly with our plan to buy dips into 3355 and above.
This move further validates our structure and the importance of waiting for confirmations rather than jumping the gun. As always, EMA5 cross and lock levels remain key in tracking momentum shifts. We’ll continue to monitor for a cross and lock above each Goldturn level to confirm the next move.
Also, let’s not forget the 3381 gap we highlighted in Monday’s outlook, it remains a magnet above, and we’re keeping it firmly on our radar.
The plan remains the same: We are buying dips at key levels with solid risk management and using EMA5 confirmations to confirm the moves.
Updated Reminder of Key Levels:
BULLISH TARGET
3381
EMA5 CROSS & LOCK ABOVE 3381 opens
3416
EMA5 CROSS & LOCK ABOVE 3416 opens
3439
BEARISH TARGETS
3353 ✅ HIT
EMA5 CROSS & LOCK BELOW 3353 opens
3328 ✅ HIT
EMA5 CROSS & LOCK BELOW 3328 opens
3305
EMA5 CROSS & LOCK BELOW 3305 opens Swing Range:
3288
3259
As always, we’ll continue monitoring and sharing updates, as price reacts around these zones. Thank you all for the continued support, your likes, comments, and follows are genuinely appreciated!
Mr Gold
GoldViewFX

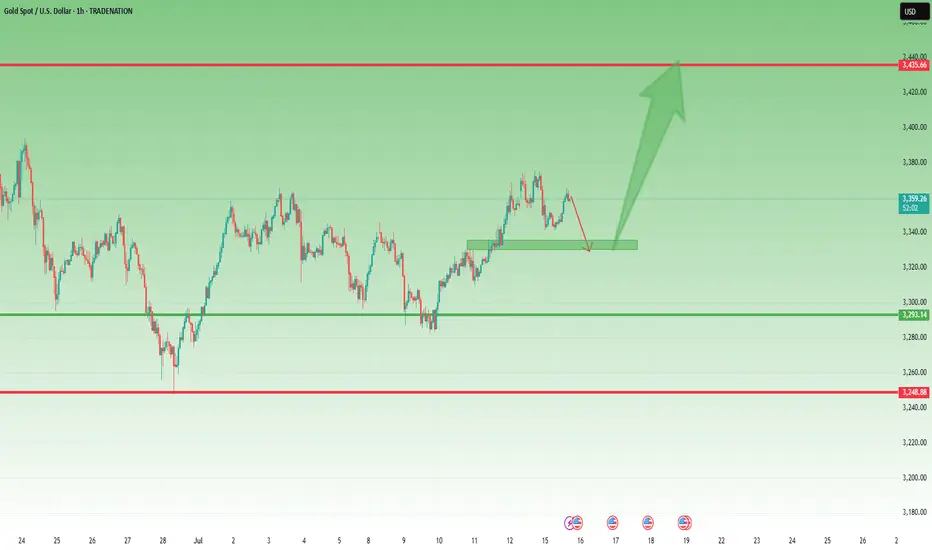
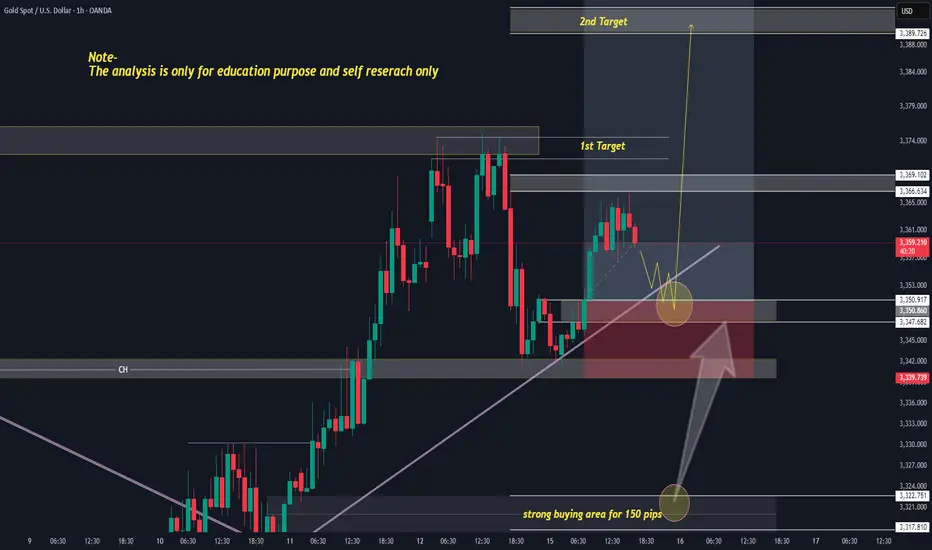
Gold Pullback in Play – Still Aiming for 3450 📌 In yesterday’s analysis, I argued that bulls likely won the battle and that a new leg up toward 3450 could be next from a swing trade perspective. I also mentioned that buying dips remains the preferred strategy.
And indeed – we got that dip.
📉 Price pulled back to 3340 and bounced,
but it hasn’t yet touched my key area of interest: 3330–3335.
What now?
My view stays the same –I still expect a move toward the 3450 zone,but I also believe a deeper dip toward support is still on the table – likely a liquidity grab before the next leg up.
Trading Plan:
✅ Buying dips remains the core strategy
🚫 Invalidation only comes on a break below 3305–3310
🎯 Upside target remains well above 3400, aiming for 1000+ pips
Let’s stay focused and let price come to us.
🚀
Disclosure: I am part of TradeNation's Influencer program and receive a monthly fee for using their TradingView charts in my analyses and educational articles.
THE KOG REPORT - UpdateEnd of day update from us here at KOG:
Nice start to the week with price attempting that higher red box and failing to breach it. We then activated an Excalibur signal short, identified the structure and got a lovely move into the 3552 level from 3371 activation. Traders then had the opportunity to capture the tap and bounce from the 50MA on the hourly, again giving a minimum of 100pips on the bounce.
Now, we have support below 3340 which was the bias level which has also rejected price giving a long, but, resistance here stands at 3357. Below that level we are more likely to see this range or attempt lower sticking to the plan on the KOG Report published yesterday.
KOG’s Bias of the day:
Bullish above 3340 with targets above 3375, 3388 and above that 3392
Bearish on break of 3340 with targets below 3335, 3332, 3320 and 3310 (No Breach)
RED BOXES:
Break above 3376 for 3382, 3390, 3396 and 3304 in extension of the move (No breach)
Break below 3365 for 3362✅ and 3355✅ in extension of the move
As always, trade safe.
KOG

GOLD DAILY CHART ROUTE MAPHey Everyone,
Daily Chart Follow Up – Structure Still in Full Control
Just a quick update on our daily structure roadmap. Price continues to respect our Goldturn levels with surgical precision.
After the previous bounce off 3272, we’ve now seen over 800 pips of upside follow through. That level once again proved its weight, holding beautifully as support and launching price firmly back toward the upper boundary.
We now have a clear gap overhead at 3433, which sits right near the channel top a familiar rejection zone. With that in play, we’re expecting a range bound dynamic to develop between 3272 and 3433 in the short term.
Here’s what we’re focusing on next:
Range scenario active:
Until price breaks out cleanly, we anticipate swings between 3433 resistance and 3272 support to play out. This is the working range for now.
EMA5 cross and lock:
Watch for a clean EMA5 break and lock, this will be our technical confirmation for whether we’re breaking out of this range or just ping ponging inside it.
Structure remains intact:
No EMA5 breakdown off 3272 during the recent test means buyers remain in control. Until that changes, dips into 3272 continue to offer structured long setups.
Key Levels This Week
Support 3272 Proven bounce zone. As long as this holds, the structure favours upside.
Resistance 3433 Open gap + channel top confluence; expect reaction and potential fade unless we break cleanly with EMA5 confirmation.
As always, we continue to let structure guide the way, measured, deliberate, and data-driven.
Thanks again for all the continued support, every like, comment, and follow is truly appreciated.
Wishing you all a focused and profitable week ahead!
Mr Gold
GoldViewFX

Double Top + Zigzag Complete: Are Bears About to Take Over Gold?Yesterday, the financial markets in general, including Gold ( OANDA:XAUUSD ) , acted like a roller coaster after the news of Powell's dismissal . After this news was denied , Gold returned to its main trend, which I published in my previous idea .
Gold is currently re-attacking the Support line , Support zone($3,326-$3,325) and 50_SMA(Daily) .
In terms of classic technical analysis , it seems that gold has formed a Double Top Pattern for support breakdowns, where a Support line breakdown can also be accompanied by a neckline breakdown .
From the perspective of Elliott Wave theory , it seems that Gold has managed to complete the Zigzag Correction(ABC/5-3-5) , and we should wait for the next bearish waves .
I expect Gold to break its supports and move towards $3,290 ; support breaks are best done with high momentum . An important price that can change the direction of Gold's downside is $3,350 .
Note: If Gold breaks the Resistance lines and forms an hourly candle above $3,351(Stop Loss (SL)), we can expect further Gold gains.
Gold Analyze (XAUUSD), 2-hour time frame.
Be sure to follow the updated ideas.
Do not forget to put a Stop loss for your positions (For every position you want to open).
Please follow your strategy; this is just my idea, and I will gladly see your ideas in this post.
Please do not forget the ✅ ' like ' ✅ button 🙏😊 & Share it with your friends; thanks, and Trade safe.

THE KOG REPORT THE KOG REPORT:
In last week’s KOG Report we said we would be looking for the price to spike down into potentially the extension level 3310 and then give us the tap and bounce we wanted to be able to capture the long trade in to the 3345-50 region initially. It was those higher resistance levels that we said we would stick with and the bias was bearish below. This move resulted in a decent long trade upside into the region we wanted, and then the decline we witnessed mid-week completing all of our bearish target levels which were shared with everyone.
On top of that, we got the bounce we wanted for the long trade but only back up into the 3335 level which was an Excalibur active target. The rest, we just sat and watched on Friday as unless we were already in the move, the only thing we could have done is get in with the volume, which isn’t a great idea with the limited pull backs.
All in all, a great week in Camelot not only on Gold, but also the other pairs we trade with the DAX swing trade being a point to point swing move executed with precision by the team.
So, what can we expect in the week ahead?
We’ll keep it simple again this week but will say this, there seems we may see a curveball on the way this week. With tariff news over the weekend we may see price open across the markets with gaps, one thing we will say is if you see these gaps, don’t gap chase until you see a clean reversal!
We have the higher level here of 3375-85 resistance and lower support here 3350-45. If support holds on open we may see that push upside into the red box which is the one that needs to be monitored. Failure to breach can result in a correction all the way back down into the 3335 level initially. Again, this lower support level is the key level for this week and needs to be monitored for a breach which should then result in a completed correction of the move.
Our volume indicators are suggesting a higher high can take place here and if we do get a clean reversal we should see this pull back deeply. As usual we will follow the strategy that has been taught and let Excalibur guide the way.
KOG’s bias for the week:
Bullish above 3350 with targets above 3360, 3373, 3375 and 3383 for now
Bearish below 3350 with targets below 3340, 3335, 3329, 3320 and 3310 for now
RED BOX TARGETS:
Break above 3365 for 3372, 3375, 3382, 3390 and 3406 in extension of the move
Break below 3350 for 3340, 3335, 3329, 3322 and 3310 in extension of the move
It’s a HUGE RANGE this week so play caution, wait for the right set ups, don’t treat it like it’s your every day market condition. News from Tuesday so expect Monday to be choppy!
Please do support us by hitting the like button, leaving a comment, and giving us a follow. We’ve been doing this for a long time now providing traders with in-depth free analysis on Gold, so your likes and comments are very much appreciated.
As always, trade safe.
KOG

GOLD TECHNICAL ANALYSIS H4 TIMEFRAMECurrent Price: ~$3,371
Trend: Currently breaking out of a downtrend channel, with a strong upward push.
Chart Pattern: Price has formed a rounded bottom and is moving higher, indicating bullish momentum
🔼 Resistance Levels (Targets):
1. First Resistance / Target: ~3,404.54 – 3,403.61
→ This is the first breakout target after crossing the trendline.
2. Final Resistance / Target: ~3,462.40 – 3,490.39
→ This zone represents the major resistance where bulls might face selling pressure.
🔽 Support Level:
Support Zone: ~3,310 – 3,320
→ This is the previous bottom and the bullish reversal zone, acting as strong support.
📈 Projected Bullish Move (According to Chart Arrows):
A pullback may occur after breaking above the trendline.
Then, price is expected to rally toward 3,403, retest, and eventually target 3,462 – 3,490 area.
✅ Key Indicators Noted:
The Ichimoku cloud shows bullish bias.
Chart shows higher lows, indicating strengthening buyer interest.
Bullish candle formations near the breakout zone support upward continuation.
🧭 Conclusion (Trade Idea):
Bias: Bullish
Entry: On breakout and retest above the trendline (around 3,360–3,370)
Targets:
1st Target: 3,404
2nd Target: 3,462
Final Target: 3,490
Stop Loss: Below 3,320 support zone

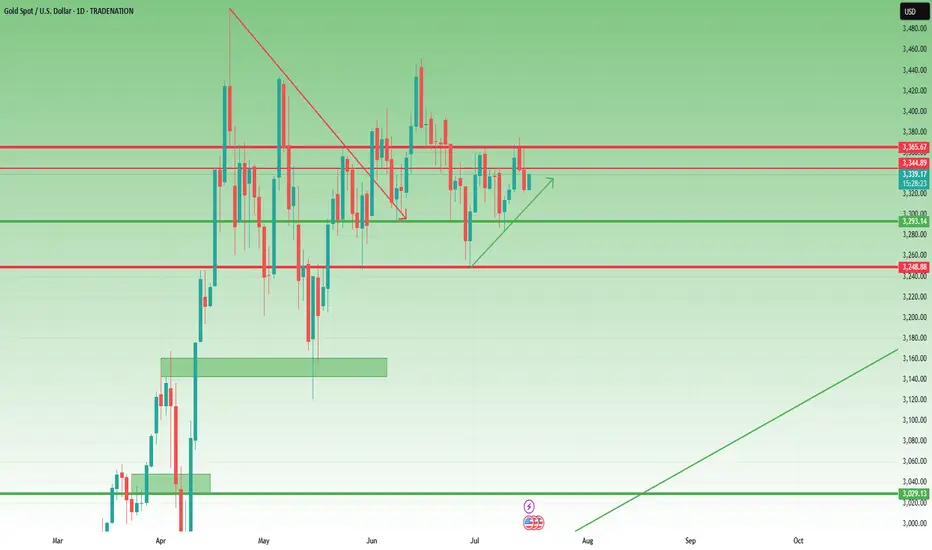
Gold Bulls Are Back – Eyes on 3450 GOLD – Bulls Regain Control After Defending 3280
🟡 Last week was a dynamic one for Gold traders.
The week began with signs of an upside reversal, followed by a drop to test the 3280 support. That dip held—and from there, we saw a strong push higher, ending the week right at the top of the range.
📌 Friday’s close left behind a continuation Pin Bar on the weekly chart – a strong signal in favor of the bulls.
- This week started with a new local high at 3375,but we’re now seeing a pullback in the 3355 area at the time of writing.
What’s next?
Given last week’s price action, bulls seem to have won the battle and appear ready to challenge the 3400 level.
My plan for this week:
I’m looking to buy dips, and as long as nothing changes, my target is the 3450 zone.
Disclosure: I am part of TradeNation's Influencer program and receive a monthly fee for using their TradingView charts in my analyses and educational articles.

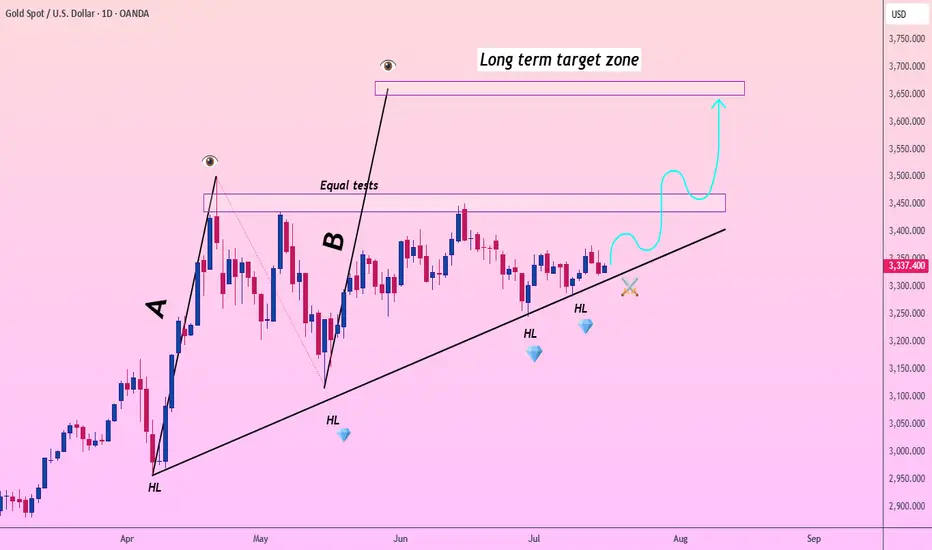
Lingrid | Gold ready to Make BoostOANDA:XAUUSD maintains a solid bullish structure with a clear series of higher lows (HLs) forming along the ascending trendline. After strong impulsive waves labeled A and B, price has repeatedly tested the resistance zone around 3450–3460, creating a double-top-like structure with equal tests. A confirmed close above 3460 would unlock the next leg higher in this ongoing uptrend.
📉 Key Levels
🔼 Buy trigger: Break and close above 3460
🟢 Buy zone: 3320–3340 (near HL and trendline)
🎯 Target: 3650–3700 (long-term breakout objective)
🚫 Invalidation: Drop below 3275 and trendline failure
💡 Risks
-Potential fakeout above 3460 without volume support
-Broadening consolidation range if breakout fails
-Macroeconomic catalysts (FOMC, CPI, geopolitical tensions)
If this idea resonates with you or you have your own opinion, traders, hit the comments. I’m excited to read your thoughts!
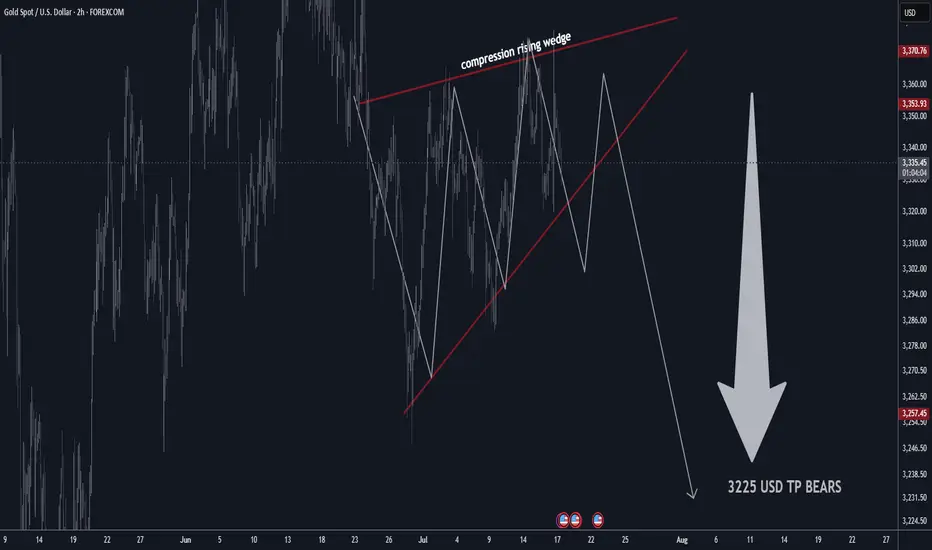
GOLD H2 Rising Wedge Expecting SellOFF TP BEARS 3225 USD📊 Gold Technical Outlook Update – H4 & 2H Chart
📰 Latest Summary Headlines
• Gold stalls near highs as technical compression signals possible breakdown
• Bearish rising wedge on 2-hour chart hints at sharp move lower
• Market volatility stays elevated amid global economic risks
• Short-term sellers targeting $3,225 if wedge pattern breaks
________________________________________
🏆 Market Overview
• Gold remains in a choppy range, struggling to clear key resistance.
• 2H Chart: Bearish rising wedge pattern identified, showing compression—expecting a potential breakdown soon.
• Overhead resistances: $3,410 / $3,460 USD will likely cap further upside.
• Major supports: $3,160 / $3,240 USD.
• If support fails, next key bear target is $3,225 USD.
• Range trading remains favored for now.
• Volatility likely to persist with no major bullish headlines on the horizon.
________________________________________
⭐️ Recommended Trade Strategy
• Bearish Setup (2H): Short sell gold at market on wedge breakdown.
o Stop loss: Above recent highs (set according to your risk tolerance and latest 2H swing high).
o Take profit: Target $3,225 USD.
• Continue to focus on selling near resistance, buying near support.
• Momentum: Watch for sharp moves as wedge resolves—be nimble!
• Always manage risk and adjust stop as price develops.
________________________________________
💡 Gold Market Highlights
• Safe-haven demand still strong due to tariffs, geopolitical tension, and U.S. fiscal concerns.
• Central banks & investors remain net buyers, but jewelry demand slides at high prices.
• Price action is dominated by institutional flows, with banks forecasting potential for gold above $4,000 next year—but short-term correction likely if wedge breaks.
• Current price: ~$3,358 per ounce. Compression suggests a larger move coming soon.
________________________________________
Summary:
Gold is at a crossroads, with a bearish wedge pattern building on the 2-hour chart. A breakdown could see a quick move to $3,225. Short sellers should act on confirmation, while bulls will look to reload at key support. Stay tactical!
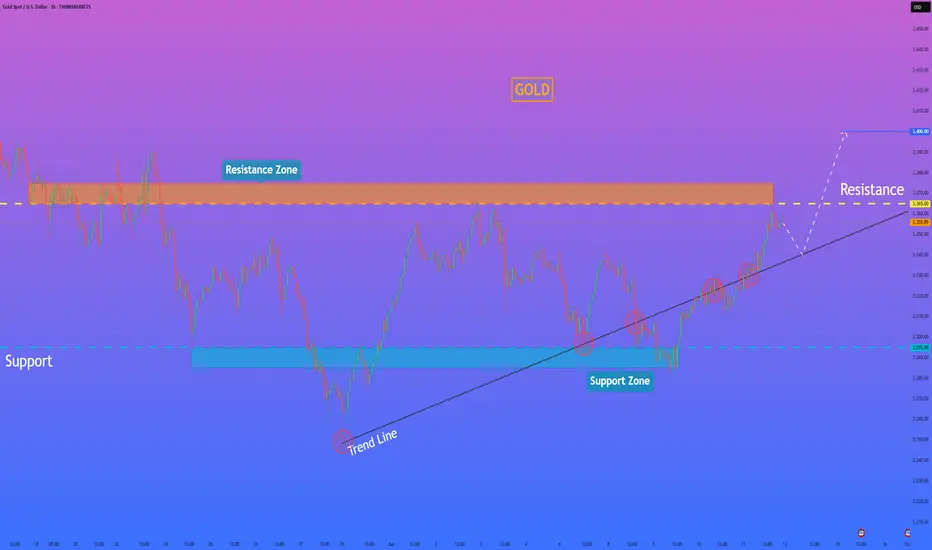
HelenP. I Gold will break resistance level and continue to growHi folks today I'm prepared for you Euro analytics. After a strong bullish impulse, the price managed to break above the local resistance zone and reach the 3365 level. This zone had previously acted as a barrier for upward movement, but now the price is consolidating just below it, forming a possible correction setup. I see that price followed a clear trend line during its recent rally, and multiple times this line acted as dynamic support. The buyers respected it and entered the market with each touch. Currently, Gold is hovering near the upper boundary of the resistance zone. I expect that before continuing to grow, the price may make a slight correction toward the trend line, using it again as a support for a potential rebound. This would also allow the market to gather more liquidity before targeting new highs. Once the correction completes and the trend line holds, I expect gold to rise again, break through the 3365 resistance level, and continue its upward movement toward 3400 points, which is my main goal for this setup. Given the strong trend, the bullish impulse, and clear support from the trend line, I remain optimistic and anticipate further growth. If you like my analytics you may support me with your like/comment.❤️
Disclaimer: As part of ThinkMarkets’ Influencer Program, I am sponsored to share and publish their charts in my analysis.
Gold 30Min Engaged ( 3355 Bearish Entry Detected )Time Frame: 30-Minute Warfare
Entry Protocol: Only after volume-verified breakout
🩸Bearish Reversal 3355 Zone
➗ Hanzo Protocol: Volume-Tiered Entry Authority
➕ Zone Activated: Dynamic market pressure detected.
The level isn’t just price — it’s a memory of where they moved size.
Volume is rising beneath the surface — not noise, but preparation.
🔥 Tactical Note:
We wait for the energy signature — when volume betrays intention.
The trap gets set. The weak follow. We execute.

GOLD 4H CHART ROUTE MAP UPDATE & TRADING PLAN FOR THE WEEKHey Everyone,
Please see our updated 4h chart levels and targets for the coming week.
We are seeing price play between two weighted levels with a gap above at 3364 and a gap below at 3297. We will need to see ema5 cross and lock on either weighted level to determine the next range.
We will see levels tested side by side until one of the weighted levels break and lock to confirm direction for the next range.
We will keep the above in mind when taking buys from dips. Our updated levels and weighted levels will allow us to track the movement down and then catch bounces up.
We will continue to buy dips using our support levels taking 20 to 40 pips. As stated before each of our level structures give 20 to 40 pip bounces, which is enough for a nice entry and exit. If you back test the levels we shared every week for the past 24 months, you can see how effectively they were used to trade with or against short/mid term swings and trends.
The swing range give bigger bounces then our weighted levels that's the difference between weighted levels and swing ranges.
BULLISH TARGET
3364
EMA5 CROSS AND LOCK ABOVE 3364 WILL OPEN THE FOLLOWING BULLISH TARGETS
3429
EMA5 CROSS AND LOCK ABOVE 3429 WILL OPEN THE FOLLOWING BULLISH TARGET
3499
EMA5 CROSS AND LOCK ABOVE 3499 WILL OPEN THE FOLLOWING BULLISH TARGET
3561
BEARISH TARGETS
3297
EMA5 CROSS AND LOCK BELOW 3297 WILL OPEN THE SWING RANGE
3242
3171
EMA5 CROSS AND LOCK BELOW 3171 WILL OPEN THE SECONDARY SWING RANGE
3089
3001
As always, we will keep you all updated with regular updates throughout the week and how we manage the active ideas and setups. Thank you all for your likes, comments and follows, we really appreciate it!
Mr Gold
GoldViewFX

GOLD NEXT MOVE (expecting a bullish move)(15-07-2025)Go through the analysis carefully and do trade accordingly.
Anup 'BIAS for the day (15-07-2025)
Current price- 3358
"if Price stays above 3340, then next target is 3372, 3390 and 3410 and below that 3325 and 3315 ".
-POSSIBILITY-1
Wait (as geopolitical situation are worsening )
-POSSIBILITY-2
Wait (as geopolitical situation are worsening)
Best of luck
Never risk more than 1% of principal to follow any position.
Support us by liking and sharing the post.
Gold – Bullish Structure Still Intact, but Bears are Knocking📉 What happened yesterday?
As expected, XAUUSD made another leg down, breaking even below my buy zone (3330–3335) and hitting a low at 3320. From there, we’re now seeing a modest rebound, with gold trading around 3333 at the time of writing.
📌 Current position:
I'm currently holding a long position. It hovers around break-even – fluctuating between small gains and small losses. Nothing solid yet.
❓ Key question:
Was this just a deep pullback within a bullish structure… or the beginning of a deeper trend reversal?
🔍 Why bulls still have a case:
• Price prints higher lows – bullish structure technically remains intact
• A clean break above 3350 would show short-term strength
• A confirmed break above 3375 would activate a bullish ascending triangle → targeting the 3450 zone
⚠️ But here's the concern:
• Yesterday’s dip to 3330 happened during the New York session (strong volume)
• The bounce from 3320 has been weak, with no follow-through
• Daily candle closed near the lows, showing a long upper wick → a classic bearish signal
• The confluence support now lies at 3310–3320. A red daily candle closing in this area could mean the medium-term trend is flipping
🎯 My trading plan:
Although I'm still holding my buy, if bulls don’t recover 3350 quickly, I will consider closing early. The break of 3310 would shift my bias bearish.
________________________________________
📌 Conclusion:
We’re in a critical zone. The bullish structure isn’t broken yet, but yesterday’s action was not encouraging. If buyers fail to reclaim control soon, the market may be preparing for a deeper correction. Stay sharp. 🚀
Disclosure: I am part of TradeNation's Influencer program and receive a monthly fee for using their TradingView charts in my analyses and educational articles.
Hellena | GOLD (4H): LONG to resistance area of 3397 (Wave 3).Dear colleagues, my previous forecast remains valid, but I have decided to update it.
At the moment, I still think that wave “3” of the medium order continues its upward movement.
At the moment, I think that the small correction in wave “2” is ending and we will see a continuation of the trend. I see the resistance area of 3397.94 as the target. The main thing is to overcome the local level of the small wave “1” at 3366.37.
Manage your capital correctly and competently! Only enter trades based on reliable patterns!

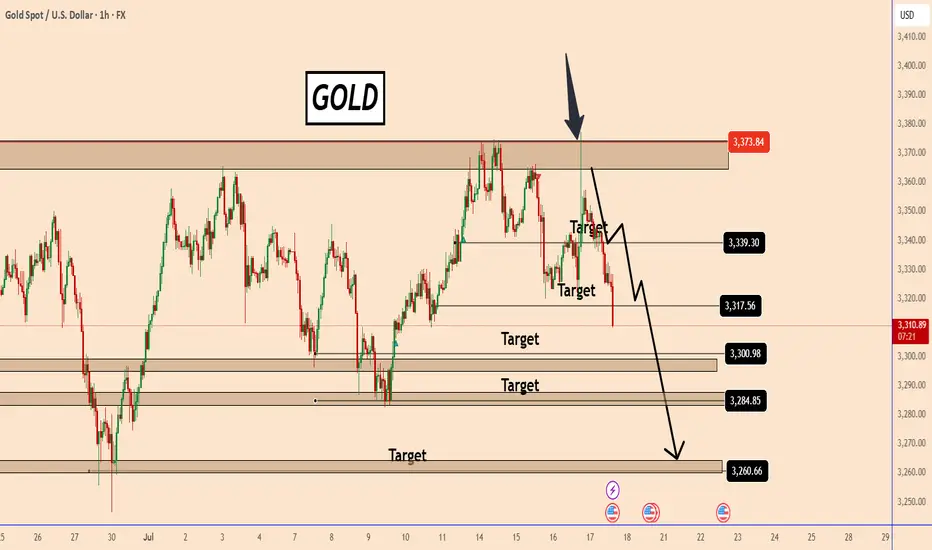
GOLD: Continues to respect our bearish scenarioGOLD: Continues to respect our bearish scenario
Yesterday we had a bad joke from Trump and the price tested again a very strong resistance area located near 3378.
As you can see from the chart, the sell-off happened quickly and was just a sell-off in a deep pullback.
Today, the price was struggling to find a clear direction, but after Trump said he had no plans to fire the Federal Reserve's Powell, the market calmed down easily.
The price fell from another strong support area earlier today after the US printed strong Retail Sales data for June of 0.6% versus an estimate of 0.1%.
The chances of further declines, as I explained earlier, are increasing further and it could even reach 3260, it seems.
You may find more details in the chart!
Thank you and Good Luck!
PS: Please support with a like or comment if you find this analysis useful for your trading day
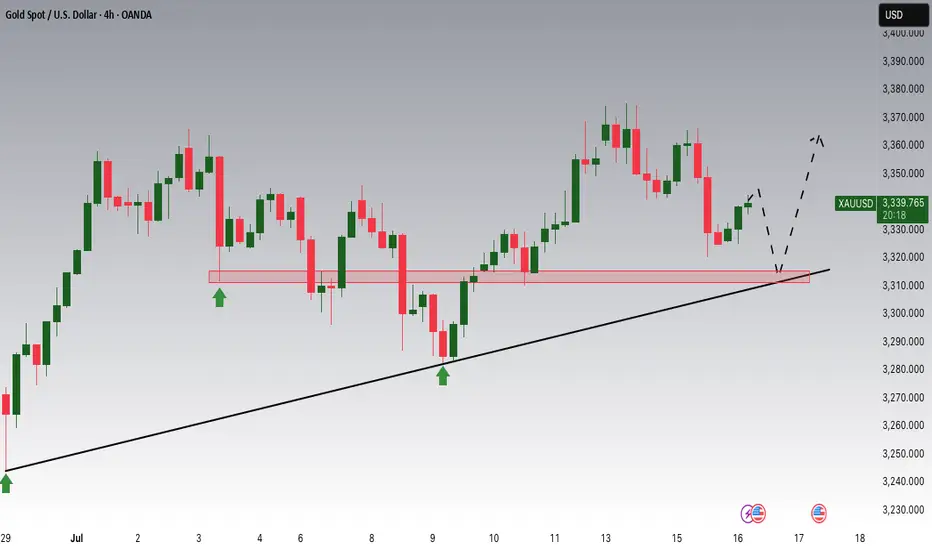
Gold Potential UpsidesHey Traders, in today's trading session we are monitoring XAUUSD for a buying opportunity around 3,310 zone, Gold is trading in an uptrend and currently is in a correction phase in which it is approaching the trend at 3,310 support and resistance area.
Trade safe, Joe.
XUA/USD) Bearish Analysis Read The captionSMC trading point update
Technical analysis of XAU/USD (Gold vs USD) on the 1-hour timeframe. Here's a breakdown
Technical Analysis Summary
1. Descending Channel:
The price is moving within a clear descending channel, indicating a bearish market structure.
Recent price action rejected the upper boundary of the channel, strengthening the downtrend bias.
2. Resistance Rejection:
A key resistance level around 3,340–3,345 was retested (marked with a red arrow) and rejected.
Price has already shown early bearish candles post-rejection, suggesting weakness at that level.
3. 200 EMA (Exponential Moving Average):
Price is currently hovering around the 200 EMA, and a clean break below it could accelerate the bearish move.
4. RSI Indicator:
RSI is around 46, below neutral 50, showing bearish momentum is building but not yet oversold.
No divergence is present, supporting the idea of continuation.
---
Bearish Playbook
Entry Idea: After the rejection at the resistance zone and confirmation of lower highs.
Target: 3,313 – 3,310 zone (marked as the “key support level” and “target point”).
Risk Management: A stop loss above 3,345 (above the resistance zone) would be a prudent protection level.
---
Confluences Supporting the Short Setup:
Rejection at horizontal resistance.
Alignment with the descending trendline/channel.
Price trading near or below the 200 EMA.
RSI slightly bearish.
Caution:
Watch out for any macroeconomic news or high-impact events (highlighted with the economic event icons) that could inject volatility.
A strong break back above the resistance could invalidate this bearish setup.
Mr SMC Trading point
Conclusion:
This setup anticipates a bearish continuation targeting the 3,310 support zone. Ideal for short-term traders looking for downside opportunities, provided price respects the trend and fails to reclaim the resistance.
Please support boost 🚀 this analysis)
