Gold Drops to 3,284 – Short-Term Support at Risk📊 Market Overview
Gold fell sharply this morning to $3,284/oz amid a modest USD rebound and profit-taking pressure following several range-bound sessions. The lack of fresh catalysts also contributed to weaker momentum.
📉 Technical Analysis
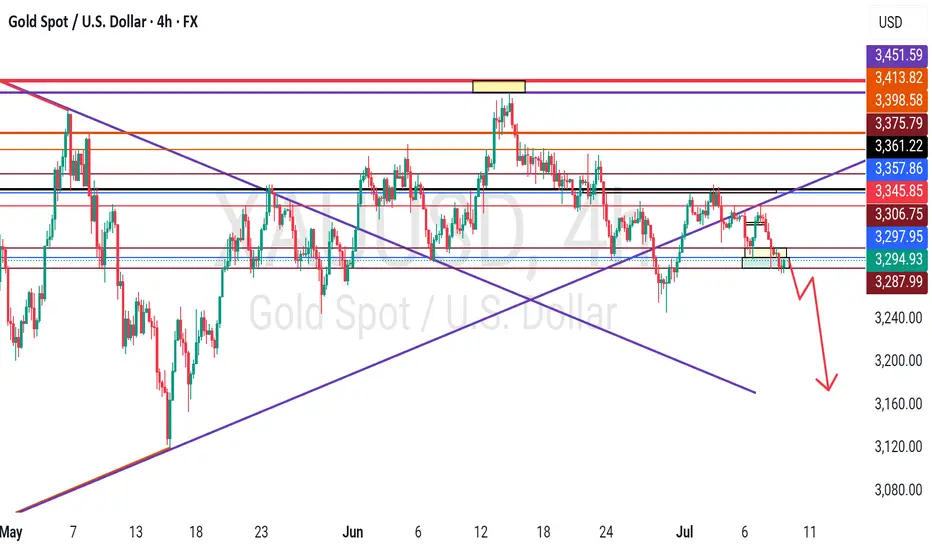
• Key Resistance: 3,315 – 3,330
• Nearest Support: 3,280 – 3,275
• EMA 09: Price is currently trading below the EMA 09 on both the H1 and H4 timeframes → short-term bearish signal
• Candle Patterns & Momentum:
– H1 candle shows a bearish engulfing pattern near the 3,305 area → confirms downward pressure
– RSI is below 45, MACD has crossed below its signal line → bearish momentum dominant
– If the 3,275 level is breached, gold could continue to fall toward 3,260
📌 Outlook
Gold is leaning toward further downside unless it can hold above the 3,280 support level during today’s session.
💡 Trade Strategy
🔻 SELL XAU/USD at: 3,295 – 3,398
🎯 TP: 40/80/200 PIPS
❌ SL: 3,305
🔺 BUY XAU/USD at: 3,275 – 3,278
🎯 TP: 40/80/200 PIPS
❌ SL: 3,269
CFDGOLD trade ideas

GOLD - at resistance ? Holds or not??#GOLD.. .market perfect dropped below our area that was around 3320
Now market bounced back and just near to his resistance area 3295 96
That will be market final area and only holdings of that region means another drop expected.
Note: we will plan for cut n reverse above that region.
Good luck
Trade wisely
GOLD 15MIN STRATEGYGOLD ,trading below 3300 $ per ounce is normal ,market will take correction and balance for liquidity to flow.
the renew dollar index buying and hope in the US10Y keeping steady growth could be a reason that investors are searching for new GOLD and liquidity is moving out of gold market
we could be seeing more correction in to 3200 whole number, it best to trade layer by layer
allow the market to swing and catch some pips ..
like and share for more.

Gold price this afternoon (July 8)Given the definition of the gold price trend, market participants remain anxious and oriented to signs of the US Federal Reserve’s stance on monetary tightening, which could shape the future course of gold prices.
As the US dollar gains traction, it is also a difficult time for gold. But if the tariff war accelerates, gold will rise, especially as fears of annihilation and trade wars increase.
🔴 XAUUSD BUY 3295 3293 🔴
✅TP1: 3310
✅TP2: 3320
✅TP3: OPEN
🚫 SL:3289
🔴 XAUUSD SELL 3308 3306 🔴
✅TP1: 3300
✅TP2: 3290
✅TP3: OPEN
🚫 SL:3313

Data is about to be released. Where will gold go?Yesterday, the market expected a trade agreement between the United States and its trading partners, which boosted risk sentiment, and the strengthening of the US dollar and the rise in US bond yields further added pressure on gold prices. Gold fell 1% during the day and once lost the $3,300 mark during the session.
After gold bottomed out and stabilized at 3,320 on Monday, it fell sharply above 3,320 again on Tuesday and has now completely fallen below 3,320. The position of 3,320 is very important. In the 3,320-50 range, it chose to break down at 3,320 again.
Today, the Federal Open Market Committee of the United States will release the minutes of the June monetary policy meeting. Although Federal Reserve Chairman Powell remained neutral on the June interest rate decision, many Federal Reserve officials released dovish signals. Federal Reserve Board member Bowerman has turned to support the possibility of a rate cut in July.
From a technical point of view, the market has penetrated into the area around the lower support of 3,275-3,295.
The rhythm of the entire market is still a process of oscillating decline. From the perspective of pressure position, the daily MA5 average line has not fallen below, and may fall again to around 3270. Once the market falls too fast and approaches this position, there is a high probability that there will be a rebound demand.
Operation strategy:
Buy near 3375, stop loss at 3365, profit range 3315-3320.
Continue to hold position after breakthrough.

XAUUSD is on retracement H4 Timeframe Analysis
Gold is currently holding falling wedge the Range of 3330-3290 structural support.Also market is completed Inverse Head & Shoulder pattern which is broken.
What's possible scanarios we have?
▪️if H4 Candle remains below 3280 then we'll see gold to tap 3255 a then 3230 as our optimal target.
(PREFERRED )
▪️exceptional Move of Day if the H4 candle remains above 3280-3290 then keep your eyes at 3320 then 3335
Additional TIP:
All eyes on DXY
#XAUUSD

XAUUSD:High-range consolidation, caution on rally sustainabilityFollowing Trump's reimposition of tariffs, gold staged another rally on the back of its safe-haven allure. Nevertheless, it retreated after encountering resistance near the 3345 mark, making it premature to conclude that gold has entered a robust one-sided bullish trend. After all, for a rally sparked by news-driven factors, the sustainability of the upward momentum demands close scrutiny. Should this momentum falter, gold is likely to re-enter a consolidation phase.
Given that gold is currently lingering at a relatively high level within its rebound and consolidation range, a short-position strategy could be prioritized for the time being. Only if gold sustains strong momentum throughout the day can bulls potentially amass genuine upward impetus.
XAUUSD
sell@3340-3350
tp:3330-3320
I am committed to sharing trading signals every day. Among them, real-time signals will be flexibly pushed according to market dynamics. All the signals sent out last week accurately matched the market trends, helping numerous traders achieve substantial profits. Regardless of your previous investment performance, I believe that with the support of my professional strategies and timely signals, I will surely be able to assist you in breaking through investment bottlenecks and achieving new breakthroughs in the trading field.


Bullish Breakout Anticipation on Gold (XAU/USD)Bullish Breakout Anticipation on Gold (XAU/USD)
On the 30-minute chart, Gold is forming a classic falling wedge pattern, typically seen as a bullish reversal setup. We've just touched the lower support trendline, and early breakout signs are emerging.
📍 Entry: 3,309.500
🎯 Target: 3,335.500
🛑 Stop Loss: 3,299.000
The risk-to-reward ratio looks favorable, and a breakout above the wedge resistance could push price towards the 3,335+ region. Let’s watch for confirmation and volume on breakout.
👇 Drop your thoughts below and let’s discuss!
✅ If you find this analysis helpful, please support by giving a like and following — your support means a lot! 🙌 🟡

GOLD: Bearish Continuation & Short Signal
GOLD
- Classic bearish pattern
- Our team expects retracement
SUGGESTED TRADE:
Swing Trade
Sell GOLD
Entry - 3335.9
Stop - 3338.8
Take - 3330.1
Our Risk - 1%
Start protection of your profits from lower levels
Disclosure: I am part of Trade Nation's Influencer program and receive a monthly fee for using their TradingView charts in my analysis.
❤️ Please, support our work with like & comment! ❤️

gold Indicator Actual Forecast Previous
Average Hourly Earnings m/m
0.3% 0.4% —
Non-Farm Employment Change
147K 111K 139K
Unemployment Rate
4.1% 4.3% 4.2%
Unemployment Claims
233K 240K 236K
Interpretation and Implications
Average Hourly Earnings m/m:
Rose by 0.3%, slightly below the forecast of 0.4%. This suggests wage growth is steady but not accelerating, which may ease some inflation concerns.
Non-Farm Employment Change:
The US economy added 147,000 jobs, beating both the forecast (111K) and the previous month (139K). This indicates continued, though moderate, labor market expansion.
Unemployment Rate:
Fell to 4.1%, better than the expected 4.3% and down from 4.2% previously. This points to a modest improvement in labor market conditions.
Unemployment Claims:
Dropped to 233,000, lower than both the forecast (240K) and last month (236K). This signals fewer new layoffs and continued resilience in the job market.
Market Impact
Dollar (USD):
The combination of stronger-than-expected job growth and a lower unemployment rate is generally supportive for the US dollar, as it suggests the labor market remains robust. However, slightly softer wage growth may temper expectations for aggressive Fed tightening going forward.
Federal Reserve Outlook:
These figures reinforce the Fed’s “data-dependent” stance. Solid job creation and falling unemployment reduce urgency for immediate rate cuts, but the lack of wage acceleration may allow the Fed to maintain a cautious approach.
In summary:
The US labor market in July 2025 shows moderate strength, with job gains and a falling unemployment rate, while wage growth remains steady but not excessive. This mix supports a stable outlook for the dollar and gives the Fed flexibility in its upcoming policy decisions.


Today's bearish target for gold prices: 3300Today's bearish target for gold prices: 3300
Technical analysis:
Short-term support: $3330-3320 (5-day and 10-day moving averages),
Short-term resistance: $3360-3374 (61.8% retracement).
If it falls below $3330, it may fall to the $3306-3320 range;
If it breaks through $3374, it may challenge the previous high of $3450.
The daily chart shows that gold prices are fluctuating at high levels, and the MACD red column has expanded, but the RSI (60-65) shows a good bullish momentum.
2. Main influencing factors
Federal Reserve policy and non-agricultural data:
The market focuses on the US non-agricultural employment data for June released tonight (July 3) (expected to increase by 106,000, and the previous value was an increase of 139,000).
If the data is weak (for example, the unemployment rate rises to 4.3%), it may strengthen the expectation of a rate cut in September, which is good for gold;
On the contrary, if the data is strong, the price of gold may fall back.
The unexpected contraction of the ADP employment data in June (a decrease of 33,000 jobs) has pushed up the expectation of a rate cut in advance.
Geopolitics and safe-haven demand:
If the situation in the Middle East (such as the Iranian nuclear issue) escalates, it may push up the price of gold, but the recent ceasefire agreement between Israel and Iran has weakened the short-term safe-haven support.
The continued purchase of gold by central banks around the world (net purchase of 289 tons in the second quarter of 2025) constitutes long-term support.
The US dollar and interest rates:
The US dollar index has weakened recently, but if the Fed postpones the rate cut (the probability of a rate cut in September is currently 75%), it may suppress the price of gold.
3. My views and market forecasts:
In the short term, the price of gold will fluctuate, and the trend depends on the non-agricultural data.
If the data is weak, the price of gold may rise to $3370-3400;
If the data is strong, the price of gold may fall back below $3300.
I think the possibility of a fall is high.
In the short term, I prefer the strategy and trading ideas of shorting at high prices below 3360-3370.
Suggestions:
Short-term trading: Pay attention to the breakthrough opportunities after the release of non-agricultural data. You can go long at the support level (3330-3320 US dollars) and try to go short at the resistance level (3360-3374 US dollars).
Flexibly adjust the strategy.
Elliott Wave Analysis – XAUUSD, March 7, 2025🌀 Elliott Wave Structure
On the H1 chart, wave 3 appears to have completed, and price is now entering a phase with an unusual structural behavior.
Wave 3 previously showed strong momentum, moving steeply and continuously, with no clear internal pullbacks – a classic impulse wave. Following this, we observed a corrective abc pattern in black, suggesting the end of wave 3.
Interestingly, although yesterday's ADP report was extremely bullish, gold only managed a mild breakout above the wave 3 high before pulling back this morning. Notably, the upward move followed a 3-wave abc structure in green, and price action is now showing overlapping waves with no clear directional momentum.
🧩 These signs suggest a high probability that:
🔹 Wave 5 is forming as an Ending Diagonal – a 5-wave structure with a 3-3-3-3-3 pattern.
🔹 This is typically seen at the end of a bullish cycle and often precedes a sharp reversal.
Although it's too early to confirm, we should patiently observe the upcoming price action. If the ending diagonal completes, it may present a strong sell opportunity.
🎯 Target for wave 5: around 3395, provided all 5 sub-waves within the diagonal complete.
⚠️ If price breaks below 3324, we must consider that the full 5-wave structure is already done, and a new abc corrective phase may have begun.
🔍 Momentum Analysis
Daily (D1): Momentum is about to turn bearish from overbought territory → suggests a weakening uptrend.
H4: Momentum is turning upward → likely a mild rally or sideways movement today before H4 reaches overbought again.
📌 Trading Plan
Given the current wave behavior and overlapping structure, it is best to remain patient and wait for confirmation before taking a strong position. If the Ending Diagonal structure is confirmed, it could signal a major reversal.
SELL Zone: 3392 – 3395
Stop Loss: 3403
Take Profits:
• TP1: 3368
• TP2: 3340
• TP3: 3324

XAUUSD:Today's Trading Strategy
Gold retreated in the sub-session, I have personally increased my long position near 3331, the overall trend is bullish unchanged, the median strategy is patient to rise. If you are trading short, you can go long at 3325-3330 and leave at 3340-45. The same can be said if you want to solve the problem; Trade according to your trading preferences and risk tolerance.
More detailed strategies and trading will be notified here ↗↗↗
Keep updated, come to "get" ↗↗↗

XAUUSD Technical Analysis – 02/07/2025On the 1-hour chart, Gold (XAUUSD) has just confirmed the completion of corrective wave (4) around the 3,328.3 zone, which aligns with the 1.0 Fibonacci level and EMA9 support. Currently, price is rebounding with increasing volume, signaling that buying momentum is returning.
Key Technical Highlights:
Elliott Wave Structure:
Wave (4) found support at 3,328.3.
Wave (5) targets are forming, with Fibonacci extensions pointing to:
0.618: 3,360.05
1.0: 3,380.07
=> These are critical resistance zones to watch.
Fibonacci Retracement Zones:
The current rebound is heading toward the 0.5 and 0.618 retracement levels of the previous down leg, located at 3,362.4 and 3,354.4 – short-term upside targets.
Volume Analysis:
Rising volume on bullish candles confirms a legitimate buying interest, supporting the upward movement.
EMA9 Breakout:
Price has broken above the EMA9 at 3,338.2, shifting short-term trend bias to bullish.
Suggested Trading Strategy:
Favor Buy on Dip entries near the 3,340–3,342 zone if a minor pullback occurs.
Short-term targets: 3,354 – 3,362
Extended target: 3,380
Suggested stop loss below 3,328.0 to manage risk.
Conclusion:
A bullish impulse is forming following the end of wave (4). If price holds above 3,340 and breaks through the nearby Fibonacci resistance levels, wave (5) could extend towards the 3,380 area. This is a pivotal moment to watch for a confirmed short-term uptrend.

Reverse Head & Shoulders Setup | Gold Spot | 15min | by Mohsen M
🔸 **Chart:** Gold Spot / USD (XAU/USD)
🔸 **Timeframe:** 15min
🔸 **Method:** Smart Money Concepts (SMC) + Pattern Recognition
🔸 **Focus:** Reverse H&S, Order Blocks, TLQ, BOS
---
## 🔍 Market Context:
- **Market Structure:** Bearish on higher TF
- **Short-Term Trend:** MSU (Market Structure Up)
- **Efficiency:** ✅ Confirmed — clean price delivery
- **Key Pattern:** Bullish **Inverse Head & Shoulders**
---
## 🧠 Technical Breakdown:
1. **Left Shoulder – Head – Right Shoulder** perfectly forming within a high-value demand zone
2. Price reacted strongly from **Order Block (OB)** + TLQ marked at the bottom wick (Head zone)
3. BOS confirms bullish attempt to shift structure
4. Anticipating neckline break at ~3345 level for further upside
5. Potential resistance and liquidity resting above 3400 (HH region)
---
## 📌 Trading Plan (Pre-London Open / Monday 1:30 AM UTC+3:30):
- **Entry Idea:**
Watch for bullish confirmation after price stabilizes above Right Shoulder zone (~3300–3320)
Or re-entry on a retest of neckline after breakout
- **Stop Loss:**
Below "Head" and OB zone (~3260)
- **Take Profits:**
- TP1: Neckline break zone (~3345)
- TP2: 3400 – Liquidity pool
- TP3: Final HH sweep (~3420+)
---
## ⚠️ Alternate Bearish Case:
> If price breaks below the "Head" zone and OB fails to hold,
> → Expect bearish continuation to the next liquidity zone near **VTA @ 3200**
---
## ✅ Summary:
This is a clean **bullish reversal setup** using SMC logic and a classic H&S pattern:
**OB + TLQ + BOS + Efficient Market + Clear Pattern ➝ High-Probability Setup**
Structure: 🟥 Bearish (macro)
Trend: 🔼 MSU (micro)
Efficiency: ✅ Efficient
Pattern: 🟩 Inverse Head & Shoulders
---
📊 Prepared by: **Mohsen Mozafari Nejad**

After repeated tug-of-war, where will gold go?At present, the gold market is divided between long and short positions. The Federal Reserve may maintain high interest rates, which weakens the investment appeal of gold; however, trade frictions and geopolitical risks provide safe-haven support for gold. Overall, market sentiment is mixed, with bulls lacking confidence, but bears have not been able to fully control the situation. Last week's strong non-farm data reduced market expectations for a rate cut in July, pushing up U.S. bond yields and the dollar, putting pressure on gold, which does not generate interest. In addition, Trump said on social media that he would impose a 10% tariff on countries that "support anti-U.S. policies." The market is waiting for the release of the minutes of the Fed's June meeting, which will more clearly show policymakers' views on the current economic situation and future policies, and may determine the direction of interest rates. If the minutes show that the Fed is inclined to maintain high interest rates for a longer period of time, gold prices may continue to face downward pressure.
From a technical perspective, gold was under pressure at a high level at the opening, so gold is expected to fall today. Today's key pressure level is 3345. Before the price effectively breaks through and stabilizes at 3345, any rebound is a short-selling opportunity; once it stabilizes at 3345, the bottom pattern is confirmed to be established, and the bulls will start an upward market. At this time, the short-selling idea should be abandoned. From a technical point of view, the 1-hour chart has shown a trend from weak to strong, and the Bollinger Bands are opening and diverging upward, indicating that the market may accelerate upward. Today's operation suggestion is to focus on low-long and high-short as a supplement. In terms of specific points, the lower support is 3327-3320, and the upper resistance is 3355-3360.
Operation strategy:
1. It is recommended to buy gold when it rebounds to around 3327-3320, with the target at 3340-3350.
2. It is recommended to sell gold when it rebounds to around 3345-3355, with the target at 3330-3320.


Precision Over Emotion – XAUUSD 1H Supply Zone📉 Trade Breakdown:
Caught the first entry off a 1H supply zone which is on my previous post “Bait. Trigger. Collapse!” but price came back up, tagged my entry, and stopped me out at breakeven. No overreacting. No revenge. Just stayed patient and focused.
Now price is pushing back into a new 1H supply zone (📍3324–3330) with clean structure and confluences — setting up for a high-probability second shot at the play.
⸻
🔍 Key Confluences:
✅ Clean 1H Supply Zone: 3324–3330
✅ Still in bearish market structure — no bullish break
✅ Prior drop was impulsive, showing institutional rejection
✅ Current price action is slow and corrective on the pullback
✅ Zone aligns with previous imbalance and supply block = 🔥 smart money interest
⸻
🎯 Trade Setup:
Looking for confirmation entry inside the 3324–3330 zone.
Avoiding early entries — focused on sniper execution only.
⸻
📌 Execution Plan:
1. Wait for price to enter 3324–3330
→ No entry until price fully taps the zone
→ Be patient, no front-running
2. Watch for confirmation on the 5m–15m timeframe
→ Bearish engulfing
→ Long wick rejection
→ Break of structure or internal shift
3. Enter with tight stop above 3330
→ SL: ~5–8 pips above 3330 (depending on rejection)
→ TP1: 3305
→ TP2: 3284
→ TP3: Let runner breathe to 3270s if momentum is strong
4. Manage risk dynamically
→ Break even after 1:1
→ Trail below 15m highs once TP1 hits
→ No overexposure — this is a sniper play, not a lottery ticket
⸻
🧠 Mindset:
I already got stopped once — but I don’t fold.
Every setup either pays or teaches.
I don’t chase. I wait for price to earn my entry.
This time it’s cleaner. This time it’s patient.
And this time, it’s calculated.
“Trade Simple. Live Lavish.”

Technical analysis guide for gold in the US market!Technical aspects:
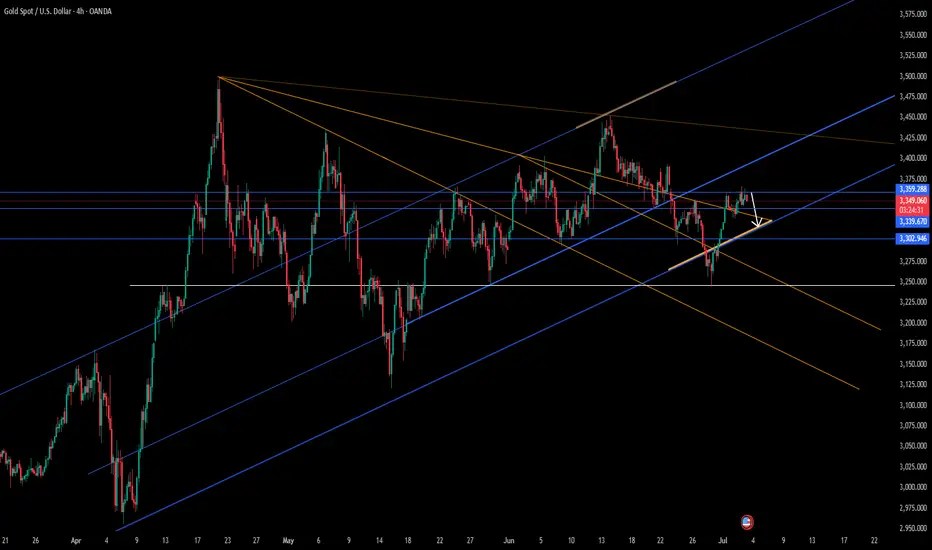
The gold daily chart shows an obvious shock consolidation structure, and is currently running between the middle and lower tracks of the Bollinger Bands, with an overall weak trend. Since hitting a high of $3499.83, the market has fallen into a sideways consolidation range, with top resistance concentrated in the $3400-3450 range and bottom support at $3250. The recent price retracement to around 3250 failed to effectively break below, forming an important support level.
The MACD indicator crossover continues, the green column is enlarged, the double lines are downward, and the momentum is weak. The RSI indicator runs around 44, and does not show oversold or rebound signals. The price is still in a weak consolidation stage. Analysts believe that if it falls below the 3250 line, it may open up further correction space, and pay attention to the 3170 area support; on the upside, if it can effectively stand above 3400, it is expected to retest the 3450 line high.

Gold Market Mitigates 3280 – Eyes on 3330 PullbackAfter sustaining its bearish sentiment, the gold market mitigates the 3280 zone, creating room for a potential pullback to 3330. Current price action suggests a shift in structure could be forming, anticipating a bullish correction in the short term.follow for more insights , comment and boost idea

Gold Expecting bullish Movement Price is currently showing strong momentum with visible rejections and key zone reactions. According to my analysis
First Resistance Zone: 3382.70
Second Resistance Zone: 3360.50
Support Zone: Around 3330.50
Yellow Arrow: Indicates possible early rejection and a move toward the support zone
Blue Arrow: Suggests price may bounce back from the 3330.50 support and retest upper zones
As long as price remains below the 3360.50 resistance zone, my bias remains bearish However, if price breaks above this level with strong volume, we may see bullish continuation
