GOLD hits resistance – usd strikes back!XAUUSD is charging into the "danger zone" around 3,375 – a level where bulls have fallen before.
But this time, gold faces a heavyweight opponent:
– The US economy is revving up like a race car: consumer demand is surging, jobless claims are dropping.
– The Fed holds its hawkish stance like a loaded weapon: high interest rates aren’t going away.
– The US dollar is back in full force, and bond yields are shooting sky-high.
While gold buyers try to climb higher, pressure from the “USD fortress” is building fast.
Every uptick in XAUUSD now… might just be a setup before the fall.
If selling pressure returns near the previous highs, another sharp drop in gold could be just around the corner.
CFDGOLD trade ideas

Xauusd and Gold moves down Market Bias: Structured Bullish (with Liquidity Grab)
Chart Date: July 18, 2025
---
🔎 1. Market Structure Analysis:
✅ CHoCH: Trend reversal confirmed near July 3, where lower highs broke and bulls gained control.
✅ BMS: Break of market structure confirms bullish control after price broke multiple internal lower highs.
🔁 Internal Liquidity Sweep: Price swept recent lows near 3330 to collect liquidity before moving up — classic smart money move.
🔼 Higher Lows (HL) forming after FVG fills, indicating strength.
---
🧱 2. Key Zones & Confluence:
🔹 Fair Value Gaps (FVGs):
✅ Bullish FVG at 3340–3345: recently tapped and respected → confirms institutional interest.
🔼 Unfilled FVG above 3360 → potential magnet for price.
🔹 EMAs:
2 dynamic EMAs (approx. 50 & 34): price cleanly broke above both and retested → bullish signal.
🔹 Support/Order Blocks:
Strong demand zone: 3322–3332 (where liquidity sweep occurred).
Hidden bullish OB under FVG, giving triple confluence (Structure + FVG + OB).
🔹 Resistance/Supply Zone:
Clean rejection zone around 3365–3368. Final TP or area to watch for reversal.
---
📊 3. Trade Setup: (Swing Trade – Smart Money Based)
🟢 Entry:
Ideal Entry Zone: 3342–3348
(Pullback into FVG + OB + EMA + bullish candle confirmation)
🔴 Stop Loss:
Below liquidity grab low: 3320 (well-protected SL below breaker block)
🎯 Take Profits:
TP1: 3360 (next minor resistance + FVG top)
TP2: 3368 (major supply zone)
TP3 (Optional Swing): 3382–3390 (if breakout confirms)
📈 Risk-Reward Ratio:
Minimum 1:3 — Excellent swing setup for pro traders
---
⚠️ 4. Risk Management & Notes:
Avoid trading during red folder news (USD-related events shown below).
If price closes below 3320 on 4H, re-evaluate bias.
Monitor 1H for confirmation entry: bullish engulfing or BOS + OB.
---
🧠 5. Pro Tips (TradingView Discipline):
Use alerts at 3345 and 3360.
Never revenge trade if SL hits. Reassess bias with structure shift.
Journaling this trade is important: track how FVG/CHOCH/BMS interact.

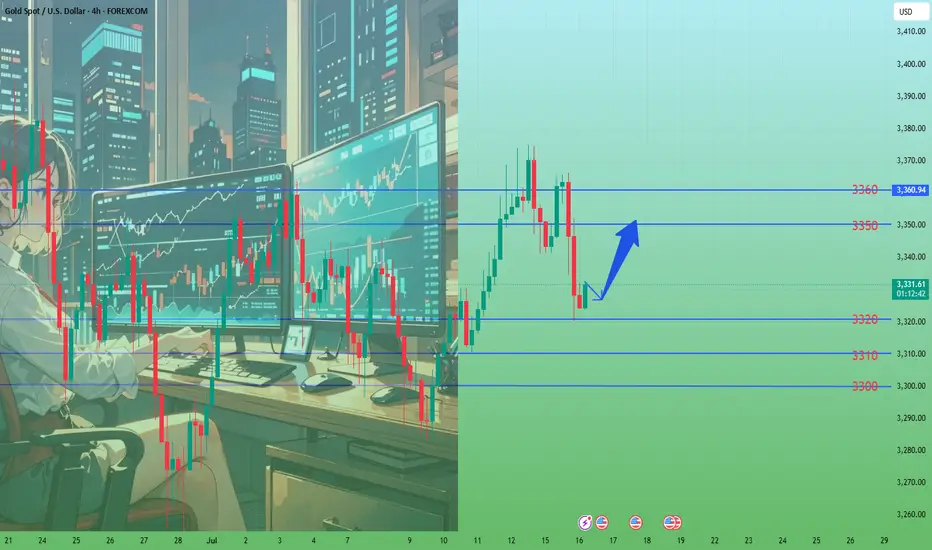
Xauusd and gold chart move bullish 📈 GOLD (XAUUSD) – 4H Technical Professional Idea Description
⚡️ Market Bias: Bullish Until Proven Otherwise
🧠 Idea Overview:
The current 4H structure on XAUUSD shows multiple Bullish CHoCH and BMS (Break of Market Structure) confirmations after price rejected from the previous supply zone. We are now trading above the 4H FVG zone and just reclaimed the mid-supply area with strength. This suggests a bullish continuation is likely as long as price holds above the current fair value gap and EMA confluence.
---
🔍 Key Observations:
1. Strong Bullish CHoCH + BMS Confirmations:
Multiple bullish CHoCHs confirm a shift in market structure from bearish to bullish.
A recent BMS shows higher highs being formed – clear bullish intent.
2. FVG Reclaim + Reaction:
Price aggressively filled and bounced from multiple bullish Fair Value Gaps (FVG).
Most recent FVG has held and price is pushing upward with momentum.
3. EMA Support Confluence:
EMA 20 and EMA 50 are providing dynamic support (Blue & Pink lines).
Price bounced directly off EMA and resumed upward momentum.
4. Liquidity Above Still Untapped:
Liquidity exists above 3362, 3369, and 3371 zones.
These are likely targets if bullish continuation persists.
5. Demand Zone Below Is Respected:
Strong reaction from the demand block around 3311–3322, validating buyer interest.
Until this zone breaks with high volume, bias remains bullish.
---
🎯 Trade Setup Idea (Hypothetical Example)
Entry Zone: Around 3345–3352 (pullback/retest to reclaimed FVG zone)
Stop Loss: Below 3332 (beneath last demand + structure invalidation)
Target 1: 3362
Target 2: 3369–3372 (liquidity sweep zone)
Target 3 (extended): 3395+ if momentum and macro fundamentals support continuation.
---
🔐 Risk Management Notes:
No entry if FVG fails and price closes below 3330 (Invalidation of bullish structure).
Watch for macro events (USD news marked on chart) before entry — High impact events can cause whipsaws.

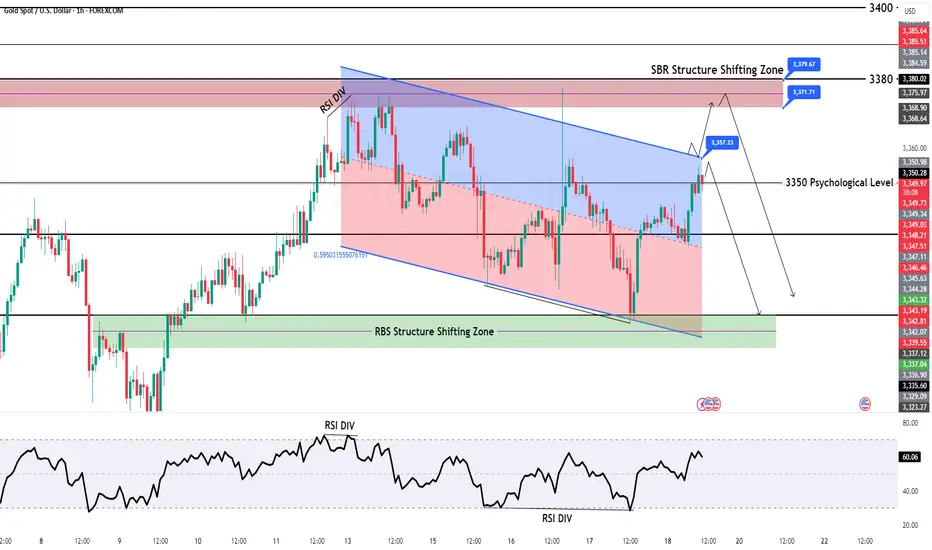
GOLD Intraday H1 Chart Update For 18 July 25Hello Trader, Today we have closing day
For now market is still in Bearish Channel range and try to sustains below 3350 Psychological Level
Further only market clear breakout of 3385 level then we will be on Bullish side other we are remains bearish for now
All eyes on Todays Closing
Disclaimer: Forex is Risky
XAUUSD Analysis todayHello traders, this is a complete multiple timeframe analysis of this pair. We see could find significant trading opportunities as per analysis upon price action confirmation we may take this trade. Smash the like button if you find value in this analysis and drop a comment if you have any questions or let me know which pair to cover in my next analysis.

gold on sell#XAUUSD await breakout below 3324 which holds sell continuation. Expected target is below 3305-3292.
Below 3324 will drop the price, target 3305-3292, stop loss 3337.
Fundamental can change price back to Bullish. So we watch closely.

July 17, 2025 - XAUUSD GOLD Analysis and Potential OpportunitySummary:
Although price pierced above 3375, it failed to hold. The market remains range-bound between 3320 and 3375 — treat it as a range for now, favoring shorts near the top and longs near the bottom. On a narrower view, 3358 is a key resistance — shorting near 3358 offers good risk-reward. Watch the strength of support around 3346. Stay flexible, respect key levels, follow the trend, and manage risk wisely.
🔍 Key Levels to Watch:
• 3393 – Resistance
• 3384 – Resistance
• 3375 – Top of range
• 3366 – Resistance
• 3358 – Resistance
• 3350 – Midpoint
• 3343 – Key support
• 3332–3336 – Support zone
• 3320 – Intraday key support / Bottom of range
• 3310 – Support
• 3300 – Psychological level
📈 Intraday Strategy:
• SELL if price breaks below 3346 → watch 3343, then 3336, 3332, 3325
• BUY if price holds above 3358 → target 3366, then 3370, 3377, 3384
👉 If you’d like to learn how I time my entries and place stop-losses, give this post a like — if enough people are interested, I’ll update this post to include more details soon!
Disclaimer: This is my personal opinion, not financial advice. Always trade with proper risk management.
Fake news stirs up the market, market trend analysis📰 News information:
1. Beige Book of Federal Reserve's economic situation
2. European and American tariff trade negotiations
📈 Technical Analysis:
Today, our overall trading can be said to have accurately grasped the trading points, and both long and short positions have earned us good profits.The gold market surged due to Trump's intention to fire Powell. Trump then denied the plan, which dissipated the risk aversion in the gold market and the overall rhythm fell back to a volatile pattern. The current market price of gold closed with a long upper shadow line, indicating that there is a certain need for adjustment in the market. Although the news stimulus has pushed it up to 3377, we need to be vigilant against the risk of a decline after a high rise. Pay attention to today's closing. If it closes below 3345, the bearish trend may continue in the future.
OANDA:XAUUSD PEPPERSTONE:XAUUSD FOREXCOM:XAUUSD FX:XAUUSD OANDA:XAUUSD FXOPEN:XAUUSD


Gold market trend analysis and exclusive analysis.Analysis of the latest gold market trends:
Analysis of gold news: The U.S. Department of Labor released the much-anticipated June Consumer Price Index (CPI) data at 20:30 Beijing time. After the CPI data was released, the financial market responded quickly, showing investors' recalibration of inflation data and monetary policy expectations. The U.S. dollar index (DXY) fell 16 points in the short term after the data was released, reflecting the market's interpretation of the core CPI being slightly lower than expected, which was dovish. The gold market reacted particularly sensitively. The core CPI was lower than expected, pushing spot gold up by $6 in the short term, indicating a brief rebound in safe-haven demand. In the short term, the probability of the Federal Reserve keeping interest rates unchanged in July is close to 100%, but the mild performance of the core CPI reserves the possibility of a rate cut in September or earlier. The market needs to pay close attention to subsequent data, especially the July CPI and PCE price index, to determine whether inflation will continue to rise.
Gold technical analysis: This week's upward breakthrough of 3375 further bullish on the 3400 mark; the daily average line diverges upward to support bulls, and bullish on bullish gains. However, if you want to rise, you must exert your strength today, otherwise the bulls may end at any time! The current support level is near the daily MA5 and the middle track. The next step is still the focus. If you want to rise, you can't go down here. Going down means continuing to sweep back to 3320 and 3300. Today's European session also broke high without continuation, and the US session formed a retracement to test the MA5 support level. As long as the middle track is not lost, the short-term will continue to touch the high, so the operation is very clear. In the short term, the short-term will rely on the support of the middle track to see a rebound, and the upper resistance is 3665-3375. The daily Bollinger Bands continue to close. If the upper 3375 is not broken, do not chase the high position, and beware of high-level selling. On the whole, today's short-term operation of gold recommends that the callback is mainly long, and the rebound is supplemented. The upper short-term focus is on the 3350-3360 line resistance, and the lower short-term focus is on the 3320-3310 line support.
GOLD - SHORT TO $2,800 (1H UPDATE)Gold sells are running in amazing profits! Price is now down 320 PIPS in profit from our entry at $3,353, within the Gold Fund for my investors.
Let me know how many of you are currently in this trade🤝

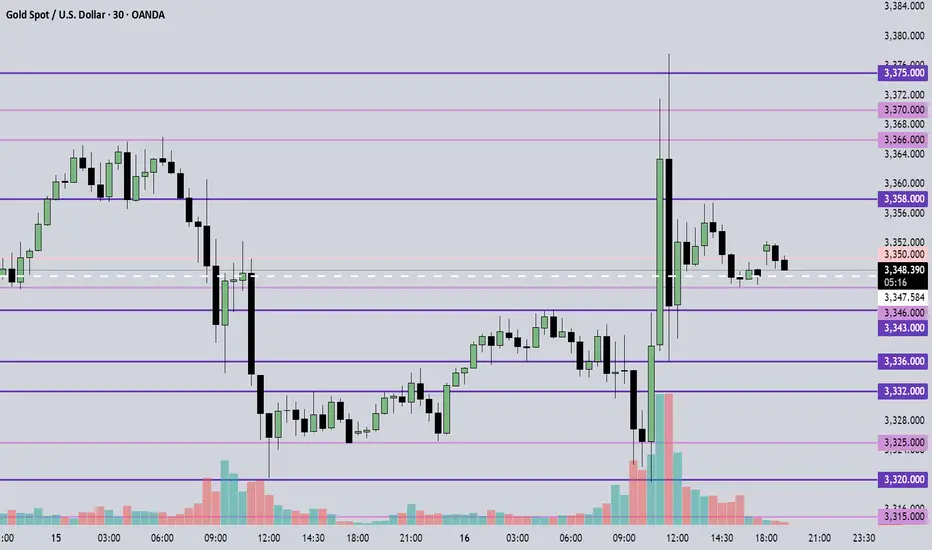
XAUUSD BEARISH CONTINUATION SETUP📉 XAUUSD – Bearish Continuation Setup
Timeframe: 30m | Bias: Bearish
Price failed to hold above the lower supply zone (highlighted red) after a strong move into resistance. A clear break of structure confirms sellers are in control.
🔹 Entry: 3,355–3,360 (after minor pullback into supply zone)
🔹 Stop Loss (SL): Above 3,365 (invalidation above zone)
🔹 Take Profit (TP):
▫️TP1: 3,330
▫️TP2: 3,315
▫️TP3: 3,300 (if bearish momentum continues)
📌 Structure shift + rejection from supply zone gives high-probability short setup. Wait for price confirmation before entry.

XAUUSD DOUBLE TOP AND HL REACTION ZONE 📉 XAUUSD – Double Top & HL Reaction Zone
Gold formed a potential double top pattern near the 3375 resistance zone, followed by a strong BMS and consecutive CHoCHs, signaling bearish pressure. However, price has respected the higher low (HL) structure near the 200 EMA, keeping the bullish structure intact for now.
We are currently in a key reaction zone.
If this HL holds and bullish intent appears, price may attempt another move toward the previous high.
If the HL breaks, a deeper correction could be in play toward 3327 or lower.
📌 Watch for:
Confirmation around 3350 zone
AND TP ZONE 3330 AROUND
HL reaction or breakdown

Xauusd longGold hit be and we booked +90 pips of 80% our position and it's again in our buy zone .
So long now .

Gold Analysis and Trading Strategy | July 14✅Gold opened with a gap up today, indicating a strong bullish trend, with the current price around 3370. After reaching a high of 3374 in the early session, gold is still consolidating at these high levels, awaiting buying pressure. Due to the gap up and subsequent rise, the short-term trend is likely to experience a gap fill. Additionally, considering the rapid rise, if a drop occurs during the European session, a pullback may follow. The upward curve is smooth, and the bullish momentum is strong, with the market still dominated by bulls. Therefore, today we should focus on strong support levels for buying opportunities, with the key entry point being around 3345-3350.
✅On the 1-hour chart, the moving averages continue to show a golden cross, indicating a bullish arrangement. In a strong market, a series of consecutive bearish candles can damage the upward pattern, while too many bullish candles can disrupt a downtrend. Therefore, attention must be paid to the strength of the candlestick patterns today. The current support level is near 3350, with further support at 3345. For the price to maintain this bullish trend, it should not fall below 3345 today. If gold retraces to 3350, it remains a buying opportunity.
🔴 Key Resistance Levels : The short-term resistance is in the range of 3392-3400. If this area is broken, gold could continue to rise.
🟢 Key Support Levels: Key support is at 3350, with further support at 3345.
✅ Trading Strategy Reference:
🔻 Short Position Strategy:
🔰When gold rebounds to around 3392-3395, consider selling in parts, with a stop loss of 8-10$ and a target of 3370-3360. If this level is broken, the next target would be 3350.
🔺 Long Position Strategy:
🔰When gold pulls back to around 3345-3350, consider buying in parts, with a stop loss of 10 points and a target of 3365-3385. If the price breaks through, the next target would be 3395.
🔥Trading Reminder: Trading strategies are time-sensitive, and market conditions can change rapidly. Please adjust your trading plan based on real-time market conditions. If you have any questions or need one-on-one guidance, feel free to contact me.

D1, chart analysis.
Gold is currently ranging within a horizontal consolidation zone.
The price is oscillating between the support at ~$3,172–$3,344 and resistance at ~$3,415–$3,500.
A pullback zone is identified near $3,344–$3,346, aligning with prior minor structure and the Fibonacci 0.618 level.
These levels suggest the retracement may be over, and price could be prepping for a new push.

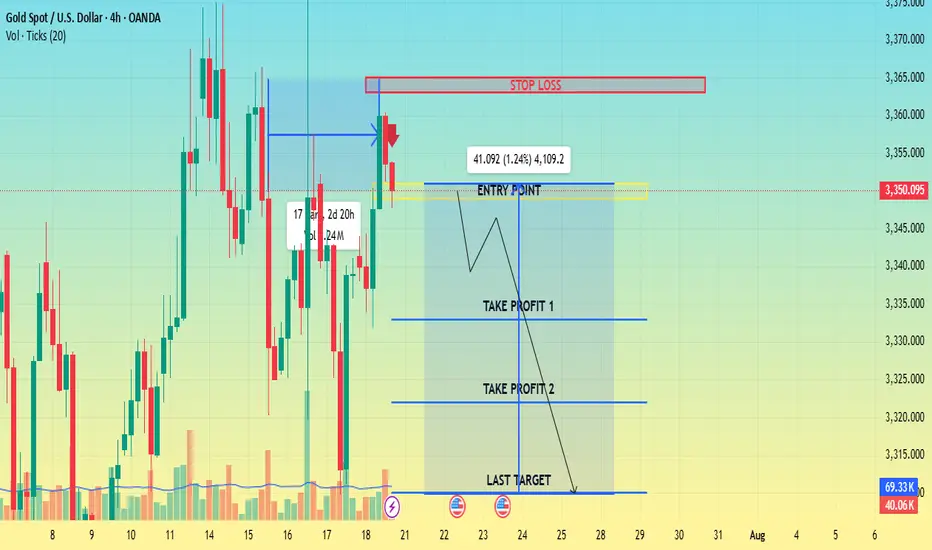
Sell long!!!!!I'm looking at a long term sell in respect of the 4hr order, If gold has to tap in into it. It will definitely reach the relatively equal lows.

CHECK XAUUSD SIGNAL READ CAPTAIN
Entry Point: Around 3351.000 3349.000
Stop Loss: Around 3365.000
🎯 Target Levels
Take Profit 1:
3333.000
Take Profit 2:
3322.000
last target
3310.000
Gold Weekly Summary and Forecast 7/19/2025Gold has been very choppy these two weeks. As the 2W closes, the falling line indicated in the 2W chart still interacts. As long as this line is not broken, gold could retrace further.
In weekly chart on the right, we are seeing a head and shoulder pattern has been formed. And the rejection level is aligning with 61.8% Fibo level retracement.
From the above two analysis, I am expecting gold to drop heavily next week to at least 3250 or even 3192.
Let's enjoy the weekend and I will come back with intraday analysis every day next week.

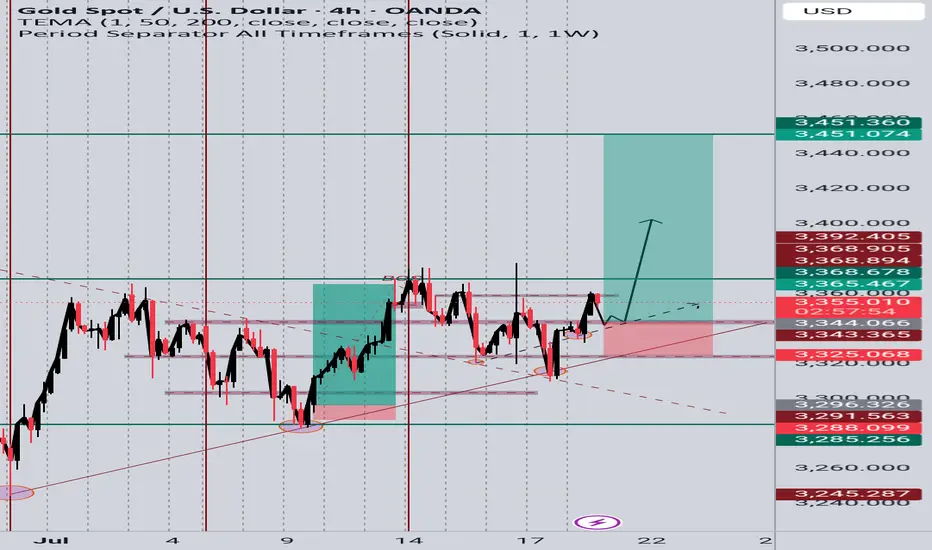
GOLD (XAUUSD) Long Idea – Breakout Confirmation📆 Timeframe: 4H
📈 Type: Long (Buy)
🎯 Entry: Around 3348-3355
🎯 Target: 3451
NOTE: Price has respected the ascending trendline from early July.
Clean breakout from a consolidation range after several rejections near 3365 resistance.
Bullish structure confirmed with higher lows and higher highs.
Fibonacci levels and support zone at ~3344 are holding strong.
Targets set at prior resistance zone (~3451), aligning with liquidity zone.
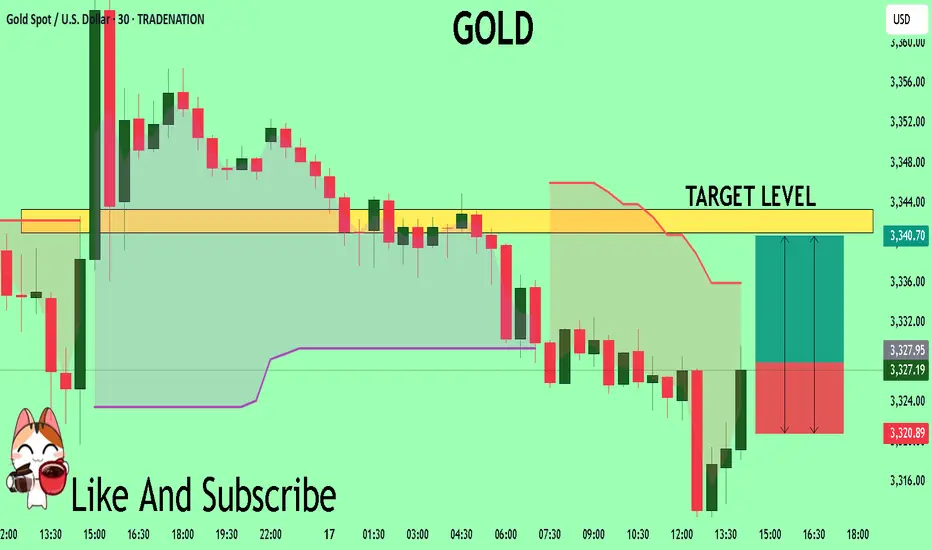
GOLD What Next? BUY!
My dear friends,
GOLD looks like it will make a good move, and here are the details:
The market is trading on 3328.1 pivot level.
Bias - Bullish
Technical Indicators: Supper Trend generates a clear long signal while Pivot Point HL is currently determining the overall Bullish trend of the market.
Goal - 3340.9
Recommended Stop Loss - 3320.8
About Used Indicators:
Pivot points are a great way to identify areas of support and resistance, but they work best when combined with other kinds of technical analysis
Disclosure: I am part of Trade Nation's Influencer program and receive a monthly fee for using their TradingView charts in my analysis.
———————————
WISH YOU ALL LUCK
XAUUSD Sell Setup "XAUUSD Sell Setup 📉
Price rejected strongly from the descending trendline resistance.
Bearish momentum still active below 3345 zone.
Selling from this level targeting 3311 with tight SL above 3358.
Trade safe & stick to your plan! 💪✨

gold heading back to retest 3450gold heading back to retest 3450
so what happened to gold yesterday?
unemployment claims suppose to be that USD is strong however after the news effect the bull run started again.
technical basis is that H4 last structure was broken up and the day before happens to be a spike from 3320 to 3377. which indicate there are buyers in the market only that we will be caught off-guard most of the time. likewise yesterday. new gave a technical that m30/h1 broke down of current market structure whereby 3326-3328 was suppose to be a support before becomes resistance but bull came in with surprise again pushes price to break even 3341 resistance.
after analyzing no wonder as fibo golden ratio is sitting at 3310 and that was a good point of interest to buy and hold for 1st destination would be at 3365-3378 and 3414-3427 and lastly to retest 3450 as well as weekly broke trendline to see if there's true seller to push price for a proper correction of the year or back to ATH which usually new ATH happens in July often for the past 5years.
