D1, chart analysis.
Gold is currently ranging within a horizontal consolidation zone.
The price is oscillating between the support at ~$3,172–$3,344 and resistance at ~$3,415–$3,500.
A pullback zone is identified near $3,344–$3,346, aligning with prior minor structure and the Fibonacci 0.618 level.
These levels suggest the retracement may be over, and price could be prepping for a new push.
CFDGOLD trade ideas

Sell long!!!!!I'm looking at a long term sell in respect of the 4hr order, If gold has to tap in into it. It will definitely reach the relatively equal lows.

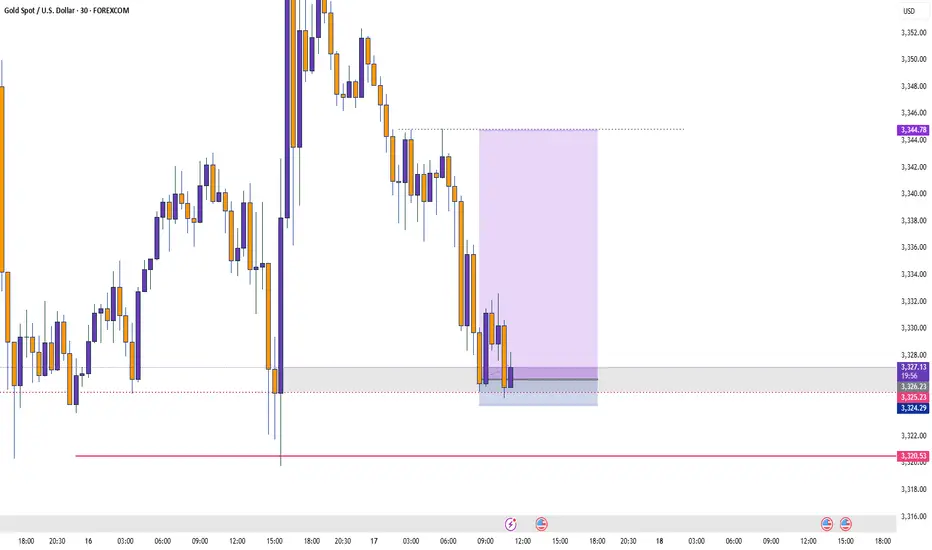
XAU/USD BULLISH SETUPPrice has cleared previous support zone, however we see a retracement into the 30min internal PFL zone where we expect price to bounce back to the higher timeframe bullish momentum as correction has likely ended.

Gold Weekly Summary and Forecast 7/19/2025Gold has been very choppy these two weeks. As the 2W closes, the falling line indicated in the 2W chart still interacts. As long as this line is not broken, gold could retrace further.
In weekly chart on the right, we are seeing a head and shoulder pattern has been formed. And the rejection level is aligning with 61.8% Fibo level retracement.
From the above two analysis, I am expecting gold to drop heavily next week to at least 3250 or even 3192.
Let's enjoy the weekend and I will come back with intraday analysis every day next week.

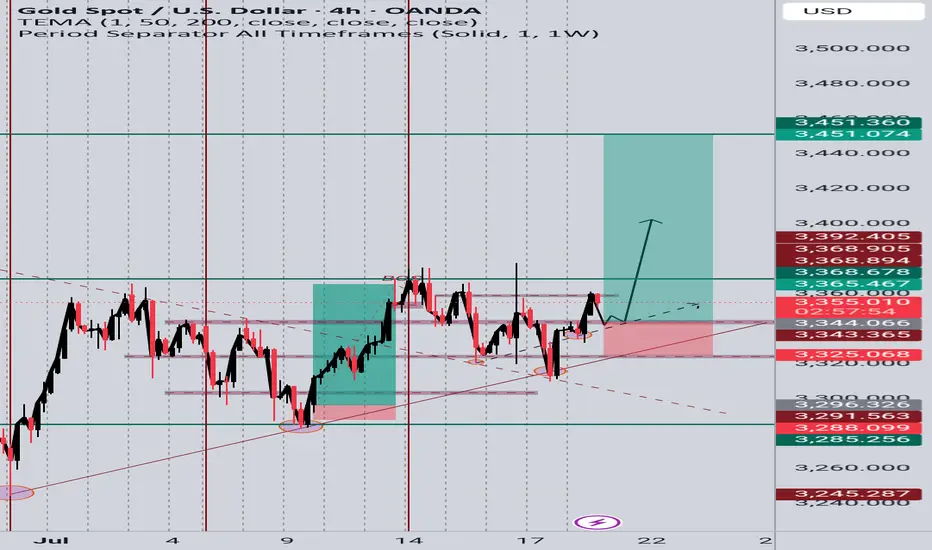
GOLD (XAUUSD) Long Idea – Breakout Confirmation📆 Timeframe: 4H
📈 Type: Long (Buy)
🎯 Entry: Around 3348-3355
🎯 Target: 3451
NOTE: Price has respected the ascending trendline from early July.
Clean breakout from a consolidation range after several rejections near 3365 resistance.
Bullish structure confirmed with higher lows and higher highs.
Fibonacci levels and support zone at ~3344 are holding strong.
Targets set at prior resistance zone (~3451), aligning with liquidity zone.
XAUUSD Sell Setup "XAUUSD Sell Setup 📉
Price rejected strongly from the descending trendline resistance.
Bearish momentum still active below 3345 zone.
Selling from this level targeting 3311 with tight SL above 3358.
Trade safe & stick to your plan! 💪✨

BuyRejection Level
Daily Volume
Market Structure Shift
London Session
Trend Line Break
Untapped Order Point
Post CPI analysisHello traders here is my post CPI analysis. Thankyou very much, I shall update from time to time in the notes.

Is Gold Preparing for a Breakout — or a Trap? 🟡 Is Gold Preparing for a Breakout — or a Trap? Let’s break down the latest market data 👇
⸻
🟥 1. U.S. Inflation News (PPI & Core PPI)
Report Previous Forecast Actual
Monthly PPI 0.1% 0.2% 0.0%
Core PPI 0.1% 0.2% 0.0%
📉 Result: Very bearish for the U.S. dollar
→ Inflation is cooling
→ Fed may pause rate hikes
→ Interest rates could stabilize or drop
→ And gold loves that kind of setup 😍
⸻
🟫 2. U.S. Crude Oil Inventory Report
Report Previous Forecast Actual
Crude Oil Inventories +7.07M –1.80M –3.85M
🟢 Result: Very bullish for oil
→ Energy demand is higher than expected
→ Inflation could creep back up due to rising oil prices
→ That makes investors run to gold as a hedge against inflation 🔥
⸻
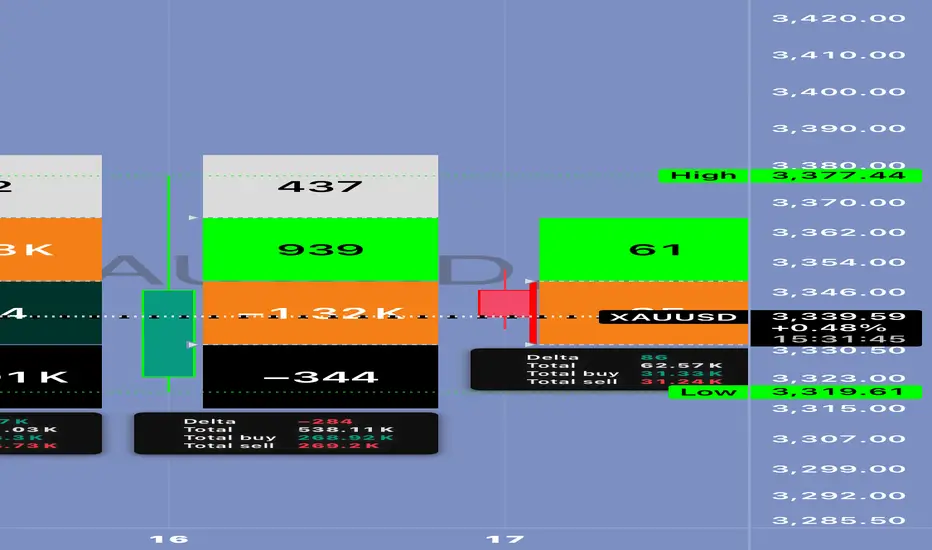
🧠 Technical & Market Outlook for XAU/USD:
📈 Gold pushed from $3,319 to $3,377
↩️ Now it’s in a pullback, testing Fibonacci levels:
• 38% retracement near $3,350
• 61% retracement near $3,339
📉 But… these pullbacks are happening with positive delta and absorption → which signals smart buying from below 👀
✅ Additional signs:
• VWAP is stable
• Volume is holding around the POC
• And macro data is clearly supporting upside momentum
⸻
🎯 Trading Plan:
• ✅ Entry Zones: $3,350 or $3,339
• 🛑 Stop Loss: Below $3,319 (recent low)
• 🎯 TP1: $3,377
• 🎯 TP2: $3,392 – $3,400
• ⚠️ Watch for a breakout above $3,377 with strong volume — that would confirm the real move.
⸻
🔄 Summary:
💥 Two major news events today are supporting gold:
1. Weak PPI = possible pause in rate hikes
2. Rising oil = renewed inflation risk
So gold is getting support from both angles.
But stay cautious — any surprise statement from the Fed or a sudden USD rally could change the game
Gold Market Eyes 3330's as Bullish Wedge MaturesGold market maintains its stance within the bullish build-up, moving in alignment with a wedge completion structure. The 3360's act as short-term resistance, while price looks set to mitigate and sweep pending orders at 3330's. A potential retracement before continuation—stay sharp.
follow for more insights , comment and boost idea


GOLD BUY SETUP • Premium Zone Rejection:
• Price has tapped into a higher-timeframe supply zone (~3,380–3,400), showing early signs of exhaustion.
• Bearish reaction here is consistent with smart money offloading positions.
• Equal Highs Liquidity Sweep:
• A sweep of engineered highs (₤₤₤) before the drop hints at a classic liquidity grab, possibly triggering sell-side momentum.
• Anticipated Pullback:
• Expecting a corrective move toward the demand zone (around 3,285–3,310), aligning with discounted entry pricing for long setups.
• Bullish Continuation Potential:
• If price respects the demand zone and forms a higher low, a bullish continuation toward new highs is likely.


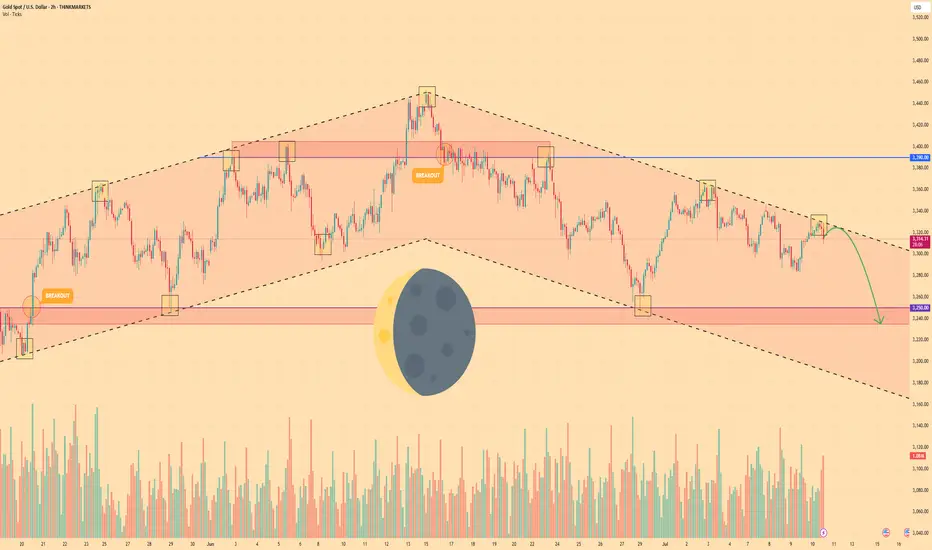
GOLD - Price can bounce down from resistance line of channelHi guys, this is my overview for XAUUSD, feel free to check it and write your feedback in comments👊
Gold broke out of its long-term rising channel and hit $3390 resistance level before momentum definitively stalled.
That failure marked a shift in control, as sellers forced price into a falling channel, establishing lower highs and lower lows.
Price fell to support level, after whcih it turned around and bounced up to resistance line of falling channel.
Now, Gold tests the upper boundary of the falling channel near $3318, where each bounce has been capped by declining volume.
Key support lies in the $3250 - $3235 area, aligned with multiple prior demand tests and the former rising-channel floor.
I expect Gold to reverse from the channel resistance and slide toward $3235, decisively breaking below the $3250 level.
If this post is useful to you, you can support me with like/boost and advice in comments❤️
Disclaimer: As part of ThinkMarkets’ Influencer Program, I am sponsored to share and publish their charts in my analysis.
THE KOG REPORT - UpdateEnd of day update from us here at KOG:
Today was another choppy day on gold with price accumulating in a small range before the break out. We had the bullish above and bearish below level so no choice but to wait for the break. Ultimately, 3320 broke on the 15min indi and then we managed to complete all of our bearish targets for the day. Well worth the wait!
Now we have support below at the 3285 level with resistance sitting at 3310 which is the level that will need to hold us down to target lower. Lower first, which would be ideal, we may get a RIP over the session to come.
RED BOX TARGETS:
Break above 3350 for 3355, 3360, 3362, 3365, 3374, 3388 and 3396 in extension of the move
Break below 3335 for 3331✅, 3324✅, 3321✅, 3310✅, 3306✅ and 3293✅ in extension of the move
Todays levels from Camelot:
Price: 3324
RED BOXES:
Break above 3336 for 3340, 3346, 3350 and 3360 in extension of the move
Break below 3320 for 3310✅, 3306✅, 3304✅ and 3297✅ in extension of the move
As always, trade safe.
KOG

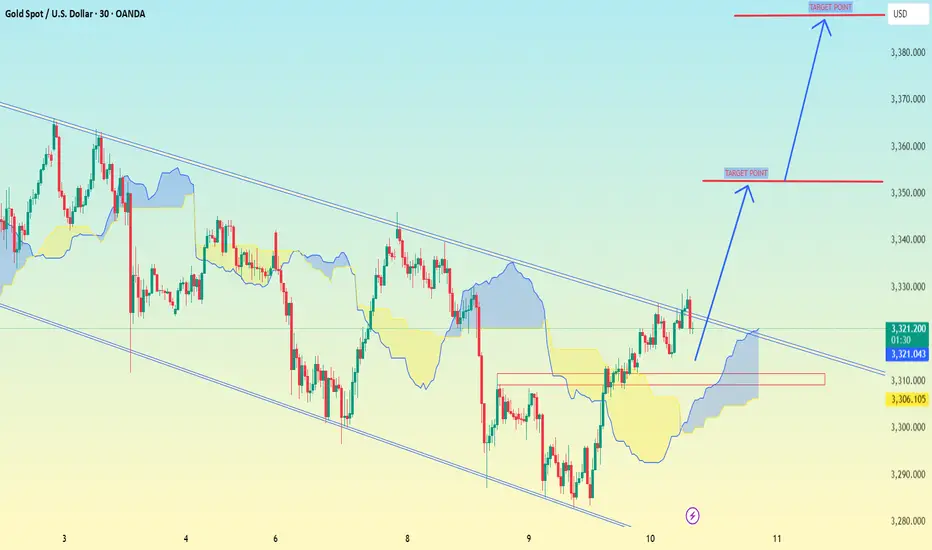
XAUUSD (Gold Spot / U.S. Dollar) on the 30-minute timeframe.XAUUSD (Gold Spot / U.S. Dollar) on the 30-minute timeframe,
📈 Key Observations:
The price has broken out of a descending channel to the upside.
There is Ichimoku Cloud support below the breakout, indicating potential bullish momentum.
Two bullish target levels are marked with arrows and horizontal red lines.
🎯 Target Levels:
1. First Target (TP1): Around 3,350.000
2. Second Target (TP2): Around 3,390.000
These targets are based on the visual structure and the projected breakout move.
🛡 Support Zone (Possible Stop-Loss):
Near the 3,300.000 level — this is the last consolidation area before the breakout, and it's also aligned with the lower Ichimoku Cloud boundary.
---
⚠ Note:
Always manage your risk and consider fundamentals or major news events, especially with commodities like gold.
GOLD at support Gold price has reached the support level from where price has pulled up several time and price will soon may go up. Liq grab. SL3300.
Gold CPI shocks and fallsThe hourly chart shows that the gold price fluctuated and consolidated at the bottom after a continuous correction, continuing the rebound trend. The key pressure level is the top and bottom conversion position. The current gold rebound is only a secondary confirmation of the top structure at the 30-minute level. After reaching 3365, the short-term has shown signs of pressure. In the volatile market, if the price begins to consolidate horizontally, it may indicate the end of this round of volatile upward trend, and it will enter a downward phase later. Considering the market sensitivity before the release of CPI data, it is recommended to focus on the volatile decline trend. After today's rebound, it is necessary to focus on the 3363-3368 area as a short-selling range, and the long and short defense position is set at yesterday's intraday high of 3375. In terms of operation, it is recommended to maintain the idea of rebounding and shorting, and pay attention to the 3340-3335 range for support below.
Operation strategy:
1. It is recommended to short gold near the rebound of 3363-3368, with a stop loss at 3375 and a target of 3350-3340.

THE LONG SHOT 〉POTENTIAL OUTLOOKAs illustrated, I'm trying to visualize how a potential continuation impulse could look like during " Bullish July " and toward the end of the year (depending on how aggressive buyers step in; specially central banks and institutions).
As you can see on this Daily chart, price respected a long term trend line + is forming higher lows, funneling into a shorter and shorter range of accumulation.
This is a very strong bullish behavior; when price gets tighter and tighter respecting a resistance level, but making higher lows. It tends to indicate that price is accumulating and "loading" (sort of speak).
Now, analyzing gold from the fundamental aspect, one MUST align those factors with price. In other words: DOES IT MAKE SENSE TO BE BULLISH OR "THINK" PRICE COULD RISE?
Well, ask yourself and do the research on the following (but not limited to) questions:
1. How is the US dollar doing? (Since it is the world's "reserve" currency)
2. Are the interest rates in the USA favoring the economy?
3. How is the world economy as a whole doing?
- inflation in the top world powers and important economies?
4. How is international trade policy looking like for the world?
- Positive or negative? Are countries happy with each other currently, trading without any issues? (Or maybe... there's a tariff war and a trade war goin on?...)
5. Politically speaking, is the general public UNITED or POLARIZED? (politics is a key fundamental aspect for the price of gold, as it either adds to uncertainty and tensions, or it calms things down).
6. Geopolitically speaking (and most importantly); is the "conflict" (war) ending, getting better, resolving? ...
7. Where is the money going and flowing? Black rock, vanguard, and other top hedge funds; where are they investing their money? ( because central banks keep BUYING gold... )
Those are some of many many questions one must study and understand, in order to align the technical aspects of the price of the yellow metal.
If any question/factor DOES NOT POINT to bullishness in price, then the technical and price projection of any analysis starts to have weakness.
On the other hand, if the fundamental factors and questions in play INDEED POINT toward an uncertain situation, adding bullishness to the price, any analysis and bullish projection simply has those aspects to its favor.
--
GOOD LUCK!
persaxu

Gold begins bullish recoveryGold posted a slight gain during Monday's Asian session, driven by renewed safe-haven demand amid escalating trade tensions between the United States and several key economies, as well as rising geopolitical uncertainty surrounding Russia and Ukraine.
The initial uptick in gold was supported by the announcement of 30% tariffs by Donald Trump on Mexico and the European Union, in addition to harsher levies on Japan, South Korea, and Brazil. The prospect of a renewed wave of protectionism has raised concerns over global economic stability, boosting gold's appeal as a safe-haven asset. Added to this is geopolitical tension following reports that Trump is planning to send offensive weapons to Ukraine, potentially escalating the conflict with Russia. These factors have reinforced risk-off sentiment in the markets.
However, the strength of the US dollar (DXY +0.1%) and anticipation ahead of the US CPI data, due Tuesday, are capping gold’s upside. Higher-than-expected inflation could reinforce expectations of a tighter monetary policy from the Federal Reserve, which would weigh on precious metals.
After reaching an intraday high of $3,361.42 per ounce, the Asian market closed lower, leaving gold at $3,356.66 per ounce, a level at which it has since consolidated ahead of the European open. This behavior reflects a technical pause in the initial bullish momentum, with the current point of control aligning with that same price zone, suggesting a temporary neutralization of buying pressure. The RSI at 54% confirms a lack of strength, while the MACD indicates a potential upward directional shift with a signal line crossover and a modestly green histogram to start the week. Moving average crossovers show the 50 and 100 SMAs supporting the bullish push that began last Wednesday. Gold’s next decisive move may depend on upcoming US inflation data and developments in geopolitical tensions.
Silver, meanwhile, stood out with a sharp 1.4% surge to $39.493 per ounce, its highest level since 2011, while platinum and copper delivered mixed performances.
This week, gold prices could be driven by the confirmation of elevated US inflation data, which would strengthen the metal's role as a hedge against purchasing power loss, especially if doubts persist regarding the Fed’s policy stance. Added to this are rising geopolitical tensions due to Trump’s potential delivery of offensive weapons to Ukraine, further protectionist measures that could worsen the global trade war, and increased risk aversion should equity markets react negatively. In this context, gold is positioned as one of the main beneficiaries amid growing economic and political uncertainty.

Gold Possible Retest of $3,365 Before Downside MoveGold is currently trading around $3,335, approaching a critical resistance level at $3,365, which has been marked as a “Main Resistance” on the chart. The recent price movement shows a strong bullish rebound from the $3,293–$3,300 support zone, breaking above two key trendlines labeled "Breakout."
The chart suggests a potential “retest” of the $3,365 resistance before another downward move, as marked by the annotation "Possible Retest and Then Down." This idea is reinforced by the broader descending channel pattern visible from late June, indicating that the larger structure still favors bearish continuation unless a strong breakout occurs above $3,365.
⚠️ Bearish Confluence
Price is inside a corrective channel, repeatedly failing to sustain above prior highs
$3,365 has held firm multiple times as resistance — a strong horizontal and trendline convergence zone
Price is still well below the swing high at $3,392
🟩 Bullish Scenario (If Invalidation Occurs)
If price breaks and closes above $3,365, it would invalidate the current bearish structure and open the door for upside targets like:
$3,392 (previous high)
$3,412
Possibly $3,434, which is a longer-term diagonal trendline resistance
At present, gold is in a corrective upward move within a broader bearish channel. The zone between $3,337–$3,365 will be key. A bearish rejection here would confirm downside continuation, with price potentially targeting $3,265–$3,220. However, a bullish breakout above $3,365 could invalidate the bearish view and suggest strength returning toward $3,392 and above.
Note
Please risk management in trading is a Key so use your money accordingly. If you like the idea then please like and boost. Thank you and Good Luck!

X1: GOLD/XAUUSD Long Trades Risking 1% to make 1.68%OANDA:XAUUSD / TVC:GOLD Long Trade, with my back testing of this strategy, it hits multiple possible take profits, manage your position accordingly.
Risking 1% to make 1.68%
Note: Manage your risk yourself, its risky trade, see how much your can risk yourself on this trade.
Use proper risk management
Looks like good trade.
Lets monitor.
Use proper risk management.
Disclaimer: only idea, not advice

How to find solid trading opportunities amid gold volatility?Gold opened at around 3338, and then fluctuated and fell after reaching the highest point of 3344. The 3313 long orders that were publicly deployed yesterday reached the target range of 3327-3330 as expected and stopped profit smoothly. Although the overall trend is weak, it has never effectively left the range, and the typical bottoming rebound structure is still an important basis for the low-multiple thinking. The market rose to around 3340 in the short term and then fell again. The overall operation fluctuated and consolidated below 3340, and failed to reach the expected short order entry position, and maintained fluctuations until the close.
At present, gold is still in the range of fluctuations. Although the hourly line has some fluctuations, there is no obvious directional breakthrough, and it is more of a consolidation and accumulation state. The upper short-term suppression focuses on the 3345-3355 line, which is the current primary resistance area; the lower support focuses on the 3325-3315 area, and the judgment of the long and short key nodes is maintained. The daily structure shows a yin-yang staggered pattern. The market sentiment is cautious and the long and short forces are relatively balanced. Before an effective breakthrough is formed, the operation should be based on support and pressure points to avoid chasing ups and downs and do a good job of risk control.
Operation suggestions are as follows:
1. Go long near 3325-3315, with a target of 3340-3345.
2. Go short near 3345-3355, with a target of 3325-3320.
Today is Friday, and it is recommended to respond steadily, focusing on the competition for key support and resistance areas. I will prompt more real-time strategies and entry points at the bottom, remember to pay attention to it as soon as possible.
