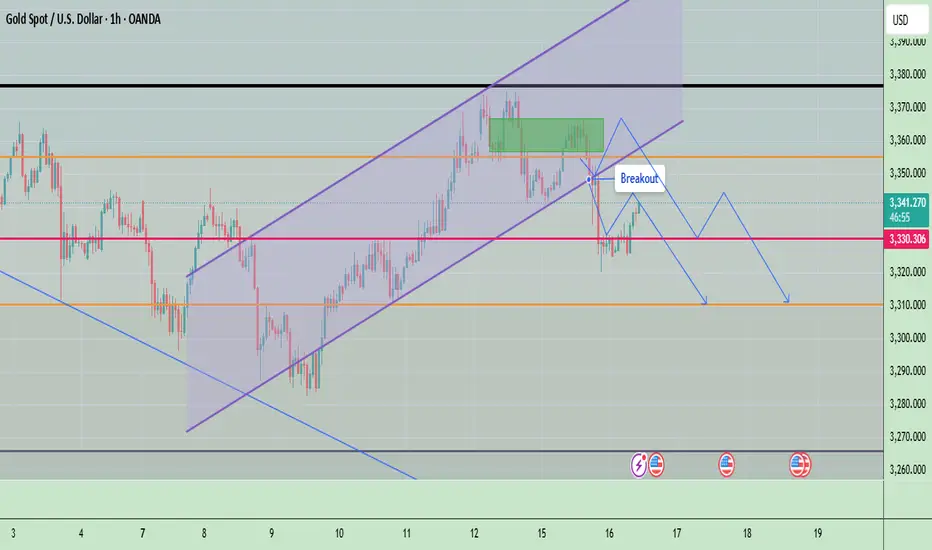
Gold Rejected Post-CPI – Bearish Momentum Building Below $3,365Gold is currently trading near $3,338, continuing to show signs of rejection after testing the key $3,365–$3,392 resistance zone. The market has reacted to the July 15 U.S. CPI release, and despite initial volatility, gold failed to break above its major diagonal trendline, forming a lower high, a strong technical sign of weakening bullish momentum.
If price breaks below $3,330, it could trigger a wave of selling pressure down to $3,303 and $3,248 in the coming days. Traders should monitor price behavior around these zones for short-term entry opportunities.
📌 Technical Breakdown
Resistance Zone:
- $3,365–$3,392 remains the critical ceiling where gold got rejected for the third time in recent sessions.
- This zone aligns with the top of the descending wedge, long-term black trendline.
Bearish Structure Forming:
- After multiple attempts, gold could not sustain above the resistance.
- A series of lower highs and a weakening bullish push suggest a bearish continuation is likely.
Support Levels to Watch:
- Immediate: $3,337
- Mid: $3,320
- Strong: $3,303 (0.382 Fib) and $3,293
- Final Target: $3,248 → $3,220 → $3,193
🔺 Bullish Invalidation Scenario
If gold manages a clean breakout and close above $3,392, this bearish setup will be invalidated. In that case, upside targets would include:
- $3,412
- $3,434
- $3,490 (macro trendline)
But at the moment, that seems unlikely unless driven by unexpected fundamentals.
Note
Please risk management in trading is a Key so use your money accordingly. If you like the idea then please like and boost. Thank you and Good Luck!
CFDGOLD trade ideas
The high probability intraday trading strategy for gold is here!After gold fell below 3341 yesterday, the highest point of the rebound was around 3350-52. Today, we are long at 3320-25, and the target of 3340-45 has been reached. We continue to pay attention to the short-term suppression of 3340-45, but the overall rebound strength is limited. The 3340-45 point fell back several times last Friday, and it is now broken again. Therefore, we can participate in the short position at 3340-3345 in advance. Gold rebounded at 3322 today. Technically, it needs to rebound and repair when it falls back to 3316-20, so we can look for opportunities to go long below to seize the profit space of the rebound.
From the 4-hour analysis, the short-term pressure above is around 3340-3345, and the current focus is on the support of the middle track 3310 at the hourly level. If the gold price can effectively hold the 3310 area, it is expected to bottom out and rebound and test the intraday high, but the upper rail resistance of the 3345 channel is strong, and it may still fall under pressure when it is touched, and the range shock judgment will be maintained at that time. In terms of operation, if you hold this support, you can consider light positions to try short-term longs, and pay attention to the short-term support of 3320-3315 below. Relying on this range to maintain the main tone of high-altitude low-multiple cycles during the day, the middle position is always more watchful and less active, cautiously chasing orders, and patiently waiting for key points to enter the market. I will prompt more specific operation strategies at the bottom, and pay attention in time.
Gold operation strategy: Gold falls back to the 3322-3317 line to go long, the target is 3335-40 line, and continue to hold if it breaks.

3325–3315: Potential Bullish Reversal ZoneGold maintained a volatile trend today, but the highest intraday price only touched 3343. Overall, gold is still weak, but the bulls have not completely given up, and there is still a certain amount of energy, which limits the retracement space of gold. The current short-term support is in the 3325-3315 area. If gold cannot fall below this area in such a weak situation, the market may reach a consensus that 3325-3315 is the support area, thereby attracting a large amount of buying funds to flow into the gold market, thereby boosting gold to regain the bullish trend again and is expected to hit the 3350-3360 area.
So for short-term trading, I currently prefer to start long gold with the 3325-3315 area as support, first expecting gold to recover some of its lost ground and return to the 3350-3360 area!
Gold Faces Strong Rejection Below $3,365 – Bearish Wave Ahead?Gold is currently trading around $3,359, showing signs of exhaustion after climbing from the $3,248 low. The chart illustrates a textbook scenario of channel rejection after testing the upper boundary of the descending wedge and failing to break above the $3,365–$3,392 resistance zone. Price is now hovering just below the diagonal black trendline, indicating a potential lower high formation and setting up for another bearish wave.
📌 Key Technical Highlights
Resistance Zone: $3,365–$3,392
This area marks the confluence of the black long-term trendline, the top of the descending purple channel, and the previous high at $3,392.
Price attempted a "Possible Retest" as annotated on the chart and is now starting to pull back—showing signs of bearish rejection.
Bearish Scenario (Blue Arrows):
Multiple downward arrows show likely bearish paths if the current resistance holds.
Key short-term targets:
$3,337, $3,320, $3,303, Strong support at $3,293–$3,248
Further downside may test extension levels toward $3,220–$3,200 by early August if momentum builds.
⚠️ Bearish Confirmation Criteria
Failure to close above $3,365 (black trendline)
Breakdown below $3,337 followed by $3,320
Strong selling pressure supported by fundamentals (e.g. USD strength, Fed hawkish stance)
✅ Invalidation / Bullish Outlook
A decisive breakout and close above $3,392.73 would invalidate the bearish structure.
In that case, targets would shift toward:
$3,412, $3,434, $3,490 (long-term trendline intersection)
However, today's U.S. CPI (Consumer Price Index) release adds a layer of volatility and potential trend disruption, making this a high-risk trading day.
📊 CPI News Impact – What to Watch
High CPI (Stronger than forecast):
- Increases expectations of further Fed tightening → strengthens USD → bearish for gold
- Likely scenario: sharp drop toward $3,337 → $3,320 → $3,293
Low CPI (Weaker than forecast):
- Signals disinflation → weakens USD → bullish for gold
- Possible breakout above $3,365 → retest of $3,392 → if broken, target $3,412 and $3,434
Neutral or as expected CPI:
- Likely leads to whipsaw — fakeout on both sides
- Caution advised — wait for candle close confirmations post-news
Note
Please risk management in trading is a Key so use your money accordingly. If you like the idea then please like and boost. Thank you and Good Luck!

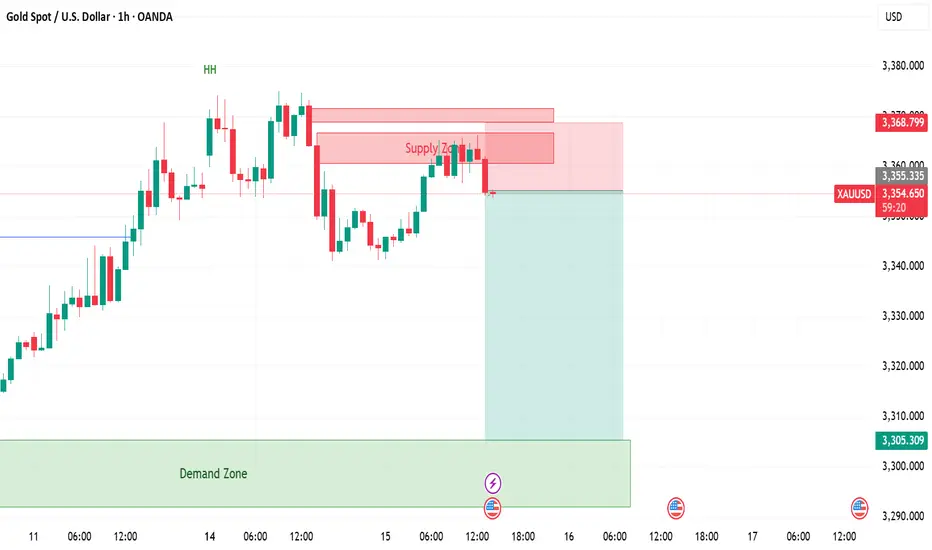
XAUUSD | GOLD | SellGot the confirmation from 15 minute timeframe.
Sell Gold till demand zone.
R:R 1:3,8
THE KOG REPORT - UpdateEnd of day update from us here at KOG:
We wanted that lower level 3285 to hold which it did and give the move upside following the red box target levels which have worked well for today. As you can see, we're at red box here so there is a chance we may see a retracement in to the level shown below. It's that 3306-4 level that is the flip now and will need to break to go lower.
Support 3304 with key level resistance 3320. Below 3320, we're still bearish with another attempt on the 3300 level for the break.
From Camelot this morning:
Price: 3285
RED BOXES:
Break above 3290 for 3304✅, 3306✅, 3310✅, 3320 and 3324 in extension of the move
Break below 3279 for 3254, 3246 and 3240 in extension of the move
As always, trade safe.
KOG

XAUUSD TRADE SETUPWait for retest the entry level then take a trade for BUY otherwise skip this setup

XAUUSD NY SESSION FLOW – JULY 8→ 9 , 2025"Structure doesn’t lie. Price answered exactly where we expected it to."
Hey traders 👋
Let’s set the record straight after today’s precision bounce. We saw textbook price action across all sessions — Asia triggered the short from our 3344–3351 HTF supply, and both London and New York followed through with no hesitation, driving price down to 3287.
But here’s the key point:
🧨 3287 was just 10 pips above our clean 3286–3280 buy zone.
No mitigation. Just a front-run.
That’s what real liquidity does — grabs what it needs before the crowd gets in. Our zone is still valid… just untouched.
🔍 HTF BIAS & STRUCTURE UPDATE
📆 Daily Bias:
Structure is still bearish — lower highs, CHoCH, and soft RSI.
EMAs 5/21 are flat. No power for bulls unless 3351 breaks.
⏰ H4 Bias:
New lower high confirmed after rejection from our 3344–3351 zone.
Trend is still bearish unless we reclaim 3330+ with conviction.
Liquidity is driving movement, not news.
🕐 H1 Flow:
Bounce from 3287 = engineered reaction before real demand
Price now hovering above 3306, forming mid-structure
No trade in the middle. Let’s work the edges.
🎯 TODAY’S SNIPER ZONES
🔻 SELL ZONES
1. 3325–3330
Nearest short trap. OB + inefficiency + H1 rejection base.
If price returns, watch M15/M30 for CHoCH or BOS → entry.
2. 3344–3351
Our major HTF supply. Asia already reacted from top half.
If revisited, this zone remains the high-probability rejection zone.
3. 3380–3394
Premium OB + imbalance pocket.
Untouched zone far above — if tapped late in the week, watch for liquidity sweep → clean reversal potential.
🟢 BUY ZONES
1. 3297–3300
NY session bounce zone. Price tapped 3297 → pushed to 3306.
Still live for intraday reentry if price retests and confirms with BOS.
2. 3286–3280
Our true demand base. Price front-ran it by 10 pips — didn’t mitigate.
Still valid, still reactive. Don’t delete this zone.
3. 3263–3255
Last line of support. Deep zone — only comes into play if 3280 fails with conviction.
✅ EXECUTION REMINDERS
Price is hovering mid-range → don’t force entries
Only act if structure reacts at the edges (3325 or 3286)
3380–3394 may be a late-week trap if bulls get overconfident
📌 If this breakdown helped, hit 🚀 and drop a comment:
👉 Are you stalking 3325… or waiting for 3286 to finally wake up?
Let structure talk. You just execute.
GoldFxMinds 💭🔥
📢 Disclosure:
This analysis is based on the Trade Nation TradingView feed. I’m part of their Influencer Program and receive a monthly fee.
⚠️ Educational content only — not financial advice.

"Gold at a Crossroads! Bullish or Bearish? (Trade Plan)"🦹♂️💰 "Gold Heist Alert: XAU/USD Bullish Raid or Bearish Ambush?" 💰🦹♂️
🌍 Greetings, Market Pirates & Profit Raiders! 🌍
(Hola! Oi! Bonjour! Hallo! Marhaba!)
Based on the 🔥Thief Trading Method🔥, here’s our strategic heist plan for XAU/USD (Gold vs. Dollar). Follow the chart markings for high-probability loot zones—whether you're a bullish bandit or a bearish burglar! 🏴☠️💸
🎯 Entry Strategy (Where to Strike)
"The treasure is ripe for taking! Breakout = GO TIME!"
✅ Long Entry (Bullish Raid): Jump in at current levels if the uptrend holds.
✅ Short Entry (Bearish Ambush): Wait for a break & close below 3280.00 (confirms downtrend).
🛑 Stop Loss (Escape Route)
🚨 For Bulls: Bail out if price hits 3240.00 (SL tightens if trend strengthens).
🚨 For Bears: Retreat if price surges past 3360.00 (only activate SL post-breakout!).
🎯 Take Profit (Loot & Scoot!)
💰 Bullish Thieves: Aim for 3600.00 (or exit early if momentum fades).
💰 Bearish Bandits: Target 3125.00 (or escape before the cops—err, reversal—arrives).
📡 Market Intel (Why This Heist?)
Gold’s in a neutral zone (but bulls have the edge! 🐂📈). Key factors:
Macroeconomic shifts
COT data clues
Sentiment & seasonal trends
(Full breakdown in the chart notes—klick the 🔗! 🔍🌐)
⚠️ Danger Zones (News & Risk Control)
🚨 High-Impact News = NO NEW TRADES!
🚨 Protect open positions: Use trailing stops to lock in profits.
🚨 Adjust SLs if volatility spikes!
💥 Boost the Heist! 💥
Like & Share to fuel our next market robbery! 🚀💰
Follow for more lucrative trade setups—coming soon! 👀🔥
🎯 Trade Smart, Steal Smarter! 🦹♂️💎

#XAUUSD Buy 3324.57#XAUUSD Buy 3324.57
Stoploss 3314.57
Breakeven 3325.57
TakeProfit 1: 3334.57
TakeProfit 2: 3344.57
TakeProfit 3: 3354.57
TakeProfit 4: 3364.57
TakeProfit 5: 3374.57
Trade at your own risk
Protect your capital
The Wizard 🧙♂️ FDT
Thu 17 Jul ‘25 03:15 PM

XAUUSD Weekly Trade Setup(14-18th July 2025) - Bullish StrategyIn the ever-volatile world of commodities, Gold (XAUUSD) has yet again presented a promising technical setup. For traders looking to capitalize on price action and structure-based strategies, the upcoming week (14th to 18th July 2025) offers a clean breakout and retest opportunity backed by a strong risk/reward ratio.
Let’s break down the trade plan in detail.
1. Overview of the Current Market Structure
As shown in the 4-hour chart, XAUUSD is approaching a key horizontal resistance zone around 3360–3370. Historically, this area has acted as a rejection point for buyers. However, the recent bullish momentum, supported by price trading above the 200 EMA, suggests a potential breakout.
This forms the basis of a Breakout-Retest-Continuation strategy – one of the most reliable setups in price action trading.
2. The Trade Plan
Here’s the structured plan for this setup:
🔵 Step 1: Wait for the Breakout
Price must break above the resistance zone (3360–3370) with a strong bullish candle.
Avoid chasing the breakout; instead, let the market confirm its direction.
🟠 Step 2: Look for the Retest
After the breakout, wait for the price to pull back to the broken resistance, now acting as support.
Confirm this retest with a reversal candlestick pattern (e.g., bullish engulfing or hammer) on the 1H or 4H timeframe.
🔴 Step 3: Entry and Stop Loss
Enter the trade after the confirmation candle closes.
Place a stop loss below the swing low of the retest zone.
This protects the trade in case of a false breakout.
🟢 Step 4: Set Your Target
The profit booking zone lies around the 3440–3450 region.
This setup offers a Risk/Reward Ratio of 1:4, targeting 1:2, 1:3, and potentially 1:4 if momentum continues.
3. Why This Setup Makes Sense
EMA Confirmation: Price is trading above the 200 EMA, showing bullish bias.
Clean Price Action: Well-defined structure makes it easy to identify breakout/retest levels.
Strong Risk Management: The stop is tight and logical, while the upside potential is considerable.
Psychological Support Zone: 3360–3370 has repeatedly acted as a key decision level.
4. Trade Management Tips
Trail your stop loss once 1:2 R:R is achieved.
Consider partial profit booking at 1:2 or 1:3 to lock in gains and reduce risk.
Be patient – the key to this strategy is waiting for the retest confirmation.
5. Final Thoughts
Trading XAUUSD can be both rewarding and risky. This weekly setup gives you a disciplined approach to enter the market at a high-probability point with excellent reward potential. Whether you’re a swing trader or an intraday scalper on lower timeframes, this strategy adapts well with proper confirmation.
Stay tuned for live updates, and as always – plan your trade, and trade your plan.
Happy Trading!
=================================================================
Disclosure: I am part of Trade Nation's Influencer program and receive a monthly fee for using their TradingView charts in my analysis.
=================================================================

GOLD Will Keep Growing!
HI,Traders !
#GOLD keep trading in
An uptrend along the rising support
So as the pair is approaching
A the support we will be
Expecting a bullish rebound !
Comment and subscribe to help us grow !

Gold: Data, Tariffs & Trading LevelsThis week is packed with market news and economic data 😣. Key focuses include the US CPI, PPI, retail sales data, and the University of Michigan's preliminary consumer sentiment index. Additionally, former US President Trump plans to make a "major announcement" on Russia; the Federal Reserve will release the Beige Book (Economic Conditions Survey); and the CFTC's weekly positioning report is also worth monitoring 📊.
Over the weekend, Trump imposed tariffs on the EU and other regions, prompting a strong counterattack from the EU. The subsequent evolution of the situation requires continuous tracking, as it has triggered sharp market volatility pushing toward the 3400 mark 😱. Trump has recently announced frequent tariff policies (e.g., 30% tariffs on the EU and Mexico, and threats of 100% tariffs on Russia), amplifying market uncertainty. While this theoretically benefits gold's safe-haven demand, the actual impact requires close observation of institutional capital flows 🤔.
Gold prices consolidated at the bottom after a sustained pullback last night and extended their rebound this morning. Key pressure levels have undergone a support-resistance flip. The current gold rebound is merely a secondary confirmation of the 30-minute top structure, and after surging to 3365 in the afternoon, short-term signs of pressure have emerged 😕. In a volatile market, if prices start to consolidate sideways, it may signal the end of this oscillating upward trend, with a shift to a downward phase ahead.
Given market sensitivity ahead of the CPI data release, it’s advisable to focus on a volatile pullback trend 🧐. After today’s rebound, key attention should be on the 3363-3368 range as a shorting zone, with the long/short defensive level set at yesterday’s intraday high of 3375. Downside support is focused on the 3340-3335 range 🔍

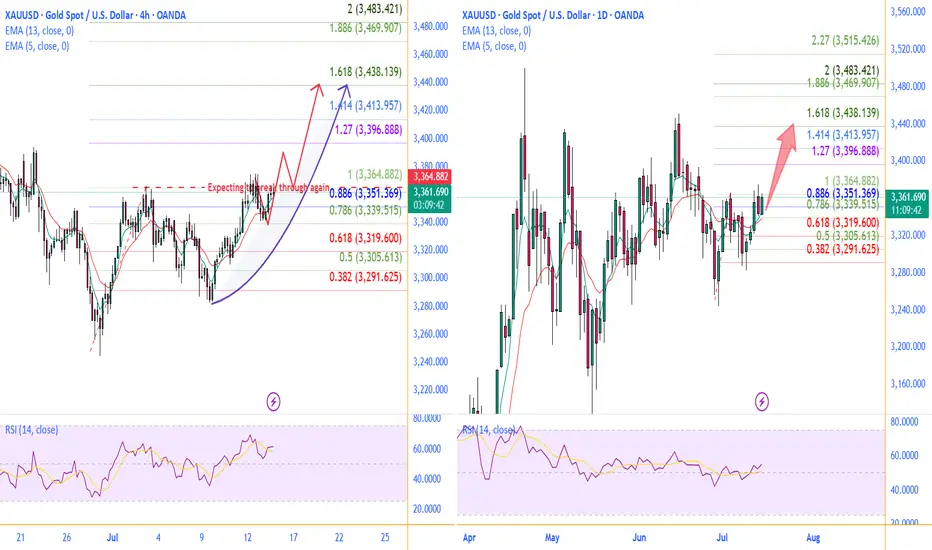
1507 a bull trend back to Gold Hello traders,
Gold has returned back above EMAs on daily chart.
On 4h chart, there is a chance for it to break through last top level to make a new high up to 3438 .
Take a good use liquidity of CPI of US today.
You could get a great result of that.
GOOD LUCK!
LESS IS MORE!
GOLD AT CROSSROADS: CAPITALIZING ON MARKET SHIFTS FUNDAMENTAL ANALYSIS
With Gold currently trading at 3357, we're at a pivotal moment. The confluence of heightened geopolitical tensions and recent decisive US government actions – including renewed tariff threats and evolving monetary policy signals – is creating a clear trajectory. Analysis indicates a compelling opportunity to initiate aggressive sell signals, targeting 3345 and then pushing for 3330. Risk is rigorously managed with a disciplined stop loss at 3380. This is a strategic move, designed to profit from the immediate downward pressures stemming from the global political and economic landscape, as the market re-calibrates to these powerful forces."

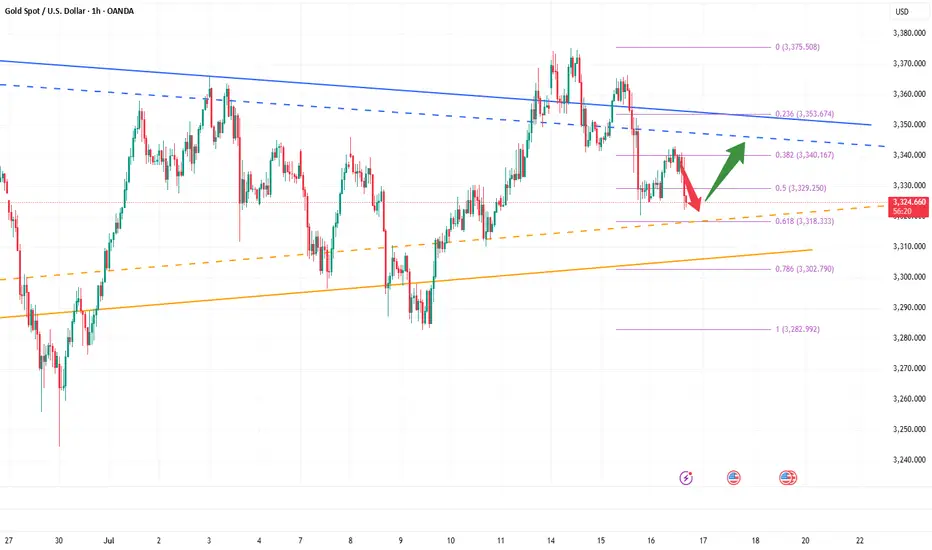
Gold/XAUUSD Analysis Breaks Bullish Channel – Targeting 3400+🟨 Market Context:
Gold (XAU/USD) has recently completed a significant technical move that signals the potential start of a strong bullish continuation phase. After a period of consolidation inside a descending channel, price has broken above key resistance levels and is showing firm buyer strength across the board.
🔍 Technical Structure Breakdown:
🔹 Descending Channel (Consolidation Phase)
For several sessions, gold was confined within a well-defined descending channel, which typically indicates a temporary correction in a broader bullish trend. This phase served as a liquidity-building zone where smart money accumulated long positions.
🔹 Breakout & Retest Confirmation
The breakout above the upper boundary of the channel was clean and impulsive, confirming bullish intent. This breakout aligned perfectly with a previous demand zone (now retested as support), adding strong confluence.
Key Breakout Zone: $3,330–$3,340
Retest Action: Price pulled back to test the breakout zone, respected it, and printed a bullish reversal.
This behavior confirms the “breakout–retest–continuation” pattern—highly reliable in trending markets.
🔹 SR Interchange – Key Pivot Zone
The level around $3,340 served a dual role:
Previously acted as resistance within the channel.
Now acting as support post-breakout (SR flip).
This interchange area is significant because it reinforces the idea that bulls are now defending this level aggressively.
🔹 Bullish Pattern Confirmation
A bullish price pattern has formed exactly at the SR zone and near the trendline. This double confluence (pattern + level) provides high-probability trade setups and confirms the entry point for buyers.
🔹 Ascending Trendline Support
An emerging bullish trendline is now guiding the move upward, confirming that the market has shifted its short-term trend. Every bounce on this trendline reinforces bullish structure and validates higher-low formations.
🎯 Price Targets & Expectations:
✅ Previous Target Zone:
Around $3,375, already tapped and respected.
This shows that gold is following technical targets with precision.
🎯 Next Bullish Target:
$3,400 – $3,410 zone stands as the next supply region.
This area is a major psychological resistance and aligns with historical reaction points.
🧠 Trading Insight & Strategy:
With current price action and momentum, buying dips remains the optimal approach, provided the price stays above the SR Interchange zone.
🔽 Entry Zone: $3,345 – $3,350
📈 Targets:
TP1: $3,375 (partial exit)
TP2: $3,400–$3,410 (final target)
❌ Invalidation Zone (Stop Loss): Below $3,330
Breaking below this would invalidate the breakout structure and possibly signal a false breakout.
📌 Summary:
✅ Clear breakout from descending channel
✅ Retest of previous demand and SR flip zone
✅ Bullish pattern confirmed on key support
✅ Ascending trendline intact
🎯 Next logical move: $3,400+
The gold market is giving strong bullish cues, and this setup could be a textbook example of “buy the breakout, ride the trend.”
Stay sharp, trade smart, and keep your risk in check. 👑

Gold’s Chart Update Next Move: Bullish or Bearish?Gold has shown strong bullish momentum 💪 as it breaks through the descending trendline 📉, positioning itself to target the upper liquidity zone 💰. Right now, we have two key scenarios to watch:
1️⃣ Bullish Scenario: If Gold breaks above the 3345 level and closes a solid candle above it 🔝, we could see a move towards 3360 🚀, signaling further upward potential.
2️⃣ Bearish Scenario: However, if Gold sweeps the 3345 zone and fails to maintain the bullish momentum 🔻, we may see a pullback that could push prices lower 📉.
Stay vigilant 👀 and keep an eye on price action for the next big move! 🔍📊

Adjust after shock and then go longNews: In the early Asian session, spot gold rose slightly, reaching a high of $3,372.65/ounce, the highest since June 23. Trump announced last weekend that he would impose a 30% tariff on goods imported from the EU from August 1, which further heated up the market's concerns about international trade and provided momentum for gold prices to rise. In the early Asian session, spot gold rose slightly, reaching a high of $3,373.99/ounce so far, the highest since June 23. Trump announced last weekend that he would impose a 30% tariff on goods imported from the EU from August 1, which further heated up the market's concerns about international trade and provided momentum for gold prices to rise.
Analysis of gold trend: Today it hit a new high at around 3373. From the daily chart, gold has closed three consecutive positive days. The K-line pattern is a bullish signal. From the indicators, the RSI turned upward from a low level, and the Stoch indicator formed a golden cross at a low level. It is currently running in the middle. The indicators show that gold is still likely to rise in the short term. At the same time, we should also pay attention to the suppression of the 3400 area on the upper track of the daily Bollinger band. In the short term, pay attention to the breakthrough of this level. Once 3400 is not broken through for multiple times, gold will still fall back to test the 3280 support in the future. Once it breaks through 3400, gold will test the 3450 area. In the short term, it is still likely to rise. The operation strategy remains unchanged.

Gold Analysis 7/14/25This week's analysis so far. Keep in mind the Sunday open as price tends to come back to this point sometimes.

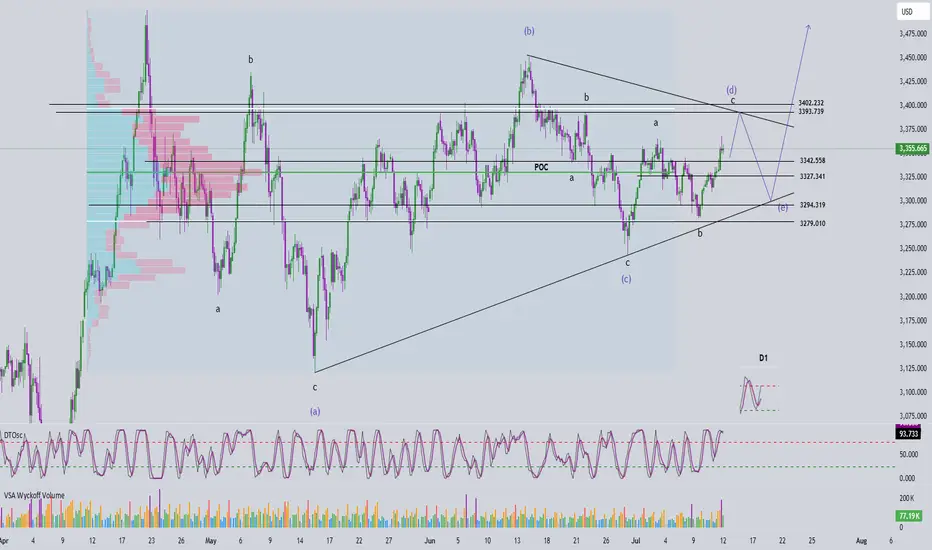
XAUUSD – Summer Triangle ConsolidationGold (XAUUSD) is unfolding a textbook contracting triangle on the 4H chart, currently developing leg D of the pattern. This structure has been forming over the past few months and reflects classic market behavior during the summer — slow, sideways consolidation as many participants are away for the season.
Given the current structure, I expect one more leg down to form wave E, completing the triangle. Once this leg is in place and the support trendline holds, we could see a significant breakout to the upside in line with the broader bullish outlook on higher timeframes.
This setup remains valid as long as price continues respecting the triangle boundaries. I’m watching for a clean rejection at the lower trendline near point E to validate the bullish breakout scenario.
📌 Seasonality, structure, and market tempo suggest patience as the consolidation plays out. The breakout opportunity may follow shortly after leg E concludes.

Elliott Wave Analysis – XAUUSD | July 14, 2025
🔍 Momentum Analysis
D1 Timeframe: Momentum is currently reversing to the upside, indicating that the bullish trend may continue into early next week (Monday).
H4 Timeframe: Momentum has entered the overbought zone, suggesting that a short-term correction is likely to bring momentum back down into oversold territory.
🌀 Elliott Wave Structure
On the H4 chart, we observe a contracting triangle pattern (abcde) approaching its final stages.
In the Friday trading plan, we anticipated that the corrective phase had ended and price was entering a new impulsive wave. However, there are two irregularities worth noting:
A pin bar candle with high volume has appeared at the resistance zone near 3365, while H4 momentum is overbought. This signals a likely short-term correction — something that ideally should not happen if price is already in wave 3. Ideally, price should have surged to 3402 on Friday to strengthen the bullish case.
On the H1 chart, bullish candles are small and overlapping, reflecting weak bullish momentum and a lack of conviction from buyers.
These two signs suggest that the market may still be within the correction phase, and the 3402 level will serve as a key confirmation zone to determine whether the correction has truly ended.
💡 Trading Outlook
The bullish momentum on the D1 chart still supports BUY positions for the coming week.
However, since the H4 chart is overbought, a short-term pullback is likely.
We will look to buy on dips toward lower support zones, targeting a move toward 3393 – 3402, which remains the target area as outlined in Friday’s plan with the original entry at 3332 – 3330.
📊 Trading Plan
BUY Zone: 3342 – 3340
Stop Loss (SL): 3330
Take Profit 1 (TP1): 3370
Take Profit 2 (TP2): 3393
Gold Trading Strategy | July 14-15✅ From the 4-hour chart structure, the short-term support to watch lies in the 3340–3345 zone, which corresponds to the neckline level on last Friday's hourly chart. This is a key support area. If a pullback holds above this level, it may serve as a new launching point for the bulls.
✅ A deeper support zone is located around 3325–3330, which serves as the dividing line between a strong and weak bullish structure in the short term. If this level is broken, the bullish continuation will need to be re-evaluated.
✅ From the daily chart perspective, as long as gold prices remain stable above 3325, the overall bullish trend remains intact. The strategy of "buying on dips" remains valid. As long as there is no confirmed breakdown below this level, the outlook remains bullish.
✅ Trading Strategy Suggestions:
🔰 Initial Buy Zone: Consider light long positions on a pullback to the 3340–3345 area.
🔰 Add-on Zone: If the price dips further to the 3330–3335 area, consider adding to long positions.
🔰 Target Zone: Look for an upside move toward the 3365–3370 area, paying attention to the strength of the rebound.
🔥Trading Reminder: Trading strategies are time-sensitive, and market conditions can change rapidly. Please adjust your trading plan based on real-time market conditions. If you have any questions or need one-on-one guidance, feel free to contact me.

GOLD remains stuck near 3365dGOLD remains stuck near 3365
Price faced a strong resistance zone in the bullish move near 3365
If we look at the left side of the chart, it shows that it could fall further. The structure zone near 3365 seems to be ver.y strong.
As long as the price has not risen above 3392 when Iran attacked the US, then it should not break this area under normal conditions.
There is a high chance that a larger bearish wave will resume, but again it is very risky.
Today the economic calendar is almost empty, so we could see gold take a break, as shown on the chart before falling to 3285 and 3250 first.
It will also be affected by the tariff topic this week, because the deadline is July 9th. Trump is expected to create another mess.
In my opinion, with the current data, ARI is rising, the chances of falling further.
You may find more details in the chart!
Thank you and Good Luck!
PS: Please support with a like or comment if you find this analysis useful for your trading day
