3340-3300: Lock in the buy high and sell low in this area!Under the influence of unemployment benefits and zero monthly sales data, gold fell sharply in the short term, but it did not effectively fall below 3310 during multiple tests, effectively curbing the further downward space of the shorts. Multiple structural supports are also concentrated in the 3310-3300 area, so as long as gold does not fall below this area, gold bulls still have the potential to rebound.
However, for the current gold market, it may be difficult to see a unilateral trend in the short term. After experiencing discontinuous surges and plunges, gold may focus on consolidation and repair, and the consolidation range may be limited to the 3340-3300 area.
So for short-term trading, first of all, I advocate going long on gold in the 3320-3310 area, and expect gold to rebound and reach the 3330-3340 area;
If gold reaches the 3335-3345 area as expected, we can start to consider shorting gold, and expect gold to step back to the 3320-3310 area during the shock and rectification process.
CFDGOLD trade ideas
Gold Trade Setup Eyes on 15M Demand ZonePrice is coming close to 3338, where we have a 15-Minute Order Block (OB) 📍. This is a fresh demand zone and can give a bullish reaction when price taps into it 🟢.
📌 Plan:
We will wait for price to tap the OB ✅
If we see bullish signs like rejection wicks or bullish candles, we will enter a buy 📈
Our target will be near 3366, just below the bearish FVG 🎯

Retracement for cooldownBased on the spike leaving some long wick from 1 hour timeframe, there is a possibilities for it to retrace back for cooldown period before going up. My calculations lead to 3335 as a support level.
Sell - Take profit on 3335. Believe me, I am from the broken future. Just kidding.


Report - 10 jully, 2025Nvidia Becomes First $4 Trillion Company: AI Euphoria Drives Tech Boom
Key Highlights
Nvidia surged 40% since May, reaching a $4 trillion market cap, surpassing Apple and cementing its leadership in the AI chip space.
Drivers:
Thawing US-China trade tensions in early May boosted market sentiment.
Major sovereign AI infrastructure deals in Europe and Middle East.
Continuous demand from Big Tech (OpenAI, Microsoft, Google).
Nvidia’s projected 2025 revenue: ~$200bn (+55% YoY), net income ~$105bn, gross margin >70%.
Strategic Analysis
Nvidia’s success highlights the dominant role of AI infrastructure as a "new digital oil". It also underscores the increasing gap between top-tier AI firms and the rest of the semiconductor sector.
The "AI flywheel effect" is evident: Nvidia’s chips enable AI growth → Big Tech scales → Nvidia sells even more, creating a compounding loop.
Risks & Watchpoints
Export restrictions to China remain a ceiling on growth.
Rising competition from domestic Chinese players like DeepSeek.
Potential regulatory pushbacks or tech sovereignty initiatives in key markets.
Market Implications
Supports strong flows into US Tech ETFs and growth factor strategies.
Reinforces demand for high-performance computing infrastructure investments.
Spillover benefit to data center REITs, cloud infrastructure providers, and advanced memory suppliers.
European Airlines Face Worst Delays Ever
Key Highlights
Severe staff shortages, record post-COVID demand, and extreme weather events (wildfires) expected to create "worst ever" delays.
Critical air traffic control capacity constraints in major hubs: France, Germany, Greece, Spain.
Strikes further disrupt operations, impacting airlines financially (e.g., Air France-KLM).
Strategic Analysis
Operational risk for European carriers is increasing sharply.
Near-term margin pressure due to reroutings, cancellations, and compensations.
Possible reputational harm and longer-term adjustments to travel insurance premiums.
Market Implications
Negative near-term for airline stocks, potential hedge opportunity via short positions.
Supports defensive consumer stocks and travel insurers.
Potential boost to domestic tourism and alternative transport sectors (rail).
EU Removes UAE and Gibraltar From AML Grey List
Key Highlights
EU parliament voted to delist UAE and Gibraltar, facilitating smoother transactions and trade negotiations.
Move strategically driven by EU trade talks with Abu Dhabi.
Strategic Analysis
Improves transaction flows and reduces compliance costs for EU-based banks and corporates engaging with UAE.
Enhances UAE’s reputation as a credible financial hub, possibly attracting more institutional capital flows.
Market Implications
Positive for European banks with Middle East exposure.
Supports UAE sovereign and quasi-sovereign bond demand.
Brain Aging Identified as Top Predictor of Longevity
Key Highlights
Stanford research: brain aging is the single most important determinant of lifespan, more than other organ systems.
Opens new frontiers for diagnostics and personalized medicine.
Strategic Analysis
Potential shift in longevity biotech investments toward neuro-focused therapies and diagnostics.
Emerging new segment in consumer health testing (bio-age clocks).
Market Implications
Positive for neurodegenerative research-focused biotech (e.g., companies working on Alzheimer’s, brain rejuvenation).
Creates thematic investment opportunities in longevity ETFs and specialized VC.
US Space Safety System Faces Funding Cuts
Key Highlights
Proposed 85% funding cut to Office of Space Commerce’s collision-avoidance system (Tracss).
Industry concerns: increased collision risk, higher operational costs, and potential insurance implications.
Strategic Analysis
Rising risks in orbital operations may accelerate private solutions and partnerships.
Could indirectly benefit specialized private space tracking firms and insurance providers.
Market Implications
Near-term negative sentiment for US-based satellite operators.
Supports consolidation or premium valuation of private orbital tracking players.
FSB Proposes Leveraged Limits for Hedge Funds
Key Highlights
New proposals to limit non-bank leverage and improve transparency.
Aims to mitigate systemic risk amplified by strategies like Treasury basis trades.
Strategic Analysis
Could compress returns in highly leveraged strategies, particularly macro and relative-value hedge funds.
May shift flows toward lower-leverage, higher-transparency structures.
Market Implications
Increased scrutiny likely benefits regulated fixed-income and public credit markets.
Hedge fund sector might see short-term outflows or strategy shifts.
Trump’s “Big Beautiful Bill”: Winners & Losers
Winners
Private equity & fossil fuels (carried interest loophole preserved, tax breaks).
Coal & nuclear (additional incentives).
Defense contractors (additional $150bn budget).
Certain retail segments (tariff exemptions phased out benefiting domestic).
Losers
Renewables (wind, solar incentives cut).
AI firms (lack of national regulation moratorium).
EV sector (credits scrapped).
Top universities (endowment taxes).
Strategic Analysis
Supports US traditional energy transition back toward fossil fuels.
Encourages private equity capital inflows.
Defensive healthcare positioning validated, but long-term funding risks persist.
Market Implications
Rotation into energy and defense stocks.
Potential pullback in renewable energy and select tech.
Beneficial for defense ETFs, private equity-exposed indices.
Chinese Bank Stocks Surge in Hong Kong
Key Highlights
Driven by strong dividend yields (4.6%–5.7%) vs 1.65% in local debt.
Backed by Chinese insurance giants like Ping An.
Strategic Analysis
Shows investor pivot to "quasi-fixed income" attributes of big banks.
Reflects stabilizing credit conditions and support from state capital injections.
Market Implications
Supports bank-heavy indices like Hang Seng Financials.
Reinforces China yield-hunting narrative.
Copper Market Shaken by US Tariff Threat
Key Highlights
US threatens 50% tariff on global copper imports.
Potential reduction in global copper demand, investment hesitation.
Strategic Analysis
Long-term supply chain risk for US green energy and electrification.
May lead to regional trade distortions, price volatility.
Market Implications
Bearish pressure on global copper prices despite short-term US price premiums.
Chilean and Zambian miners may face margin squeezes.
Temasek Turns Bearish on Europe
Key Highlights
Shifts focus due to US tariff uncertainty and weaker European domestic outlook.
Increased Middle East and US exposure.
Strategic Analysis
Illustrates global capital reallocation away from EU toward more "policy-stable" regions.
Encourages European corporates to further diversify geographic revenue streams.
Market Implications
Could slow inflows into European equities and private markets.
Supports Middle East infrastructure and US tech/consumer exposure.
Markets Recap
Global equities at record highs; Nvidia leads tech euphoria.
US Dollar slightly higher; Euro weaker.
Government bonds strong, yields decline on flight-to-quality and rate cut hopes.
Copper volatile; oil and gold remain firm.

GOLD 18.7.2025 FRIDAYHow to see on chart. waiting for clearly breakout of 4h channel then buying gold with SL . I see potencial taking Liquidity of 3390-3400. Enjoy!

XAUUSD Trade Setup: Buying Opportunity at 3,322 Support ZoneGold (XAUUSD) is currently testing a critical support zone between 3,322 and 3,323 USD. This area represents a confluence of the previous swing low and the 0.618 Fibonacci retracement level, which is historically known to trigger technical bullish reactions. If a confirming signal appears on the H1 chart, this may offer a favorable short-term buy opportunity.
Trade setup details:
Entry (Buy limit): 3,323 – 3,322 USD
Stop loss: below 3,318 USD
Take profit: 3,331 – 3,340 USD
Risk-to-reward ratio: approximately 2:1
Technical rationale for the trade:
The 3,322 level has acted as a strong support in recent price structure
Aligns with the 0.618 Fibonacci retracement, often seen as the last line of defense in bullish setups
RSI on the lower time frame is nearing oversold, signaling potential bullish momentum
Risk management notes:
If price closes below 3,318 USD, the long idea becomes invalid
Best entries should be supported by price action signals such as pin bar, bullish engulfing, or other reversal candles near support
Conclusion: A buy position in the 3,322 – 3,323 USD zone presents a reasonable strategy as long as the support holds. If bullish reaction occurs, price may revisit the 3,340 resistance area in the short term.
Save this strategy if you find it useful, and stay tuned for more real-time trade ideas and insights.

Sell Idea
Overall Market Analysis
● Market Structure: The chart clearly shows that Gold is in a strong consolidation or
ranging phase. It is not trending up or down but is instead oscillating between a
well-defined resistance "ceiling" and a support "floor".
● Conclusion for Higher Probability: In a ranging market, the highest probability trades
are to sell near resistance or buy near support. Since the current price (~$3339) is in
the upper half of the range and closer to major resistance, a bearish (Sell) plan
currently presents a more immediate and statistically favorable setup than a buy
plan. A buy plan would require waiting for the price to drop significantly.
Hypothetical Trade Plan: Bearish Range Trade
This plan is based on the expectation that the established resistance level will hold and the price
will rotate back down within its range.
1. Thesis / Rationale: The price has repeatedly failed to break and hold above the $3350 -
$3375 zone for over a month. This indicates a strong presence of sellers at this level. The
strategy is to align with these sellers, anticipating another rotation down towards the support
level.

XAUUSD Shortat 15 min TF i can see a short trade as price has retraced so well now it is the time to short it till 3309
best location for buy mid term goldthis my analysis combine price action SMC and Astrologi Financial...i see good moment for buy gold.

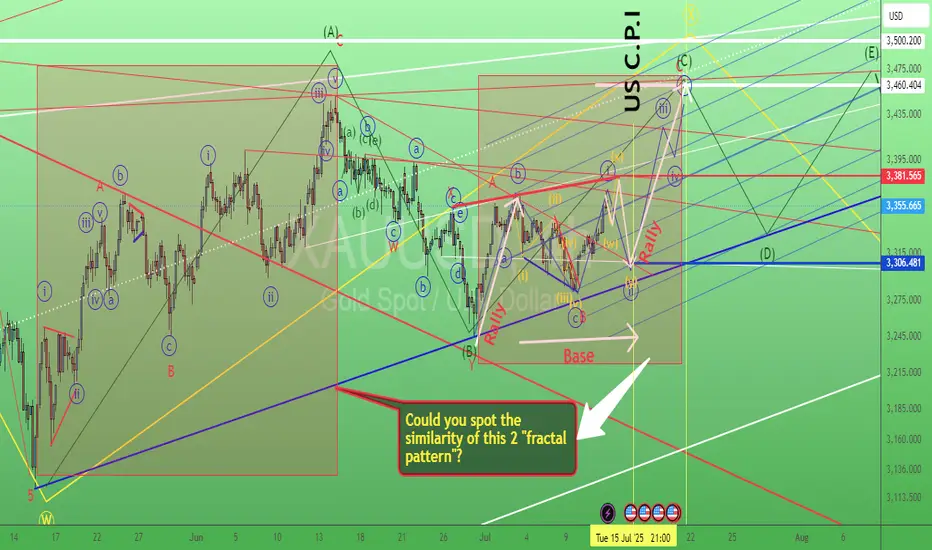
Gold swing trade setup 13/July/25XAUUSD. Based on the latest "speed" development of chart instead of forming a triangle pattern gold probably building a "flat" "Base" before rallying toward 3460 +/- Coming Tuesday US CPI could be the "trigger" for launching the rocket..
XAUUSD ANALYSISOn gold currently we're analyzing 2H time frame. As we know that current trend was bullish. At this stage, I'm anticipating a retracement towards my Point of Interest (POI), where I’ll be looking for a clear bullish confirmation, ideally through candlestick structure or solid price action. Only upon receiving that confirmation will I consider entering a buy position.
This outlook is based on the higher time frame structure. For now, I'm observing patiently to see how price unfolds. Until the market sweeps the SSL liquidity, I will remain on the sidelines no entries until that key liquidity level has been taken. Confirmation is key.
Always use stoploss for your trade.
Always use proper money management and proper risk to reward ratio.
#XAUUSD 2H Technical Analysis Expected Move.

XAUUSD WAS GOES TO DOWN TREND "I follow structure, not emotions.
The trend is bearish — I sell strength, not weakness.
My entry is smart, at a lower high or CHoCH retest.
My SL is tight — just above the invalidation point.
My TP is clear — near the next demand or previous low.
I don’t hope. I manage risk and trust my edge."
---
📉 Suggested Setup Based on This Chart:
(Use this only as example — always confirm with your own strategy.)
Entry: Near the most recent CHoCH retest or rejection wick at LH (around 3,360–3,365 zone)
Stop-Loss (SL): Just above the previous LH or supply zone (around 3,375)
Take-Profit (TP): Near next support / previous LL zone (around 3,305 or even 3,248)
Risk-Reward (RR): Target at least 2:5

XAUUSD:Continue to go long
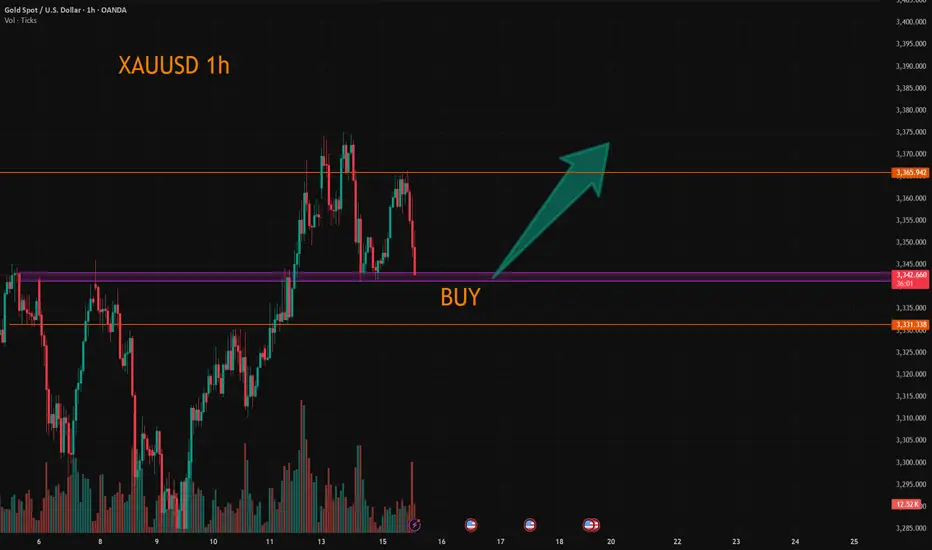
The gold price has just fallen after being pressured by the 3365 level. Currently, there are no obvious signs of a bottoming out. However, the 3340-43 range is the support position from the previous several declines. Here, one can lightly participate in the bullish orders. If going further down, the 3330 level is an important support point. Both of these positions can be utilized to go long.
Then the trading strategy:
BUY@3340-43
TP:3360-65
If the price retraces to the 3330 level, increase the position of the long bet. The goal remains the same. I will keep you informed if there are any changes.
More detailed strategies and trading will be notified here ↗↗↗
Keep updated, come to "get" ↗↗↗
XAUUSD 4Hour TF - July 13th, 2025XAUUSD 7/13/2025
XAUUSD 4 hour Long Idea
Monthly - Bullish
Weekly - Bullish
Daily - Bullish
4hour - Bullish
Gold is looking pretty bullish this week as we saw a significant push above our 3,320.000 resistance zone. Looking to ride that same trend through this next week.
Bullish continuation - After a nice rally last week gold looks primed for another long setup. Ideally, price action goes for the retest of 3,320.000 and forms a higher low. This would confirm bullish structure and we can begin targeting higher toward major levels of resistance.
Bearish Reversal - For us to consider bearish setups we would first need to see a break back below 3,320.000 followed by a confirmed lower high. If this happens we can consider short positions and look to target lower toward major levels of support.

xauusdGold enters support by reaching daily trend line
If gold continues to hold support
Gold is expected to reach its previous high again

Gold - The clear top formation!🪙Gold ( TVC:GOLD ) just created a top formation:
🔎Analysis summary:
Over the past four months, Gold has overall been moving sideways. Following a previous blow-off rally of about +25%, this cycle is very similar to the 2008 bullish cycle. Bulls are starting to slow down which will most likely result in the creation of at least a short term top formation.
📝Levels to watch:
$3.000
🙏🏻#LONGTERMVISION
Philip - Swing Trader

gold daily bias today (17th july 2025)Daily remains bullish within a bullish BOS. 4H structure confirms the same — only reacting if price invalidates the bullish setup.
For BUYS (Scenario 1 – Deep Retracement Buy):
1️⃣ Price retests the 3320.651 – 3311.381 zone.
2️⃣ Form a 1/3M bullish CHOCH with a body candle close.
3️⃣ Retest the level and BUY toward 3349.077.
For BUYS (Scenario 2 – Intraday Structure Flip):
1️⃣ Price forms a 15M bullish CHOCH with body candle close.
2️⃣ Retest the 15M BOS using a 2/3M bullish CHOCH.
3️⃣ Confirm the retest and BUY toward 3349.077.
For SELLS (Scenario 3 – BOS Break + Shift):
1️⃣ Break below 3320.651 – 3311.381 with a strong 1H momentum candle.
2️⃣ Pull back to the broken zone.
3️⃣ Form a 1/3M bearish CHOCH after retest and SELL toward 3298.508.


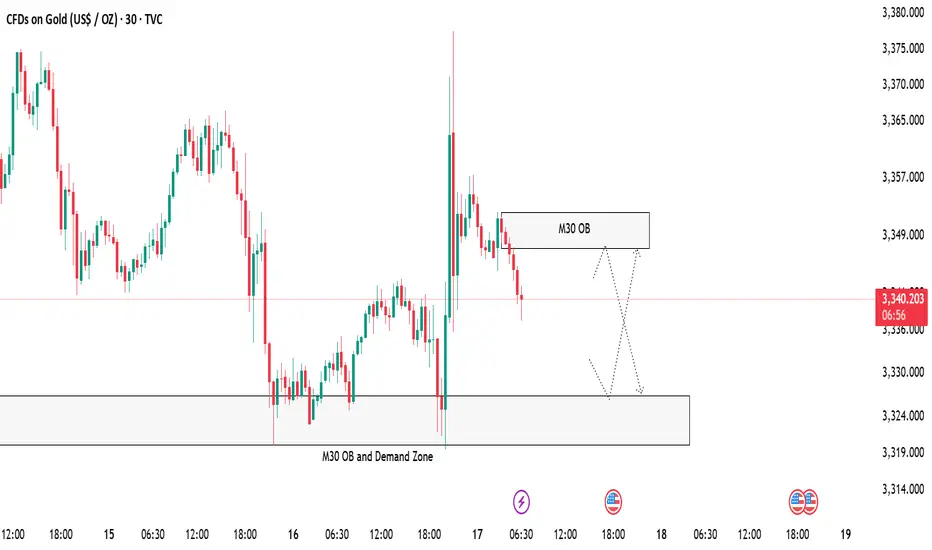
Gold 30-Minute OB and Demand Zone SetupGold is now approaching a 30-Minute Order Block along with a strong demand zone 🟢. We are expecting some clean reactions from these areas.
📌 Plan:
Scenario 1:
👉 If price respects the M30 OB and Demand zone area at 3327 -3320, we can look for bullish signs like rejection wicks or bullish candles to enter buy positions 📈, targeting the upper zone M30 OB zone near 3347 🎯.
Scenario 2:
👉 If price tap the above 30 min OB near 3347 we take our sell or short side entries for a reaction from there entering short ✅.
Both scenarios are possible, so we will watch the price action closely 🧐 and only trade with confirmation!
Gold (XAUUSD) – 17 July Analysis | Demand Zone in Play🟢 Gold (XAUUSD) – 17 July Analysis | Demand Zone in Play
Gold continues to follow the bullish structure we’ve been tracking in our recent posts. Yesterday's news-driven price action pushed the market to a new swing high near 3377.600 , confirming strength in higher timeframes. Now, price is currently in a retracement/pullback phase , pulling back toward a key intraday demand zone at 3326–3320 — offering potential opportunity for the next leg upward.
🔍 Where Are We Now?
The market is currently pulling back toward a key M15 demand zone: 3326–3320 . This level also aligns with a higher timeframe order block on the H4, making it a critical confluence area for structure-based traders.
This 3326–3320 zone is crucial because:
→ It’s a fresh M15 demand zone inside a higher timeframe bullish structure
→ It aligns with the H4 OB that previously acted as a launchpad
→ The overall trend remains bullish unless this zone is decisively broken
If the zone holds and we get LTF confirmation (such as M1 internal structure shift + micro-BoS), it may present a high-probability long setup.
⚙️ Structure Summary:
✅ H4: Bullish continuation structure with recent higher high
✅ M15: Pullback within bullish order flow
✅ M1 (for entry): Awaiting ChoCH + BoS as entry trigger inside POI
📌 Trade Setup Plan (upon confirmation):
→ Entry: From 3326–3320 demand zone
→ Stop Loss: 40 pips below entry
→ Take Profit: 120 pips (targeting new HH based on H4 projection)
→ Risk-to-Reward Ratio: 1:3
🧠 Key Trading Insight:
We never predict — we prepare .
We don’t chase price — we position with confirmation .
Discipline means waiting for price to invite us in , not entering just because a level looks attractive.
📈 Summary & Expectations:
➡️ Price is retracing into a structurally significant demand zone
➡️ Market bias remains bullish unless this zone fails
➡️ If the zone holds with valid M1 confirmation, we’ll consider a long setup targeting a new high
➡️ No confirmation = no trade. Patience > prediction.
📘 Shared by @ChartIsMirror
This analysis is part of our ongoing structure-based approach to trading Gold. All entries are derived from pure price action, multi-timeframe structure alignment, and trader discipline — as taught in our book:
“The Chart Is the Mirror: Mastering Gold with Structure, Stillness, and Price Action”

Gold Spot Price (USD) - 4-Hour Chart (OANDA)4-hour performance of the Gold Spot price against the U.S. Dollar (OANDA). The current price is $3,223.660, reflecting a 1.3% decrease. Key levels include a resistance zone around $3,360.405 and a support zone near $3,294.070, with recent price action showing a potential breakout or reversal within these ranges.

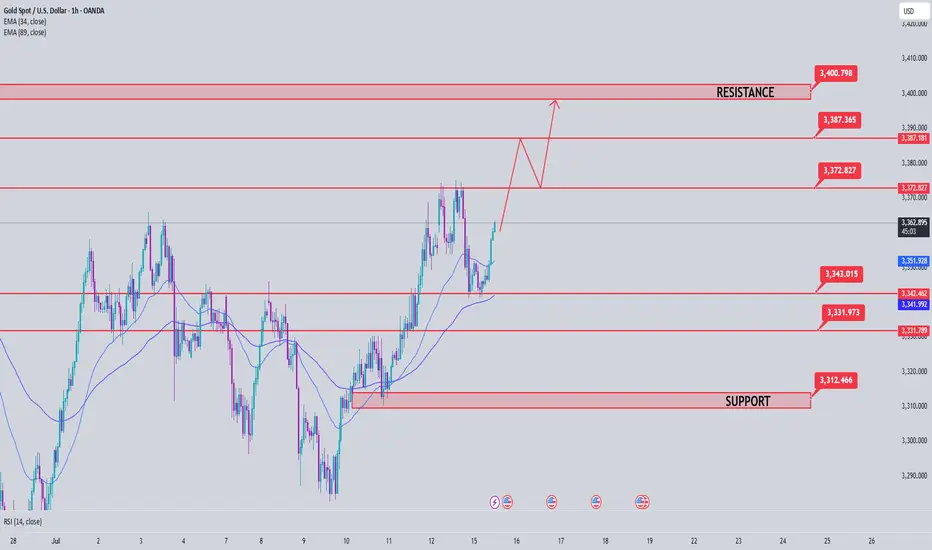
Gold Price Analysis July 15Continued uptrend after touching the 3345 buy zone
As analyzed at the beginning of the week, gold price has touched the buy zone around 3345 and continues to maintain the bullish wave structure, heading towards the 3400 resistance zone.
Currently, if gold breaks the 3373 mark, the uptrend is likely to be further strengthened. At that time, it is not advisable to trade against the trend, especially when the buyers completely control the market.
However, in case gold falls below the 3343 support zone (the resistance level in yesterday's US session), the current uptrend may be temporarily interrupted. At that time, the market will need to form a new momentum to establish the next trend.
🔑 Important price zones:
Support: 3343 – 3330 – 3313
Resistance: 3373 – 3387 – 3400
📌 Trading strategy:
Hold BUY order at 3345, expected target 3400
Activate SELL order if there is a clear price rejection signal at 3373 or 3387 (with confirmation of selling pressure)
SELL at 3400 if the strong resistance zone reacts clearly