GoldWe have a strong bullish move and again we are moving on a bullish flag,price had just retested previous resistance turned into support so now I'm expecting buys till previous HOD
CFDGOLD trade ideas

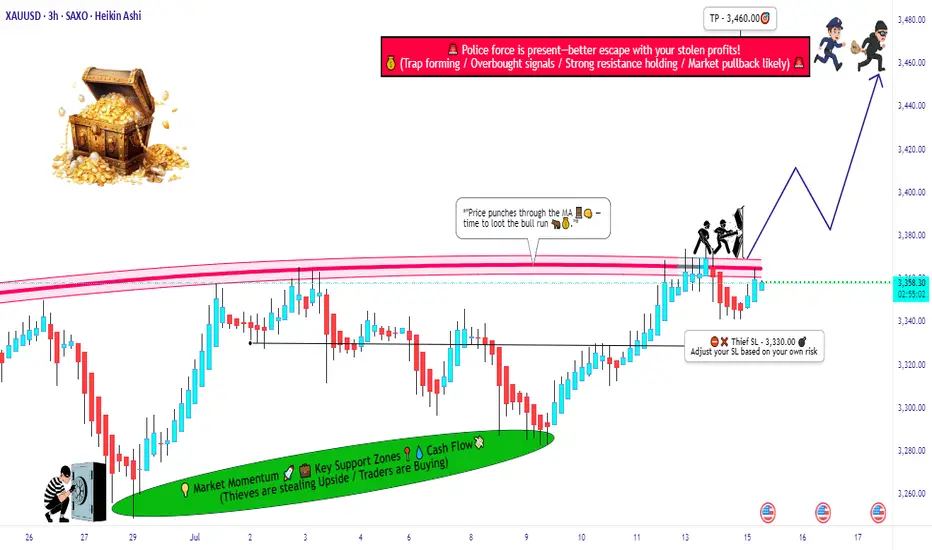
GOLD (XAU/USD) MA Breakout – High-Probability Long Setup!💰🚨 GOLD HEIST ALERT! XAU/USD MASTER PLAN (Thief Trading Style) 🎯
🔥 Steal Pips Like a Pro – High-Probability Gold Breakout Strategy! 🔥
🎯 Thief Trading’s GOLD Heist Strategy (Swing/Day Trade) �💸
👋 Hey there, Market Pirates & Profit Snatchers! 🌍✨
Based on our 🔥Thief Trading Style🔥 analysis, we’re plotting a major heist on XAU/USD (GOLD). The plan? Buy the breakout, escape before the cops (resistance) arrive! 🚔💨
📈 ENTRY ZONE: The Heist Begins!
🚀 "Wait for the MA Breakout (3400) – Then Strike!"
Bullish Confirmation: Enter on a 15M/30M pullback after MA breakout.
Thief’s Trick: Use Buy Stop above MA or Buy Limit near swing lows for best risk-reward.
DCA/Layering Strategy: Deploy multiple limit orders to maximize gains.
🔔 Set an ALERT! Don’t miss the breakout – thieves move fast! ⏳
🛑 STOP LOSS: Protect Your Loot!
📍 Thief’s SL Placement: 3330.00 (4H Swing Low) – Adjust based on your risk & lot size.
⚠️ WARNING: If using Buy Stop, DO NOT set SL until after breakout – unless you love unnecessary losses! 🔥
🎯 TARGET: Escape with the Gold!
🏴☠️ Take Profit Zone: 3460.00 (or Exit Early if Bears Show Up!)
Scalpers: Only trade LONG side – use trailing SL to lock in profits.
Swing Traders: Ride the wave but watch for resistance traps!
📰 MARKET CONTEXT: Why This Heist?
Neutral Trend (But Bullish Potential! 🐂)
Key Factors: Geopolitics, COT Data, Macro Trends, Sentiment Shift
🚨 News Alert: Avoid new trades during high-impact news – trailing SL saves profits!
💥 BOOST THIS HEIST! (Like & Share for More Pips!)
💖 Hit the 👍 Boost Button to strengthen our Thief Trading Crew!
🚀 More Heist Plans Coming Soon – Stay Tuned!
⚠️ DISCLAIMER (Stay Safe, Thieves!)
This is NOT financial advice. Do your own analysis & manage risk.
Markets change fast! Adapt or get caught.
🎯 Happy Trading, Pirates! Let’s Steal Some Gold! 🏴☠️💛
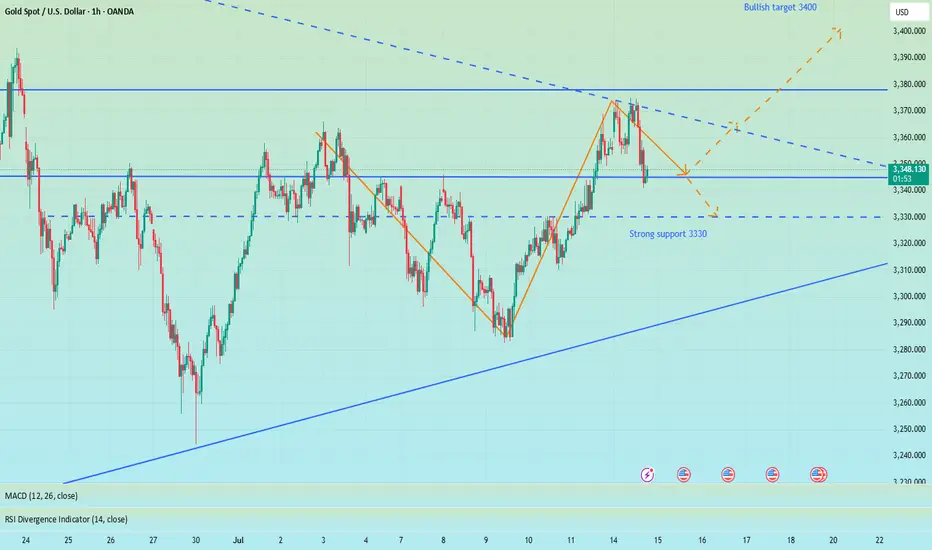
XAUUSD: Trading Strategy Before the US SessionAhead of the release of key US session data, gold is oscillating in a narrow range between $3340 and $3375. The daily chart shows a balance between bulls and bears. On the 4-hour chart, $3375, which coincides with the 61.8% Fibonacci retracement level, serves as a critical watershed for the market trend.
In terms of trading strategy, it's advisable to trade within the aforementioned range and follow the trend once there is a clear breakout. If gold stabilizes above $3360 and breaks through $3375, it could rally towards $3400. Conversely, if it falls below $3340 and loses the $3310 - $3320 range, it may test $3300. It's essential to confirm the direction in conjunction with fundamental news and avoid blind trading.
I am committed to sharing trading signals every day. Among them, real-time signals will be flexibly pushed according to market dynamics. All the signals sent out last week accurately matched the market trends, helping numerous traders achieve substantial profits. Regardless of your previous investment performance, I believe that with the support of my professional strategies and timely signals, I will surely be able to assist you in breaking through investment bottlenecks and achieving new breakthroughs in the trading field.

Today's summary and tomorrow's market forecast📰 News information:
1. Focus on tomorrow's CPI data
2. Bowman's speech at the Federal Reserve
3. Tariff information outflows and countries' responses to tariff issues
📈 Technical Analysis:
Bros, I had some things to deal with just now so I went out for a while. Now I come back to share my ideas. When the market is blindly chasing longs, I chose to give a bearish trading opportunity. I know that after I proposed the idea of shorting to test the support level of 3340-3330 below, many people were skeptical and even looked at it with a sarcastic attitude. After all, most people in the market are long. But facts and results have proved that only by following the trend can there be better room for operation. When doing transactions, you must first have a clear goal. Those who follow the crowd will often only blame their mistakes on others or luck.
Regarding the arrangements for future trading, first of all, 3375-3385 above is still an important short-term resistance. If today's closing is above 3360, then 3375 will most likely be tested again during the Asia-Europe trading session. Once it goes up again, it is very likely to break through the resistance area of 3375-3385. Before the US data, the price may stay at 3390 or 3400. On the contrary, if today's closing is below 3360, then the price still has room for adjustment. In this way, 3340 will not be the low point of this week. The bearish volatility in the Asian and European sessions will also test the strong support of 3330-3320.
In addition to investment, life also includes poetry, distant places, and Allen. Facing the market is actually facing yourself, correcting your shortcomings, facing your mistakes, and exercising strict self-discipline. I share free trading strategies and analysis ideas every day for reference by brothers. I hope my analysis can help you.
OANDA:XAUUSD PEPPERSTONE:XAUUSD FOREXCOM:XAUUSD FX:XAUUSD TVC:GOLD FXOPEN:XAUUSD
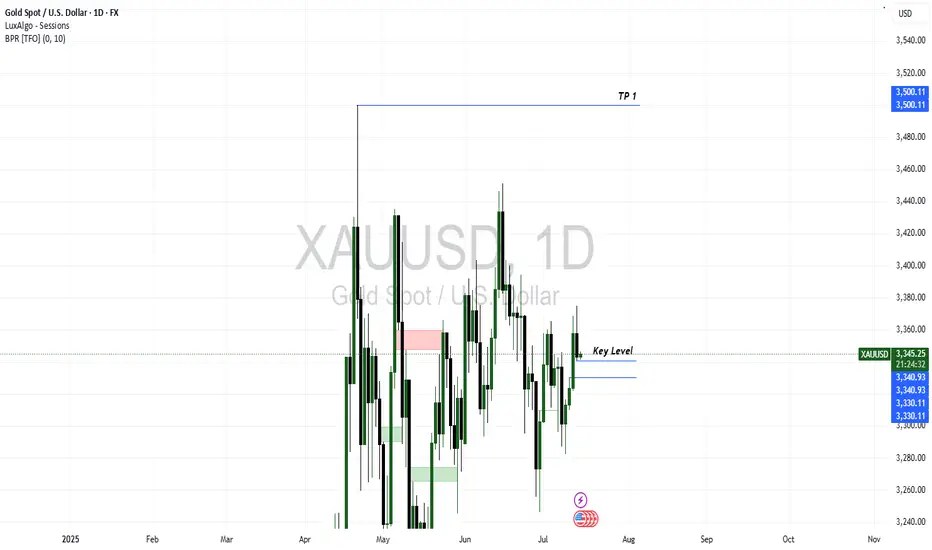
XAUUSD Trade ideaEnter a buy position based on the entry model at the key level at about 3340.93. The first-level target is about 3500.11.

Gold bulls explode to new highs
💡Message Strategy
Gold prices hit a three-week high near $3,375 an ounce in early trading on Monday before retreating. Gold prices are under selling pressure again as buyers failed to sustain higher levels hit earlier on Monday.
Gold prices hit a three-week high in early Asian trading on Monday, supported by safe-haven demand after U.S. President Trump threatened to impose 30% tariffs on imports from the European Union and Mexico.
Gold prices encountered resistance just below the 23.6% Fibonacci retracement of April’s record rally at $3,377 an ounce in early Asian trading on Monday.
Despite the pullback, the 14-day relative strength index (RSI) continues to show additional upside as the indicator is well above its midline, currently near 54.20.
📊Technical aspects
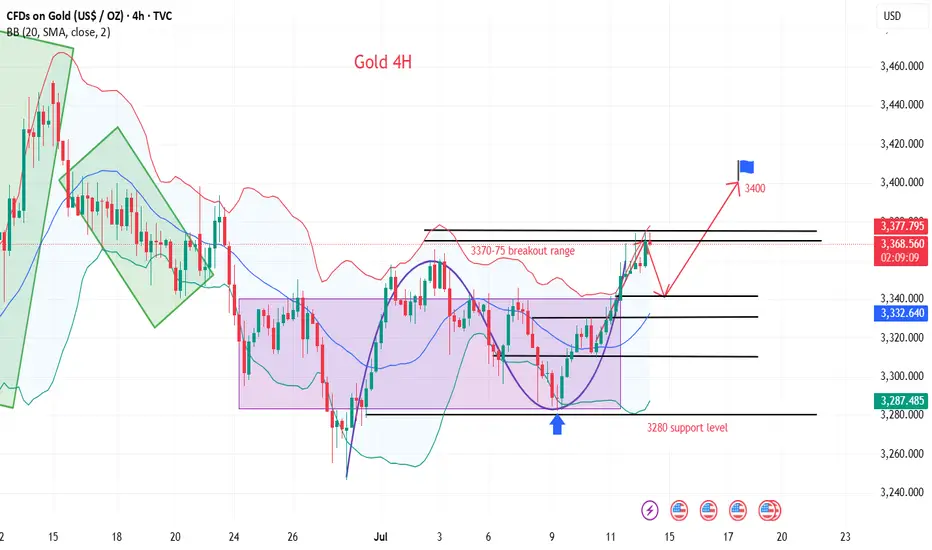
Gold 4H chart. From the perspective of the morphological structure, gold has recently been rising in lows, and has been oscillating upward along the rising trend line, moving out of the standard rising trend wave rhythm. On Friday night, the bulls once again made a strong effort to break through the key pressure level of 3345.0, further opening up the bullish upside space, and the market outlook continues to see the bullish continuation of the market.
According to the comprehensive MACD indicator, the fast and slow lines are running above the 0 axis, indicating that the bullish power dominates the market trend. In terms of strategy, it is recommended to follow the bullish rebound wave trend to find support levels and ambush long orders.
💰Strategy Package
Long Position:3335-3340,SL:3320,Target: 3390-3400
Gold Price Update: Key Breakout Level in Sight – Watch $3,434! Technical Analysis – XAU/USD
Current Price: $3,371
Gold is trading inside a rising wedge pattern with strong resistance at $3,434.
A daily candle close above $3,434 could trigger a breakout toward:
🎯 Target 1: $3,540
🎯 Target 2: $3,756
If rejected at resistance, price may drop to:
⚠️ Support 1: $3,325
⚠️ Support 2: $3,001 (major weekly support)
🌍 Fundamental Outlook
CPI Data Impact:
Higher CPI → Gold bearish (rate hikes expected)
Lower CPI → Gold bullish (rate cuts or pause likely)
Federal Reserve Policy:
Hawkish = Negative for gold
Dovish = Positive for gold
Other Drivers:
USD Strength
Geopolitical risks
Central bank gold buying

Analysis only for Monday & Tuesday (Smaller TF)Here I explain analysis for the small TF of the upcoming week. Thanks.

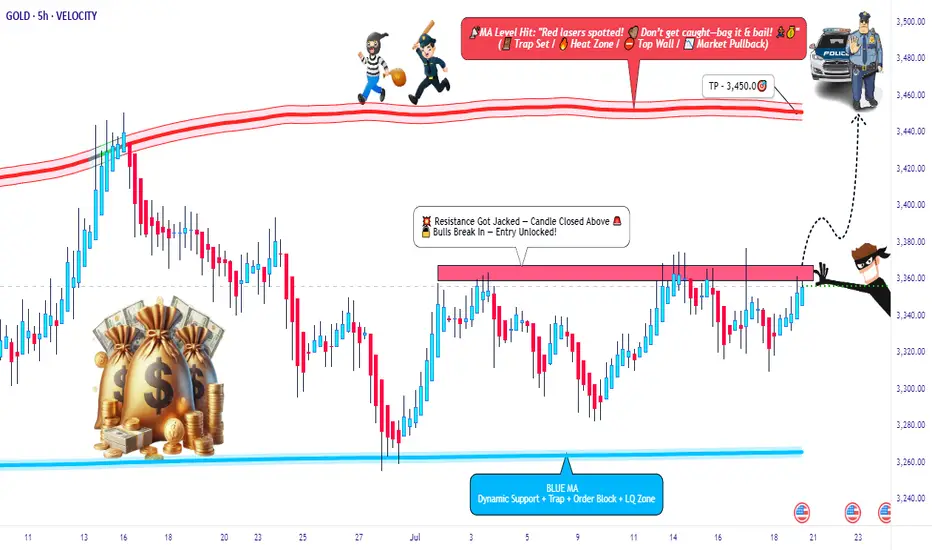
XAU/USD Breakout Playbook – Rob the Market!🚨💰 GOLD HEIST IN MOTION! | XAU/USD Thief Trading Strategy (Breakout Edition) 🏴☠️
🧠 Strategic Mindset | Not Your Average Chart Talk
Yo Market Bandits & Pip Hunters – welcome to the underground playbook!
This isn't your grandma’s chart breakdown – it’s a Thief Trading Takedown on XAU/USD (Gold), where we’re not chasing the market… we’re outsmarting it.
THE MASTER PLAN: Enter Like a Ghost, Exit Like a King 👑
📍 ENTRY POINT – The Break-In Begins!
💥 Breakout Level: Watch for 3370.00 resistance to crack – this is our green light.
🕵️♂️ Entry Style:
• Buy Stop above MA resistance zone (fast & clean)
• OR Buy Limit near swing low zones after confirmation pullback (sniper entry)
🧠 Thief Tip: Wait for the breakout to happen. No orders, no SL before it. Patience is profit.
🔄 Layer the Entry:
• Deploy DCA (Dollar Cost Averaging) or scaling entries with precision
• Build positions like stacking cash bags — smart, silent, and calculated
🛡️ PROTECT THE LOOT – Stop Loss Logic 💣
📍 SL Guide: 3310.00 (4H swing low – update as price structure evolves)
🔥 SL ONLY comes after breakout. Set it too early? That’s how you get caught.
⛔ No pre-breakout orders. No early SL. Stay invisible till it's go time.
🎯 THE ESCAPE – Profit Like a Phantom 🚀
💸 Take Profit: 3450.00
📉 Scalpers: Trail SL as price pushes – never give back stolen pips
🌀 Swing Traders: Monitor resistance layers – don’t let the bulls turn on you
🧭 CONTEXT – Why This Setup?
🔍 Macro Snapshot:
• Trend: Neutral/Bullish Lean
• Influencers: COT reports, geopolitical tension, dollar flows
• Sentiment Shifting – watch the herd, but don’t run with it
🗞️ News Risk: Don’t get wrecked by events! Avoid entries during high-impact news.
🚨 Trailing SL is your best weapon during volatility.
⚡ POWER UP THE CREW – Support the Movement
💬 Drop a comment, hit the 🔥 like button, and share with your trading gang
More Thief Trading blueprints coming soon – bigger breakouts, cleaner setups
⚠️ STAY SHARP, THIEVES!
This ain't financial advice – it’s an outlaw’s edge on the market.
Trade smart. Risk well. Protect the bag.
🏴☠️ XAU/USD GOLD HEIST IN PROGRESS... Join the Movement. Let’s Rob the Market.
XAUUSD will end July negative.During and post CPI, we saw the price of gold spike up towards 3366 to create a sell order block and quickly reversed to 3310 indicating weakening in bullish momentum. With all the geopolitical tensions easing up, XAUUSD price will respect the technical view. Currently, price seems to be printing a bearish flag pattern. We can expect sharp declines from XAUUSD next week.

XAUUSDXAU/USD, the trading pair for gold (XAU) against the US dollar (USD), reflects the value of one ounce of gold in dollars. When traders short XAU/USD, they anticipate a decline in gold prices relative to the dollar—often due to stronger U.S. economic data, rising interest rates, or reduced geopolitical tensions, which boost the dollar’s appeal over gold. This pair is sensitive to inflation, Federal Reserve policies, and global risk sentiment, making it a key instrument for both hedging and speculation in volatile markets.

Gold underwear: 3300-3310Gold underwear: 3300-3310
As shown in the figure:
Today, the gold price is once again facing the test of the 3300-3310 support level
As today's title: Gold price underwear is coming
A new round of long-short battle is about to break out
As early as next week, there is a high probability that a historic market will be ushered in.
From the macro structure, the gold price has reached the end of the shock, and the long and short sides are currently in serious disagreement.
Surging stalemate range: 3310-3375
As of now, the gold price: 3315-3320 range shock
The next strategy is very clear:
1: As long as the gold price is above 3310, it is the best range for bottom-fishing and long, and the stop loss is set at 3300-3295.
2: Once it breaks through 3310, bulls need to be cautious and be alert to the possibility of a sharp decline. As long as the gold price stabilizes below 3300, it can be directly transferred to short-term trading, and the stop loss is set at 3310-3315.
I prefer to follow the big trend and see it as a strategy to buy at a low price.
Buy: 3310-3315
Stop loss: 3300-3295
Target: 3350-3375

XAUUSD still on retest Gold is currently holding rising channel. We just secured sell opportunity at 3329 and TP HIT at 3311 .
What's possible scanarios we have?
▪️I'm looking for Buying trade As I mentioned is my previous commentary 3310-3312 is the buying area .if H4 remains above then keep buy set targets at 3335 then 3345.
▪️ Secondly 3290 is the perfect area of buying if its still fall .
-> Moral of Day buy the Dips
Additional TIP:
Below 3310 -3308 I will Activate my resell and hold till 3300 then 3290
#XAUUSD

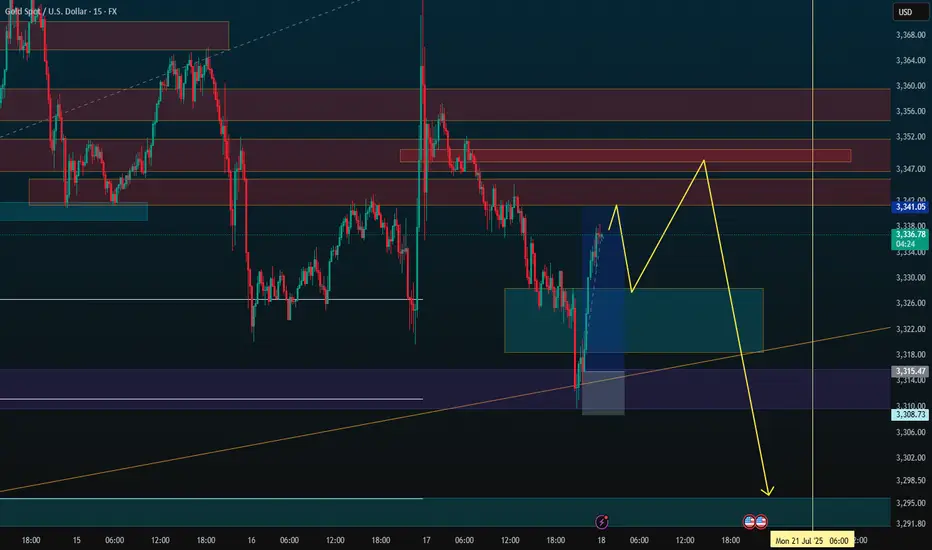
GOLD BUY M15 Gold (XAU/USD) 15-Minute Chart Analysis
Analysis Type: Bullish Reversal Setup
Date: July 17, 2025
Timeframe: 15-Minute Chart (TVC: Gold)
---
Key Levels:
Entry Zone (Demand Zone): Around 3320 – 3315
Stop Loss (SL): 3314
Target (TP): 3338
Important Resistance Levels:
3327.67
3332.16
Final Target at 3338.30
---
Market Structure:
Break of Structure (BOS): Identified around the 3324 level showing previous lows being taken.
Change of Character (CHoCH): Signals potential reversal from bearish to bullish trend.
Demand Zone: Highlighted in purple, where price is expected to reverse and bounce upward.
---
Trade Plan:
Price is currently within a strong demand zone, suggesting a potential bullish reversal.
The idea is to enter long (buy) near the 3320–3315 zone, with a tight stop-loss at 3314 to minimize risk.
If the reversal plays out, price is expected to push up towards the first resistance at 3327.67, continue to 3332.16, and potentially hit the target of 3338.
---
Conclusion:
This setup offers a favorable risk-to-reward ratio, anticipating a bounce from the demand zone with confluences like BOS and CHoCH supporting the bullish bias. It’s a scalp to intraday long trade idea targeting a retracement or reversal.

Gold Slips in London – $3,296 Incoming?📉 XAUUSD 1H Bearish Analysis – July 17, 2025
Gold (XAUUSD) is showing clear signs of bearish momentum on the 1-hour chart. After forming a local high around the $3,346–$3,347 region, price was sharply rejected and has since maintained a lower high structure. This rejection came right after the London session began, confirming that institutional volume is likely favoring the downside for now.
The previous few sessions show multiple failed attempts to break above the $3,346–$3,365 range. Sellers are consistently stepping in near those zones, marking a strong supply area. Meanwhile, recent candles have broken below the intraday support around $3,327.74, showing bearish continuation is underway.
Session activity is also in favor of the bears. The current London session opened weak, following a failure to hold above the previous session highs. Typically, gold experiences volatility during London and New York overlaps, and given the current structure, the pressure seems tilted to the downside.
From a broader perspective, the lower highs and lower lows on the 1-hour chart confirm a short-term downtrend. Price is now hovering just above $3,319 support—if this level is taken out cleanly with volume, it opens the path to deeper targets.
________________________________________
📌 Trading Setup (Short Bias)
• Entry: $3,327.74 (breakdown zone)
• Stop-loss: $3,346.29 (above last supply rejection)
• Take-Profit 1: $3,319.69
• Take-Profit 2: $3,311.62
• Take-Profit 3: $3,296.28
• Take-Profit 4 (extended): $3,282.66
________________________________________
If price manages to hold below $3,328 with consecutive rejections on any pullback, this bearish thesis remains valid. A breakdown below $3,311 would likely trigger momentum-driven selling toward $3,296 and potentially $3,282. However, any 1H close back above $3,346 would invalidate the current setup and favor a temporary bullish retracement.

Gold - 1 Hour Analysis (Long)After a series of dump , now we are seeing some bullish pattern. The most recent candle failed to close above 3375 , therefore I am anticipating the price will be targeting the SSL to continue higher.
I am anticipating that the price will move to the 4H OB , and I will be looking for bullish confirmation to enter the trade. Price may not reach to my target after mitigating the 4H OB , therefore manage the trade properly.
How I will take the trade?
If price is respecting the 4H OB , I will be taking multiple trades. For example , 1:2 or 1:3 along the way until it reach to my target. I will not be holding through the whole process.

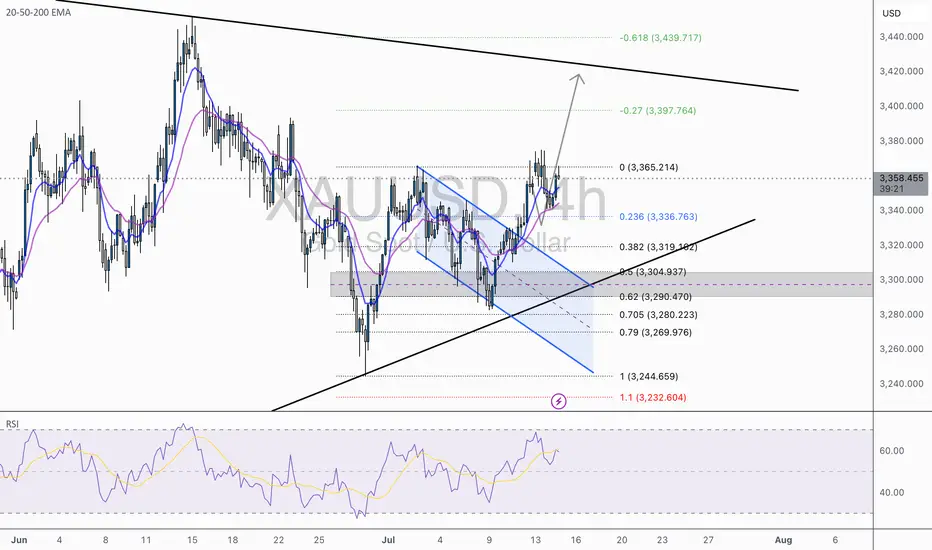
XAU/USD 1H – Bullish Breakout in Play | Eyes on 3,400+XAU/USD has officially broken out of a falling wedge pattern, triggering a classic bullish continuation setup. The rejection off the 0.618–0.705 fib retracement zone ($3,280–$3,290) acted as a powerful launchpad, pushing price above the mid-structure confluence and EMAs.
✅ Key Technical Highlights:
Structure Break: Clear bullish breakout from descending wedge + EMA crossover confirmation (20/50 over 200).
Fibonacci Anchors: Price respected the golden pocket (0.618–0.705), now aiming for full fib extension targets.
Targets:
🎯 TP1: 3,397 (-0.27 fib)
🎯 TP2: 3,440 (-0.618 fib / upper wedge trend-line resistance)
Support Zone: 3,304 – 3,319 (0.5–0.382 fib zone), now acting as fresh demand area.
RSI: Rebounding from 50 with momentum, no divergence, suggesting room for continuation.
🔔 Bullish Scenario:
As long as price holds above the breakout retest zone (≈3,336), momentum favors the bulls with high probability toward 3,400+. Clean higher highs and higher lows confirm trend alignment.
⚠️ Invalidation Level:
Break and close back below 3,304 would shift this from breakout to fakeout — watch for bearish pressure toward 3,280 if that occurs.
📌 Wright Way Outlook:
Momentum is on the side of the bulls. With fundamentals aligned and structure broken, this setup favors precision swing entries with clean RR.
Stay patient, stay tactical. Trade the Wright Way.
Gold trade short now 📉 Short Trade Signal – XAU/USD (15m Chart)
⚠️ Signal Type: Short
⏰ Timeframe: 15 minutes
📸 Chart Reference: Price consolidating after bullish impulse; resistance formed
🔽 Trade Details
Parameter Value
Entry (Sell) 3,345.00 (current level)
Stop Loss (SL) 3,368.00 (above recent high/resistance)
Take Profit (TP) 3,309.00 (demand zone / imbalance fill)

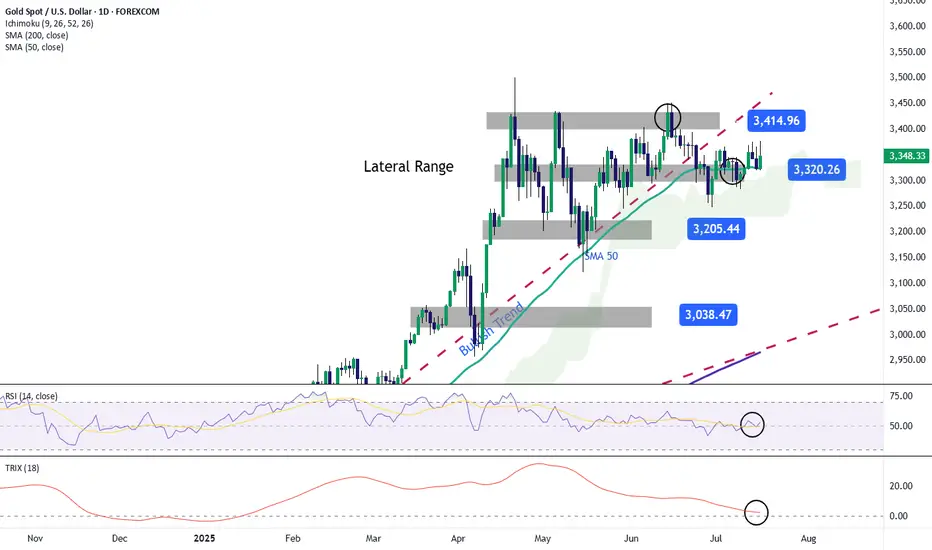
Gold Rises Again Above $3,300Today's session marked a new upward move for gold, with gains of more than 1%, pushing prices above the key $3,300 per ounce level. For now, the bullish bias has remained firm shortly after reports suggested that the U.S. government may be preparing to move away from the current Federal Reserve Chair, Jerome Powell, mainly due to the Fed’s failure to deliver on the administration's broader expectation of cutting interest rates in the short term. This development has increased political risk in the United States and has led gold to act once again as a safe-haven asset in the short term.
Sideways Range Remains Active
Despite the recent rebound in gold prices, a consolidated sideways range continues to dominate, with resistance marked around the $3,400 level and support near $3,200 per ounce. Although recent fluctuations have not yet been enough to break out of the channel, they have shown a steady increase in buying pressure that, if sustained, could lead gold to retest its recent highs.
Indicators Still Show Neutral Bias
At the moment, the RSI indicator remains close to the neutral line of 50, and the TRIX indicator is also moving sideways near the zero level. Both signals suggest that recent price momentum and the average strength in moving averages are starting to stabilize, pointing to a lack of clear direction. Unless the indicators begin to show signs of a momentum shift, the sideways channel is likely to remain in place and could serve as a key catalyst for maintaining the market’s neutral sentiment in the near term.
Key Levels to Watch:
$3,400 – This remains the level of historic highs in gold. A breakout above this area could reactivate a strong bullish bias, potentially paving the way for a more sustained uptrend in the short term.
$3,300 – This is the current barrier, aligned with the 50-period simple moving average, and may serve as an important pivot point. If price action stays above this level, buying pressure could begin to gain more traction in the gold market in the short term.
$3,200 – This remains a key support level, acting as the most critical reference point for selling activity in recent weeks. A move back toward this level could trigger the start of a new bearish trend.
Written by Julian Pineda, CFA – Market Analyst
Gold Analysis and Trading Strategy | July 16✅ Fundamental Analysis
The U.S. Dollar Index has risen for four consecutive trading days, reaching a high of 98.70, which continues to weigh on gold prices denominated in dollars. Recently, the Trump administration imposed a 30% tariff on goods from the European Union and Mexico, and plans to issue tariff notices to Indonesia (19%) and several other “smaller countries” (around 10%), triggering global trade tensions. Meanwhile, the ongoing escalation of the Russia–Ukraine conflict has increased safe-haven demand, providing some support for gold.
✅ Technical Analysis
Gold posted a long upper shadow bearish candlestick yesterday, indicating weak upward momentum and selling pressure near recent highs. The daily chart has shown multiple failures to break above previous highs, signaling fading bullish strength. Currently, price action remains in a high-level, low-volume consolidation, with both daily and weekly charts showing repetitive sideways movement and no clear breakout direction.
On the 4-hour chart, gold was rejected near the upper range at $3375 and fell sharply. After breaking below the mid-range support, the price found minor support near the lower band. The overall structure remains a wide-range consolidation, lacking sustained directional movement.
🔴 Key Resistance Levels: 3345–3350; if broken, gold may test the 3400 psychological level.
🟢 Key Support Levels: 3322–3330; if breached, prices could decline further toward 3300.
✅ Trading Strategy Reference
🔺 Long Position Strategy:
🔰If the price pulls back to below the $3325–$3330 zone and shows signs of support, consider entering a light long position. Set a stop-loss below $3310, targeting $3340–$3350–$3360.
🔻 Short Position Strategy:
🔰If the price rebounds to the $3344–$3350 resistance zone and stalls, consider shorting on strength. Set a stop-loss above $3355, with targets at $3320, $3310, and $3300.
✅ Risk Warning
The U.S. PPI data will be released today. If the data significantly exceeds expectations and inflationary pressures rise, gold may come under renewed selling pressure and potentially break below the key $3300 support level. Conversely, if the data is moderate, it could ease market concerns and help stabilize gold prices.

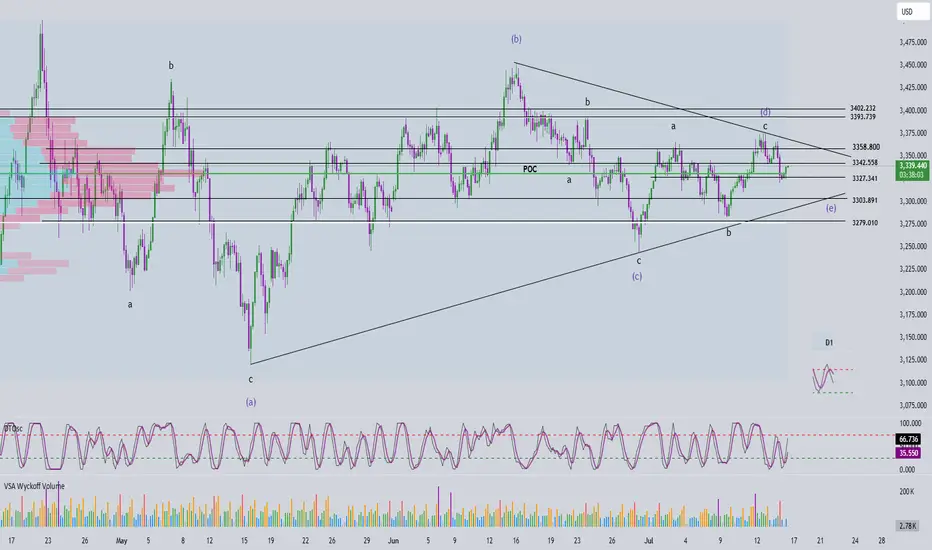
Elliott Wave Analysis – XAUUSD July 16, 2025🔄 Momentum Analysis
D1 timeframe: Momentum is currently reversing to the downside, suggesting that the price may continue to decline or move sideways in the short term.
H4 timeframe: Momentum is rising, indicating that the current recovery may continue. The next resistance zones to watch are 3342 and 3358.
🌀 Elliott Wave Structure
At present, price action is being compressed within a contracting triangle corrective pattern, with its range narrowing further—signaling market consolidation. We should closely monitor for signs of a breakout that could end this correction.
Based on the current wave structure, it is expected that wave d (green) has completed, and the current downward move is likely part of wave e (green).
The trading strategy focuses on waiting for the price to approach the lower boundary of the triangle—drawn from the low of wave a to the low of wave c—looking for confluent support areas near this trendline to identify a potential BUY opportunity.
🎯 Target & Trade Plan
BUY ZONE: 3303 – 3300
Stop Loss (SL): 3290
Take Profits (TP):
- TP1: 3327
- TP2: 3358
- TP3: 3402