Daily gold analysisDaily gold analysis
Sell trade with target and stop loss as shown in the chart
The trend is down and we may see more drop in the coming period in the medium term
All the best, I hope for your participation in the analysis, and for any inquiries, please send in the comments.
He gave a signal from the strongest areas of entry, special recommendations, with a success rate of 95%, for any inquiry or request for analysis, contact me
CFDGOLD trade ideas
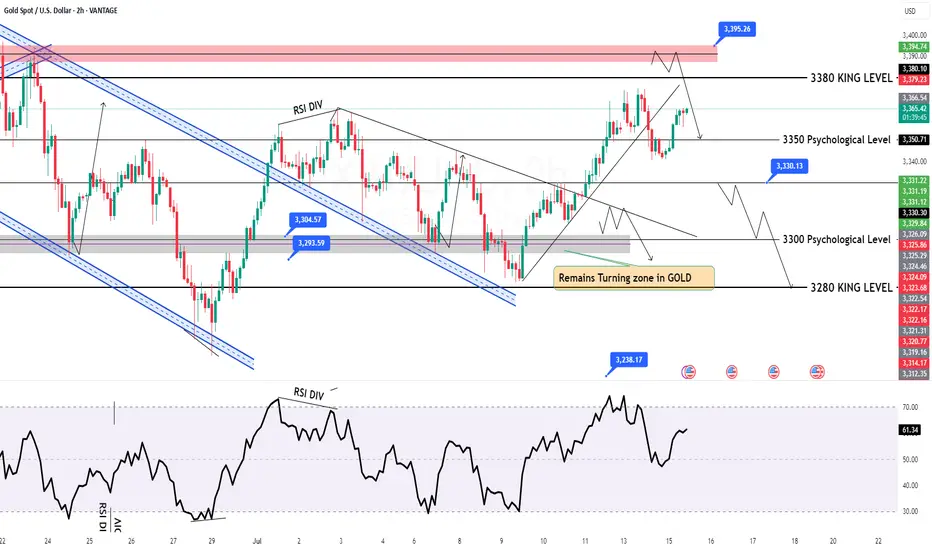
GOLD Intraday Chart Update For 15 July 2025Hello Traders,
Welcome to the US CPI Day, as you can see that market is in tight range for now and all eyes on the breakout for now
Only clear breakout of 3380 we will consider market will be bullish towards 3400 & 3425
If markets sustains below 3335 it will move towards 3305 or even 3285
All eyes on US CPI
Disclaimer: Forex is Risky

XAUUSDGold was updated on a 15-minute timeframe and appears to be in a correction to the 3357 range.

Big Week for Markets: U.S. CPI Tomorrow – What It Means for GoldThis week is packed with news, but the main focus is the U.S. CPI report dropping tomorrow.
🗓 Key Event: U.S. CPI Report
📍 July 15, 2025 | 12:30 p.m. UTC
The CPI report measures inflation and heavily influences the Fed’s rate decisions. Last month’s CPI came in at 2.4% vs. 2.5% expected, following 2.3% vs. 2.4% in April. While it seems inflation is rising, the bigger picture shows stable annual inflation in the 2.3%–3.0% range, keeping things under control—likely the reason Trump is pressuring Powell to cut rates.
Market expects June CPI to be 2.7%.
🤔 Possible Scenarios:
1️⃣ CPI > 2.7%: Bullish for DXY 📈. The stronger the print, the bigger the spike, but I see this scenario as less probable.
2️⃣ CPI < 2.7%: Bearish for DXY 📉. We may see a USD dump, though likely shallow since CPI could still be higher than previous months.
✨ What About Gold?
I don’t expect a major reaction in gold:
✅ Higher CPI? Gold often benefits as an inflation hedge.
✅ Lower CPI? Also supportive for gold as it weighs on the USD.
🔍 Technical Outlook:
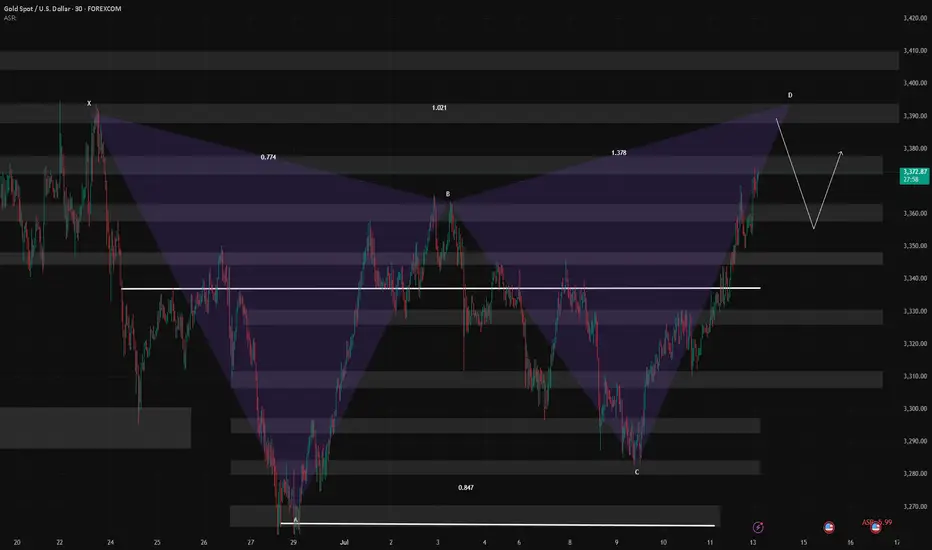
Gold has been trading within a triangle since April 22, forming lower highs and higher lows. We may currently be in Wave D (Elliott Wave), aiming toward the triangle’s upper boundary slightly above $3,400 resistance. After that, Wave E may develop – but that’s a story for another post.
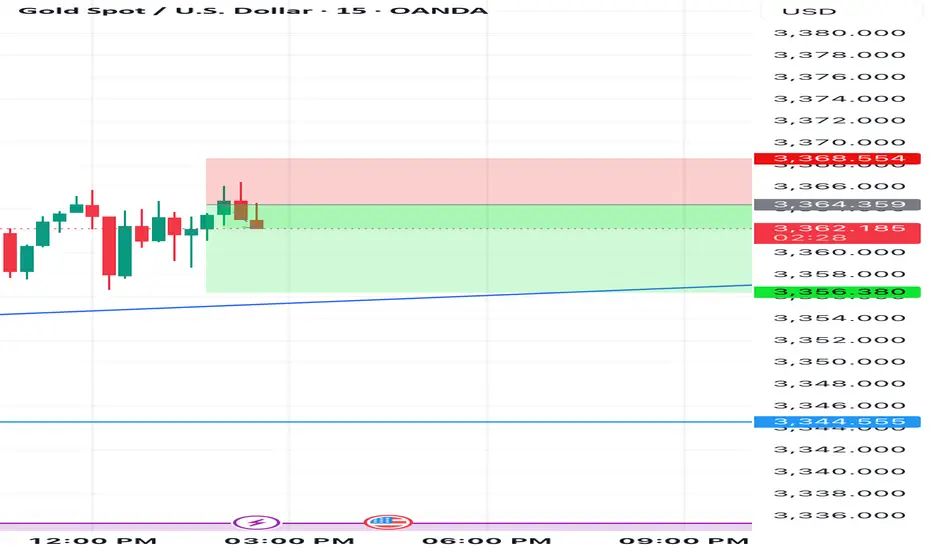
GOLD: Long Signal Explained
GOLD
- Classic bullish formation
- Our team expects growth
SUGGESTED TRADE:
Swing Trade
Buy GOLD
Entry Level - 3352.0
Sl - 3346.8
Tp - 3362.4
Our Risk - 1%
Start protection of your profits from lower levels
Disclosure: I am part of Trade Nation's Influencer program and receive a monthly fee for using their TradingView charts in my analysis.
❤️ Please, support our work with like & comment! ❤️

XAUUSD: SCALPING SIGNALEntry: 3355:66
SL: 3369
TP: 3341 (continue unless any bullish pattern emerged)


7/14: Sell High, Buy Low Within the 3400–3343 Range for GoldGood morning, everyone!
At the end of last week, renewed trade tariff concerns reignited risk-off sentiment, prompting a strong rally in gold after multiple tests of the 3321 support level. The breakout was largely driven by fundamental news momentum.
On the daily (1D) chart, the price has fully reclaimed the MA60 and broken above the MA20, signaling an emerging bullish trend. The key focus for this week includes:
Monitoring whether MA20 holds as support on any pullbacks
Watching the 3400 resistance zone for signs of exhaustion or continuation
From a 30-minute technical perspective, gold is currently trading within a short-term resistance band of 3372–3378, with a stronger resistance zone between 3387–3392. Key support levels are:
Primary support: around 3358
Secondary support: 3343–3332 zone
Given the recent increase in volatility due to geopolitical and macroeconomic headlines, flexible intraday trading is recommended within the 3378–3343 range, while broader trades can be framed around the 3400–3325 zone, still favoring a sell-high, buy-low approach.
Lastly, as we move into the mid-year period, I may have more personal commitments, and strategy updates could be less frequent. I appreciate your understanding, and as always, feel free to leave a message if you have any questions or need trading guidance—I’ll respond as soon as I can.

Gold begins bullish recoveryIon Jauregui – Analyst at ActivTrades
Gold posted a slight gain during Monday's Asian session, driven by renewed safe-haven demand amid escalating trade tensions between the United States and several key economies, as well as rising geopolitical uncertainty surrounding Russia and Ukraine.
The initial uptick in gold was supported by the announcement of 30% tariffs by Donald Trump on Mexico and the European Union, in addition to harsher levies on Japan, South Korea, and Brazil. The prospect of a renewed wave of protectionism has raised concerns over global economic stability, boosting gold's appeal as a safe-haven asset. Added to this is geopolitical tension following reports that Trump is planning to send offensive weapons to Ukraine, potentially escalating the conflict with Russia. These factors have reinforced risk-off sentiment in the markets.
However, the strength of the US dollar (DXY +0.1%) and anticipation ahead of the US CPI data, due Tuesday, are capping gold’s upside. Higher-than-expected inflation could reinforce expectations of a tighter monetary policy from the Federal Reserve, which would weigh on precious metals.
After reaching an intraday high of $3,361.42 per ounce, the Asian market closed lower, leaving gold at $3,356.66 per ounce, a level at which it has since consolidated ahead of the European open. This behavior reflects a technical pause in the initial bullish momentum, with the current point of control aligning with that same price zone, suggesting a temporary neutralization of buying pressure. The RSI at 54% confirms a lack of strength, while the MACD indicates a potential upward directional shift with a signal line crossover and a modestly green histogram to start the week. Moving average crossovers show the 50 and 100 SMAs supporting the bullish push that began last Wednesday. Gold’s next decisive move may depend on upcoming US inflation data and developments in geopolitical tensions.
Silver, meanwhile, stood out with a sharp 1.4% surge to $39.493 per ounce, its highest level since 2011, while platinum and copper delivered mixed performances.
This week, gold prices could be driven by the confirmation of elevated US inflation data, which would strengthen the metal's role as a hedge against purchasing power loss, especially if doubts persist regarding the Fed’s policy stance. Added to this are rising geopolitical tensions due to Trump’s potential delivery of offensive weapons to Ukraine, further protectionist measures that could worsen the global trade war, and increased risk aversion should equity markets react negatively. In this context, gold is positioned as one of the main beneficiaries amid growing economic and political uncertainty.
*******************************************************************************************
The information provided does not constitute investment research. The material has not been prepared in accordance with the legal requirements designed to promote the independence of investment research and such should be considered a marketing communication.
All information has been prepared by ActivTrades ("AT"). The information does not contain a record of AT's prices, or an offer of or solicitation for a transaction in any financial instrument. No representation or warranty is given as to the accuracy or completeness of this information.
Any material provided does not have regard to the specific investment objective and financial situation of any person who may receive it. Past performance and forecasting are not a synonym of a reliable indicator of future performance. AT provides an execution-only service. Consequently, any person acting on the information provided does so at their own risk. Political risk is unpredictable. Central bank actions can vary. Platform tools do not guarantee success. Regulated status does not guarantee security.

check the trendIt is expected that the upward trend will pass the resistance range and with the stabilization above this range, we will see the continuation of the upward trend.
If the price crosses the support trend line, the continuation of the correction will be formed. And with the failure of the support range, the beginning of the downtrend of the scenario will be likely.

XAUUSD Analysis : Bullish Move Toward Key Resistance + Target🟩 Overview:
Gold is currently showing a clear bullish breakout on the 2-hour timeframe. The market structure has shifted from a downtrend into a bullish phase, with price now approaching a critical Reversal Zone. Let’s break down the key levels, structure shifts, and potential trade opportunities.
🔍 1. Structure Shift – Trendline Break & BOS Signals:
The price previously followed a Blue Ray Descending Trendline, which acted as dynamic resistance and guided the bearish trend.
As highlighted, “Blue Ray Always Continue Trend” – but in this case, we’ve seen a clean Break of Structure (BOS) that invalidated the bearish setup.
A Minor BOS occurred first, which hinted at weakening selling pressure.
Later, a Major BOS confirmed the bullish transition as the price broke above a key resistance level with strong momentum.
This transition was supported by consistent higher lows and a breakout above the descending resistance trendline — a classic reversal signal.
🟩 2. Demand Zone Reaction – Major Support Held Firm:
The Major Support Zone between $3,280 – $3,300 provided a strong base for buyers.
Multiple wick rejections and bullish engulfing patterns near this zone indicated aggressive buyer interest.
This support has now become the foundation for the recent bullish rally.
🎯 3. Next Target & Reversal Zone:
The current price is hovering around $3,358, showing strong bullish momentum.
The next major resistance area is marked between $3,380 – $3,400, identified as the Next Target + Reversal Zone.
This zone is critical — it aligns with a historical supply area and the previous market swing highs.
Traders should be cautious here, as price may react sharply. Reversal patterns (like bearish engulfing, pin bars, or double tops) could signal a potential retracement.
⚠️ 4. Trade Plan:
🟢 Bullish Bias (Short-Term):
If you entered from the support or trendline breakout, continue to hold long positions until price nears the reversal zone.
Trail stop-loss under the most recent higher low to secure profits.
🔴 Bearish Scenario (Near-Term Reversal Play):
Watch for bearish rejection patterns in the $3,380 – $3,400 zone.
If confirmation appears, potential short setups could offer a retracement back to $3,330 – $3,320.
📌 Key Levels Summary:
Major Support Zone: $3,280 – $3,300 ✅
Next Target + Reversal Zone: $3,380 – $3,400 ⚠️
Current Price: $3,358
Major BOS Level: Confirmed
Trendline: Broken with strong bullish pressure
🧠 Final Thoughts:
Gold has officially shifted gears. The bullish breakout is in motion, and the trendline break + BOS combo supports further upside — at least until the reversal zone is tested. However, this is also where the market could exhaust, making it crucial to monitor price action closely.
Stay patient, wait for confirmation, and let the levels guide your next move.

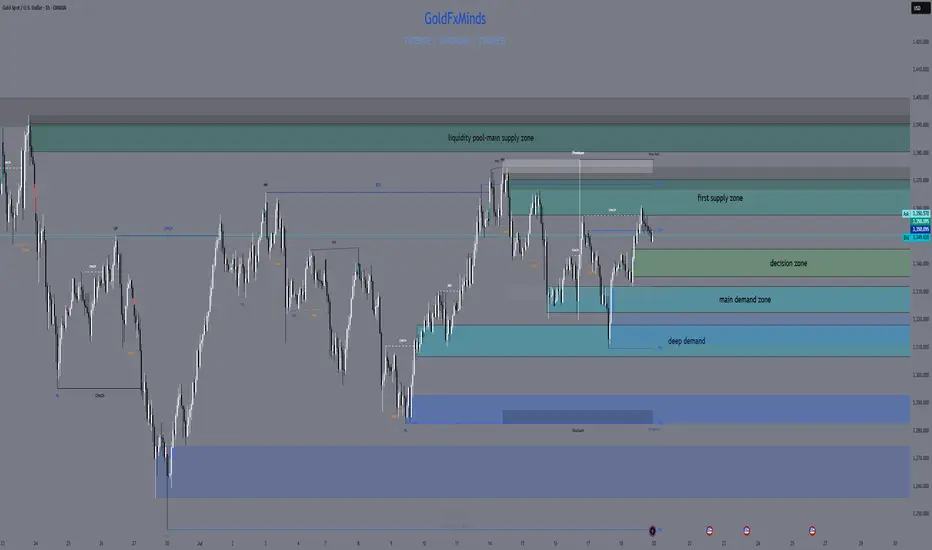
GOLD SNIPER PLAN – July 21, 2025Hey, GoldMinds! 🔥
This isn’t just another range day — it’s the type of market that separates disciplined snipers from impulsive chasers. If you want an edge, you need a plan that’s both sharper and more refined than what most see on their charts.
After a week full of fake breakouts, confusing swings, and whipsaw price action, gold is giving us the gift of clarity — but only for those patient enough to let the market reveal itself. Here’s how you cut through the noise and focus on the only zones that actually pay.
🚩 SELL ZONES
1. Primary Supply: 3358–3370
This is the fortress where real sellers pushed back hard. The structure here is crystal clear: last week’s failed breakout, sharp rejection, and a textbook H1/M30 order block. You want the sniper entry? Wait for price to tap here and only short if you see an instant, aggressive bearish response on M15/M5 — not just a slow drift.
2. Upper Liquidity Trap: 3380–3395
Classic trap for late buyers. This is where price loves to sweep stops and trigger emotional FOMO — but the real professionals are only interested if the move fails hard. Watch for a fake breakout and sudden reversal; this is the sniper zone for “fade and run” shorts.
⚪ DECISION ZONE (Neutral / Pivot)
Pivot Range: 3335–3345
Forget this level — it’s where amateurs get chopped up. There’s no order block, no real fair value gap, just confusion and false hope. A true sniper waits here, watching, not acting.
🟢 BUY ZONES
1. Main Demand: 3326–3332
This is the engine room for bulls: a refined order block, evidence of real absorption, and a history of sharp reversals. Don’t try to anticipate — let price come here and look for a snapback move on M15/M5. This is where patient buyers take their shot.
2. Deep Demand: 3311–3320
Where the fear turns to opportunity. This zone sits under recent lows, home to panic sweeps and emotional selling. Only consider a long if you see a powerful, impulsive bounce. The risk is high, but the reward for perfect timing is even higher.
BIAS & EXECUTION
Bias: Neutral, but watch for range expansion — the market is coiling for a bigger move.
Execution:
– Only act at the true edges, never in the middle.
– Let M5/M15 price action prove your setup — the market owes you nothing.
– If a zone breaks with momentum, do not fight the flow; stand aside or prepare for the next edge.
FINAL SHOT
This is where discipline pays.
Sniper trading is about letting the market come to you and striking only when your zone lights up with confirmation. Every other move is just noise, meant to shake out the impatient. Drop a comment below with the zone you’re watching most , follow and🚀🚀🚀 GoldFxMinds for daily sniper maps, and remember: in gold, only real structure pays.
Disclosure: Charts powered by Trade Nation. Educational content only.
Sell Zone Resistance 3356-3358Next Week Its Will first Go to 3354,3356
its First resistance with TP 3335,3325 and if cross this resistance or breakout 3362 then will next Sell entry will at 3374 with Tp 3310
Good luck.

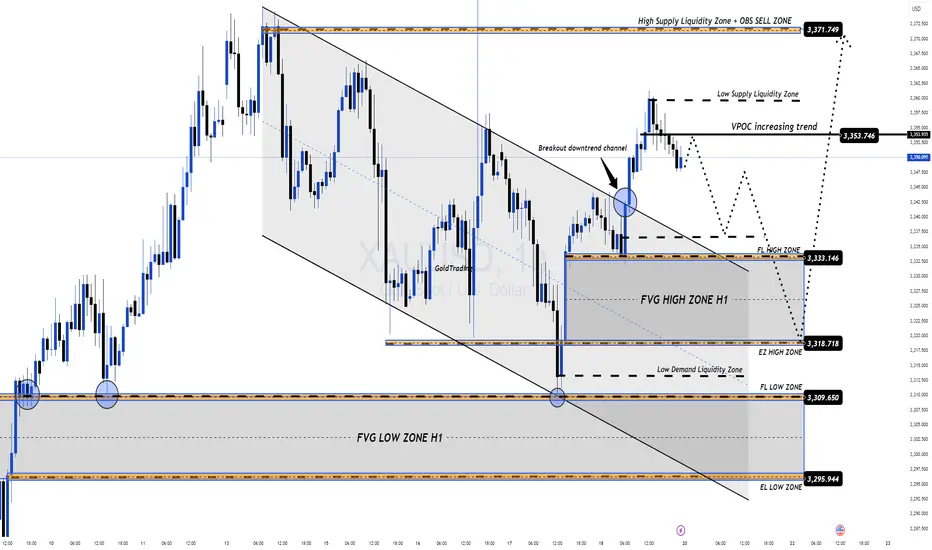
GOLD OUTLOOK – READY FOR THE NEW TRADING WEEK (JULY 21–25)GOLD OUTLOOK – READY FOR THE NEW TRADING WEEK (JULY 21–25)
🟡 Market Recap:
Gold made a strong bullish reversal at the end of last week, following a liquidity sweep at the FVG ZONE 3310. Price surged quickly toward the OBS SELL ZONE around 335x–336x.
However, by Friday’s close, price reacted to multiple confluences (OBS + FIBO zones) and closed below the VPOC level in the recent uptrend – forming a potential short-term top.
📉 Outlook for July 21–25:
No major economic data expected next week.
However, geopolitical tensions and trade policy concerns (e.g. tariffs, military conflicts) will be the key catalysts.
These events could lead to high volatility and liquidity grabs across the board.
🧠 Technical Perspective – H1 Mid-Term View:
Gold continues to form multiple unfilled Fair Value Gaps (FVGs) after strong bullish moves.
Recent price action created new high-zone FVGs, but lower FVGs remain untested.
🔁 Expected scenario: A potential retracement to fill the lower FVG zones (3310/3305), followed by another bullish leg.
📍Trading Strategy:
Wait for price to retrace into FVG Low Zones.
Look for early BUY setups at confluence areas:
CP zones
FIBO retracement levels
Volume/Price reaction zones
🎯 Target Outlook:
Bullish targets around 333x – 336x remain valid.
If price sustains momentum after pullback, we may aim for Buy Side Liquidity near 3371.749.
✅ Key Reminders:
Avoid chasing highs (FOMO).
Stick to proper TP/SL rules, especially with headline-driven markets next week.
🎉 Wishing you a relaxing weekend – recharge and get ready to conquer the markets next week!
🚀 GOD BLESS ALL
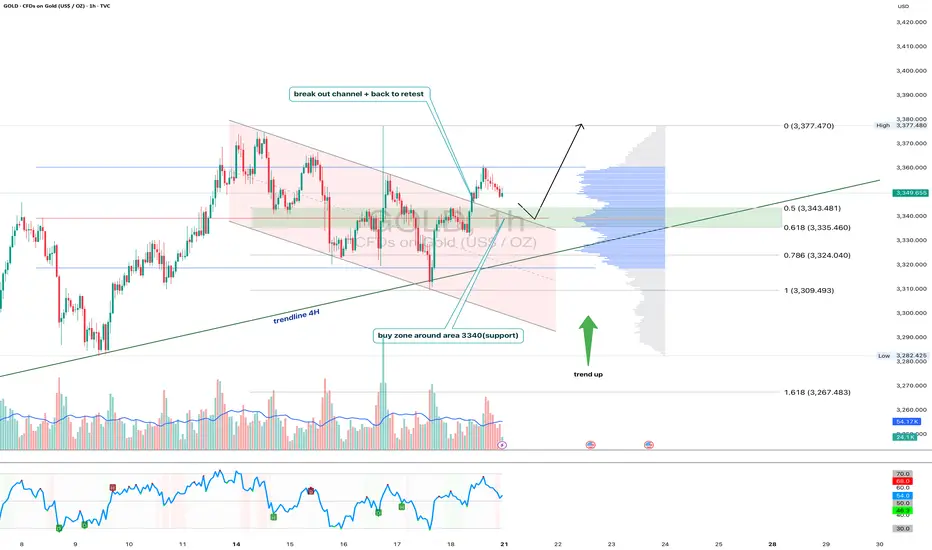
Gold 1H - Retest of channel & support zone at 3340After breaking out of the falling channel, gold is currently retesting its upper boundary — now acting as support. The 3340 zone is particularly important as it aligns with the 0.618 Fibonacci level and high volume node on the visible range volume profile. The price action suggests a potential bullish rejection from this area. With both the 50 and 200 EMA below price on the 1H, the short-term trend remains bullish. The 4H trendline further supports this setup. RSI is cooling off near the neutral zone, leaving room for another leg higher toward the 3377 resistance zone. If 3340 fails, 3324 (0.786 Fibo) becomes the next line of defense. Until then, the structure remains bullish following the successful breakout and retest of the channel.
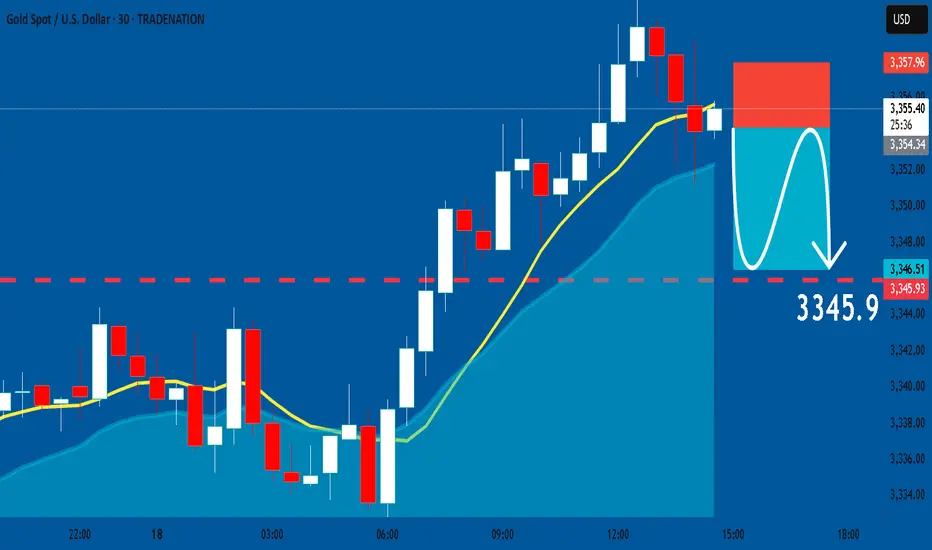
GOLD: Short Trade Explained
GOLD
- Classic bearish pattern
- Our team expects retracement
SUGGESTED TRADE:
Swing Trade
Sell GOLD
Entry - 3354.53
Stop - 3357.9
Take - 3345.9
Our Risk - 1%
Start protection of your profits from lower levels
Disclosure: I am part of Trade Nation's Influencer program and receive a monthly fee for using their TradingView charts in my analysis.
❤️ Please, support our work with like & comment! ❤️
GOLD: Local Bearish Bias! Short!
My dear friends,
Today we will analyse GOLD together☺️
The recent price action suggests a shift in mid-term momentum. A break below the current local range around 3,358.13 will confirm the new direction downwards with the target being the next key level of 3,349.76.and a reconvened placement of a stop-loss beyond the range.
❤️Sending you lots of Love and Hugs❤️

XAUUSD
XAUUSD Updated in 15M :
The gold signal is marked on the chart based on the latest price changes and the supply and demand in the market. These points include the entry point, stop loss, and take profit

Xausd techinical analysis.Xausd techinical analysis next move posibale at h1 time frame.not finchinal advice.

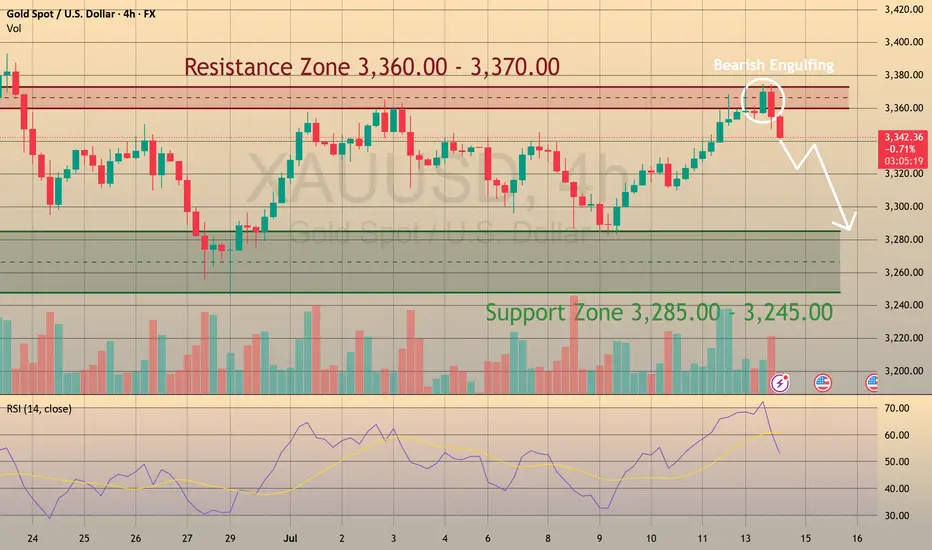
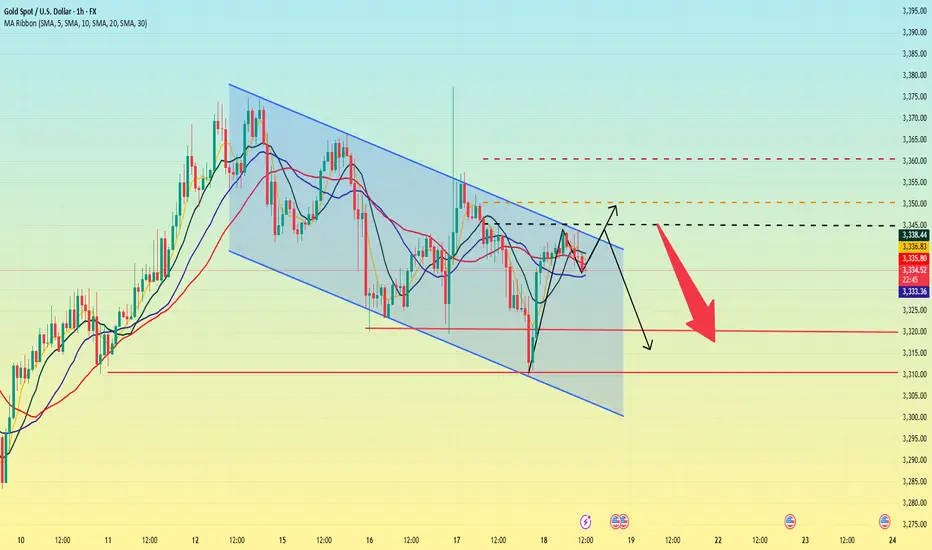
Gold is in danger. Could it fall?Gold started to fall slowly after the Asian market opened on Thursday, and continued to fluctuate and fall in the European market. The impact of the initial data in the US market fell sharply to around 3310, then stabilized and rose. It reached a high of around 3341 and then maintained a high sideways fluctuation, and the daily line closed with a negative line.
The price trend of gold this week was erratic. On Wednesday, it rose and fell, closing with a positive line, indicating that there was strong resistance above; on Thursday, it fell and rebounded, closing with a negative line, indicating that there was some support below. The current moving average system is chaotic, which further confirms that the overall situation is in a wide range of fluctuations.
Connecting the highs and lows of this week can form a fluctuating downward channel, which still has an important guiding role in the market. The current channel resistance is at 3345. If the gold price can break through this resistance level, it is expected to open up further upward space; and the channel support is around 3320. Once it falls below, it may trigger a new round of decline.
Overall, the upward resistance levels of gold are 3345, 3350, and 3360; the downward support levels are around 3320 and 3310. Operation strategy:
Short around 3350, stop loss at 3360, profit range 3330-3310.
Long near 3315, stop loss 3305, profit range 3330-3350.
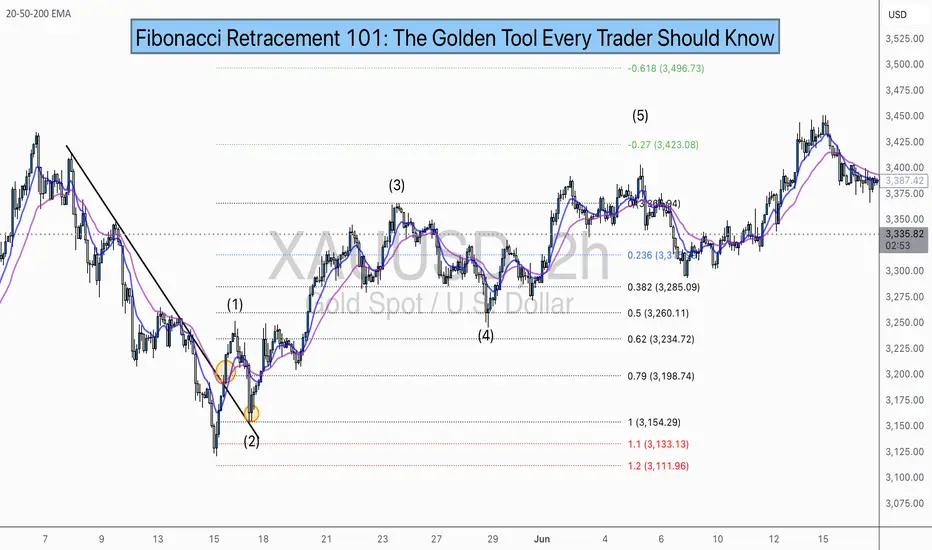
Fibonacci Retracement: The Hidden Key to Better EntriesIf you’ve ever wondered how professional traders predict where price might pull back before continuing... the secret lies in Fibonacci Retracement.
In this post, you’ll learn:
What Fibonacci retracement is
Why it works
How to use it on your charts (step-by-step)
Pro tips to increase accuracy in the market
🧠 What Is Fibonacci Retracement?:
Fibonacci Retracement is a technical analysis tool that helps traders identify potential support or resistance zones where price is likely to pause or reverse during a pullback.
It’s based on a mathematical sequence called the Fibonacci Sequence, found everywhere in nature — from galaxies to sunflowers — and yes, even in the markets.
The Fibonacci sequence is a series of numbers where each number is the sum of the two preceding ones, starting with 0 and 1. The sequence typically begins with 0, 1, 1, 2, 3, 5, 8, 13, and so on. This pattern can be expressed as a formula: F(n) = F(n-1) + F(n-2), where F(n) is the nth Fibonacci number.
The key Fibonacci levels traders use are:
23.6%
38.2%
50%
61.8%
78.6%
These levels represent percentages of a previous price move, and they give us reference points for where price might pull back before resuming its trend and where we can anticipate price to move before showing support or resistance to the trend you are following.
💡Breakdown of Each Fib Level:
💎 0.236 (23.6%) – Shallow Pullback
What it indicates:
Weak retracement, often signals strong trend momentum.
Buyers/sellers are aggressively holding the trend.
Best action:
Aggressive entry zone for continuation traders.
Look for momentum signals (break of minor structure, bullish/bearish candles). Stay out of the market until you see more confirmation.
💎 0.382 (38.2%) – First Strong Area of Interest
What it indicates:
Healthy pullback in a trending market.
Seen as a key area for trend followers to step in.
Best action:
Look for entry confirmation: bullish/bearish engulfing, pin bars, Elliott Waves, or break/retest setups.
Ideal for setting up trend continuation trades.
Stop Loss 0.618 Level
💎 0.500 (50.0%) – Neutral Ground
What it indicates:
Often marks the midpoint of a significant price move.
Market is undecided, can go either way.
Best action:
Wait for additional confirmation before entering.
Combine with support/resistance or a confluence zone.
Useful for re-entry on strong trends with good risk/reward.
Stop Loss 1.1 Fib Levels
💎 0.618 (61.8%) – The “Golden Ratio”
What it indicates:
Deep pullback, often seen as the last line of defense before trend reversal.
High-probability area for big players to enter or add to positions.
Best action:
Look for strong reversal patterns (double bottoms/tops, engulfing candles).
Excellent area for entering swing trades with tight risk and high reward.
Use confluence (structure zones, moving averages, psychological levels, Elliott Waves).
Wait for close above or below depending on the momentum of the market.
Stop Loss 1.1 Fib Level
💎 0.786 (78.6%) – Deep Correction Zone
What it indicates:
Very deep retracement. Often a final “trap” zone before price reverses.
Risk of trend failure is higher.
Best action:
Only trade if there's strong reversal evidence.
Use smaller position size or avoid unless other confluences are aligned.
Can act as an entry for counter-trend trades in weaker markets.
Stop Loss around 1.1 and 1.2 Fib Levels
⏱️Best Timeframe to Use Fibs for Day Traders and Swing Traders:
Day trading:
Day traders, focused on capturing short-term price movements and making quick decisions within a single day, typically utilize shorter timeframes for Fibonacci retracement analysis, such as 15-minute through hourly charts.
They may also use tighter Fibonacci levels (like 23.6%, 38.2%, and 50%) to identify more frequent signals and exploit short-term fluctuations.
Combining Fibonacci levels with other indicators such as moving averages, RSI, or MACD, and focusing on shorter timeframes (e.g., 5-minute or 15-minute charts) can enhance signal confirmation for day traders.
However, relying on very short timeframes for Fibonacci can lead to less reliable retracement levels due to increased volatility and potential for false signals.
Swing trading:
Swing traders aim to capture intermediate trends, which necessitates giving trades more room to fluctuate over several days or weeks.
They typically prefer utilizing broader Fibonacci levels (like 38.2%, 50%, and 61.8%) to identify significant retracement points for entering and exiting trades.
Swing traders often focus on 4-hour and daily charts for their analysis, and may even consult weekly charts for a broader market perspective.
🎯 Why Does Fibonacci Work?:
Fibonacci levels work because of:
Mass psychology – many traders use them
Natural rhythm – markets move in waves, not straight lines
Institutional footprint – smart money often scales in around key retracement zones
It's not magic — it's structure, and it's surprisingly reliable when used correctly.
🛠 How to Draw Fibonacci Retracement (Step-by-Step):
Let’s say you want to trade XAU/USD (Gold), and price just had a strong bullish run.
✏️ Follow These Steps:
Identify the swing low (start of move)
Identify the swing high (end of move)
Use your Fibonacci tool to draw from low to high (for a bullish move)
The tool will automatically mark levels like 38.2%, 50%, 61.8%, etc.
These levels act as pullback zones, and your job is to look for entry confirmation around them.
🔁 For bearish moves, draw from high to low. (I will show a bearish example later)
Now let’s throw some examples and pictures into play to get a better understanding.
📈 XAU/USD BULLISH Example:
1.First we Identify the direction of the market:
2.Now we set our fibs by looking for confirmations to get possible entry point:
Lets zoom in a bit:
Now that we have a break of the trendline we wait for confirmation and look for confluence:
Now we set our fibs from the last low to the last high:
This will act as our entry point for the trade.
3. Now we can look for our stop loss and take profit levels:
Stop Loss:
For the stop loss I like to use the fib levels 1.1 and 1.2 when I make an entry based upon the 0.618 level. These levels to me typically indicate that the trade idea is invalid once crossed because it will usually violate the prior confirmations
Take Profit:
For the take profit I like to use the Fib levels 0.236, 0, -0.27, and -0.618. This is based upon your personal risk tolerance and overall analysis. You can use 0.236 and 0 level as areas to take partial profits.
Re-Entry Point Using Elliott Waves as Confluence Example:
This is an example of how I used Elliott Waves to enter the trade again from the prior entry point. If you don’t know what Elliott Waves are I will link my other educational post so you can read up on it and have a better understanding my explanation to follow.
After seeing all of our prior confirmations I am now confident that our trend is still strongly bullish so I will mark my Waves and look for an entry point.
As we can see price dipped into the 0.38-0.5 Fib level and rejected it nicely which is also in confluence with the Elliott Wave Theory for the creation of wave 5 which is the last impulse leg before correction.
🔻 In a downtrend:
Same steps, but reverse the direction — draw from high to low and look to short the pullback.
XAU/USD Example:
As you can see the same basic principles applied for bearish movement as well.
⚠️ Pro Tips for Accuracy:
✅ Always use Fib in confluence with:
Market structure (higher highs/lows or lower highs/lows)
Key support/resistance zones
Volume or momentum indicators
Candle Patterns
Elliott Waves, etc.
❌ Don’t trade Fib levels blindly — they are zones, not guarantees.
📊 Use higher timeframes for cleaner levels (4H, Daily)
💡 Final Thought
Fibonacci retracement doesn’t predict the future — it reveals probability zones where price is likely to react.
When combined with structure and confirmation, it becomes one of the most reliable tools for new and experienced traders alike.
🔥 Drop a comment if this helped — or if you want a Part 2 where I break down Fibonacci Extensions and how to use them for take-profit targets.
💬 Tag or share with a beginner who needs to see this!