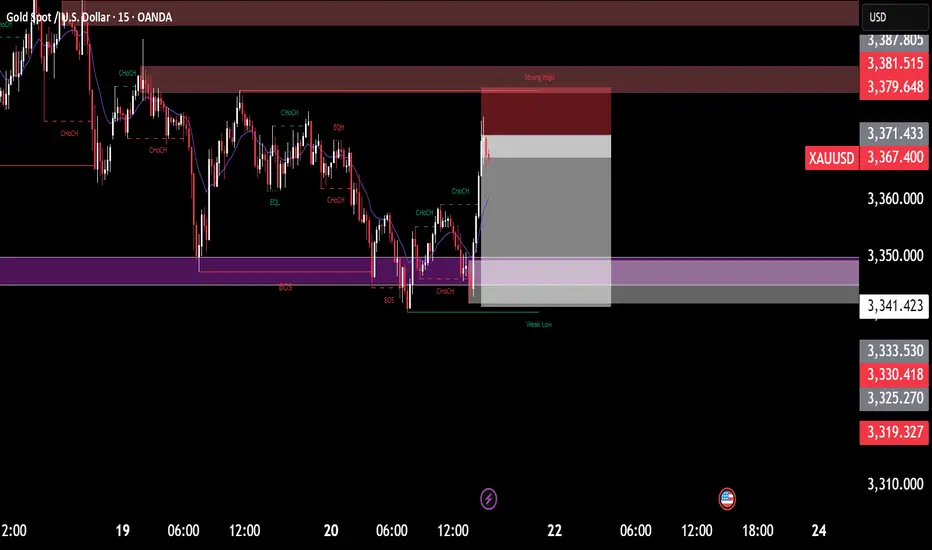
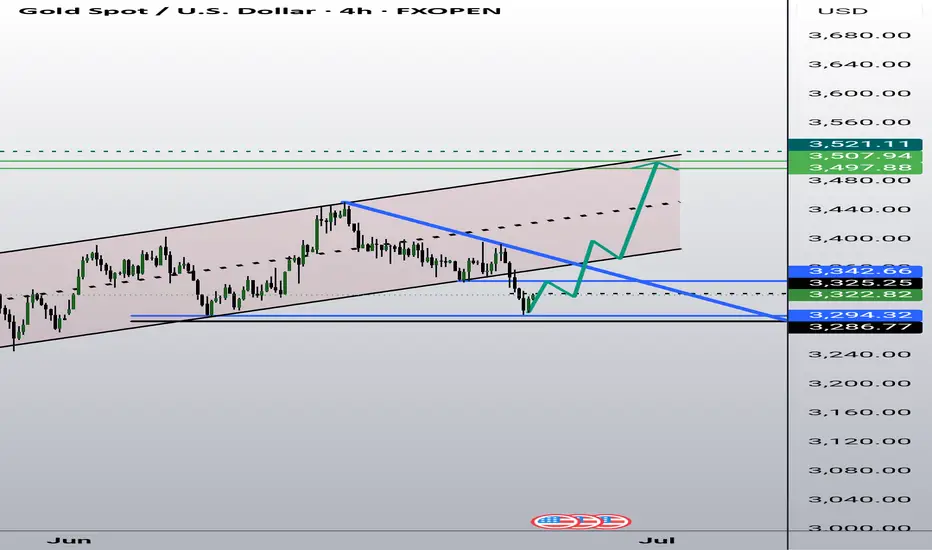
Gold buy setupexpecting buying 25% dealing range, which is break out, market is testing the bulish order block
CFDGOLD trade ideas

Long on Golda long position was entered today at $3,354 upon retest of resistance which Gold broke out of on Friday. The pattern appears to be a bull flag pattern. Entry price, stop loss and take profit are as seen in the trade idea.
Stay safe and happy trading guys!!

Gold Short Term OutlookYesterday’s chart idea is playing out as analysed.
Gold failed to break above the $3,395 resistance and has now pulled back, currently testing the first support zone — aligned with the 4H 200MA and Daily 50MA.
If this area fails to hold, price is likely to head toward the next key support zone, where we expect a potential reaction.
To resume bullish momentum, we need to see a strong close above $3,346. Key bullish zones remain $3,375 and $3,395.
📌 Key Levels to Watch:
Resistance:
$3,375 • $3,395 • $3,418 • $3,439
Support:
$3,361 • $3,346 • $3,330 / $3,306
$3,287 – Critical demand zone
🧠 Fundamental Focus:
All eyes are on Fed Chair Powell’s testimony today, which may offer clues about the Fed’s rate outlook and inflation stance. Any hint of continued hawkishness could weigh on gold, while dovish commentary may trigger renewed upside interest.
Expect heightened intraday volatility around his remarks — stay cautious.

Review and Speculation for the 10 Elite PairsYou can follow us for more Analysis(Images and Videos) with Precise definition of the Financial Market.ENJOY!!!


Bullish Gold!!! Small Correction before pump...Here we see the power of fair value gaps.
I'm sure with the basics of ict concepts one can easily understand.
Also a pullback is expected before we can see us go for a higher level price....
Team Wababaz!

Gold Short Term OutlookGold is currently trading around $3,368, caught between dynamic moving average resistance and an intraday resistance zone.
Price must break and hold above the $3,378 resistance to open the path toward $3,395. A confirmed break above the key $3,395 level could signal the start of the next bullish leg.
However, repeated failure to break above $3,395 — or even $3,378 — may drag gold lower into key support zones.
📌 Key Levels to Watch:
Resistance:
$3,375 • $3,395 • $3,418 • $3,439
Support:
$3,361 • $3,346 • $3,330 / $3,306
$3,287 – Critical demand zone
🧠 Fundamental Insight:
Gold remains supported amid rising geopolitical tensions. Over the weekend, U.S. airstrikes targeted Iranian nuclear sites, escalating concerns over a broader conflict in the Middle East. This has reignited safe-haven demand, with gold catching a bid despite recent technical pullbacks.
Meanwhile, traders are weighing softer U.S. inflation signals against the Fed’s cautious stance. If tensions persist and economic data weakens, gold could benefit from both risk-off flows and increased speculation around potential rate cuts.


Gold out look Daily Timeframe Analysis
Gold continues to respect its medium to long-term bullish structure on the daily timeframe. Despite the ongoing geopolitical tensions and war-driven headlines, price action has experienced a corrective pullback from the key resistance area near 3430.
Importantly, gold appears to be forming a minor bullish channel within a broader consolidation zone suggesting that price is currently in a range-bound correction phase nested inside a higher-timeframe uptrend. The channel structure reflects healthy consolidation, not a trend reversal.
Chart Reference: Daily Chart
3-Hour Timeframe (Intraday Structure)
The 3H chart shows price recently reacting from the bullish channel support, confluenced with a demand zone and the Fibonacci golden zone indicating a strong technical base. A new fresh demand zone has been created as a result of this reaction.
Price is currently holding above the minor intraday structure at 3365.
If this level holds, short-term targets are 3377 – 3380.
A confirmed break and retest above 3380 opens up the next leg toward 3400 – 3404 resistance.
Chart References:
Fundamental Backdrop
A combination of macroeconomic and sentiment-based indicators support the bullish bias:
COT (Commitment of Traders) data shows institutional positioning remains net long on gold.
Retail sentiment is skewed towards short, which historically supports upside moves.
Seasonal bias for gold typically favors strength during mid-to-late Q2.
US economic indicators show signs of cooling:
Manufacturing PMI & Services PMI have slowed.
Retail sales remain soft.
Inflation readings suggest disinflationary pressure.
These factors collectively weaken the US dollar, adding upside pressure to gold.
Downside Risk / Bearish Scenario
If price fails to hold above 3365 and decisively breaks below the current channel, we could see a deeper correction toward the 3300–3280 area of interest which aligns with a major support, daily bullish trendline, and longer-term reaccumulation zone.
15-Minute Timeframe (Microstructure Insight)
On the 15M chart, gold rallied from the channel base and demand zone, but has since entered a consolidation phase between 3365 and 3372. A Fair Value Gap (FVG) lies just beneath the 3365 pivot — suggesting the potential for a liquidity sweep before any continued move to the upside.
This setup is often a precursor to an aggressive expansion move, particularly during high-volume sessions (London/New York overlap).
Summary
Bias: Bullish (while above 3365)
Immediate Support: 3365
Short-Term Targets: 3377 → 3380 → 3404
Key Resistance: 3430
Bearish Invalidations: Below 3365
Short on GOLD for the first min of the dayJust a small idea of what could happen at the begging of the market on Mon
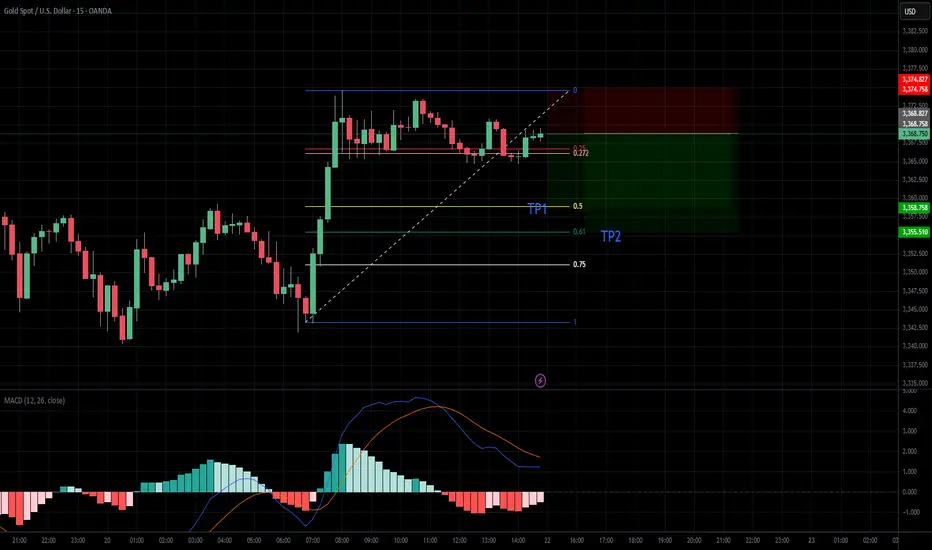
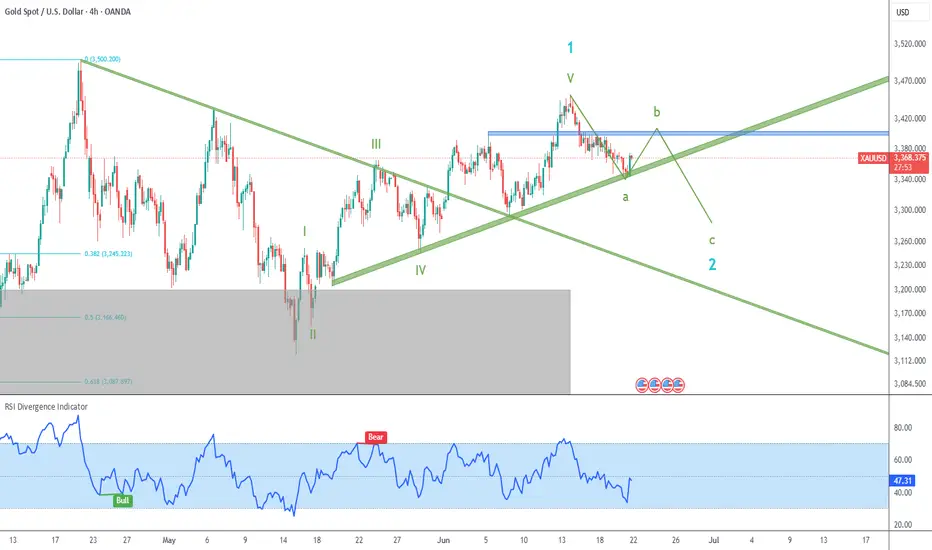
XAU Updated CountThis is my current trade plan for Gold. I don´t believe the correction is over, and will be watching for potential shorts after some upside movement (green b -> c trade).
But the bigger opportunity will be on the conclusion of green c / blue 2, from where we can really get another strong leg to the upside.
GOLD: Short Signal with Entry/SL/TP
GOLD
- Classic bearish formation
- Our team expects fall
SUGGESTED TRADE:
Swing Trade
Sell GOLD
Entry Level - 3370.3
Sl - 3377.8
Tp - 3355.4
Our Risk - 1%
Start protection of your profits from lower levels
Disclosure: I am part of Trade Nation's Influencer program and receive a monthly fee for using their TradingView charts in my analysis.
❤️ Please, support our work with like & comment! ❤️

SELL NOW XAUUSD🕓 This setup is valid as long as price holds above the demand zone and continues forming higher lows.
XAUUSD GOLD TRADING STRADING June 20, 2025XAUUSD Gold Trading Strategy June 20, 2025:
Yesterday's trading session, gold prices failed to accumulate above the 3360 area. After the price broke the 3360 support area, a downtrend channel was formed on the H1 frame. However, the current war news still supports gold prices to increase due to investors' confidence. We still trade according to this downtrend channel and wait at support areas to be able to trade long term.
Important price areas today: 3325 - 3330, 3360 - 3365 and 3373 - 3378.
Today's trading trend: SELL.
Recommended orders:
Plan 1: SELL XAUUSD zone 3363 - 3365
SL 3368
TP 3360 - 3350 - 3340 - 3330.
Plan 2: SELL XAUUSD zone 3376 - 3378
SL 3381
TP 3373 - 3363 - 3353 - 3330.
Plan 3: BUY XAUUSD zone 3325 - 3327
SL 3322
TP 3330 - 3340 - 3370 - 3400.
Wish you a safe, favorable and profitable trading weekend.🌟🌟🌟🌟🌟

XAUUSD: 1H Chart Trend Continuation or Deeper Pullback?Established Uptrend Channel : The XAUUSD pair is trading within a well-defined, long-term ascending channel (highlighted by the red parallel bands), indicating a clear bullish trend with consistent higher highs and higher lows over the observed period.
Significant Support Confluence : The lower boundary of the ascending channel, particularly the area marked "Confluence Area for support" (green and orange shaded zone), has repeatedly acted as a strong demand zone where price has found support and reversed higher.
Current Corrective Phase and Deciding Point : Price is currently undergoing a short-term correction, forming a smaller, descending channel (white/grey box) within the larger uptrend. This area is labeled "Deciding Area to continue Higher," indicating that the immediate future direction is contingent on whether price breaks out of this smaller channel or continues within it.
Projected Pathways : The chart illustrates two immediate potential scenarios: a resumption of the primary uptrend (green dotted path) upon a successful breakout from the short-term descending channel, or a deeper retracement towards the major ascending channel's support (red dotted path) if the current corrective structure persists or breaks lower.
Disclaimer:
The information provided in this chart is for educational and informational purposes only and should not be considered as investment advice. Trading and investing involve substantial risk and are not suitable for every investor. You should carefully consider your financial situation and consult with a financial advisor before making any investment decisions. The creator of this chart does not guarantee any specific outcome or profit and is not responsible for any losses incurred as a result of using this information. Past performance is not indicative of future results. Use this information at your own risk. This chart has been created for my own improvement in Trading and Investment Analysis. Please do your own analysis before any investments.

Bulls and bears are anxious? Rebound continues to empty📰 Impact of news:
1. Initial unemployment claims data
📈 Market analysis:
Gold is in a sideways consolidation near 3320 in the short term. The market has no clear direction for the time being, and the long and short positions are in a tug-of-war. The hourly line rebounded to 3328 and then fell back again, suggesting that there is still room for short-term retracement. The current operation needs to focus on key points: if it rebounds to the 3320-3330 resistance area, you can consider entering short positions again. If the market continues to decline, focus on the 3300-3290 support range. If it stabilizes, long orders can be arranged. The overall idea is to maintain a volatile market. Before effectively breaking through 3350 or falling below 3290, high-altitude and low-multiple is still the main strategy.
🏅 Trading strategies:
SELL 3320-3330
TP 3310-3300-3290
BUY 3310-3300
TP 3320-3330-3340
If you agree with this view, or have a better idea, please leave a message in the comment area. I look forward to hearing different voices.
OANDA:XAUUSD FX:XAUUSD FOREXCOM:XAUUSD FXOPEN:XAUUSD TVC:GOLD

Gold fluctuates at high levels, intraday trading points📰 Impact of news:
1. Initial unemployment claims data
📈 Market analysis:
Gold has begun to show signs of bottoming out in the short term in the past two days. Since the daily line bottomed out and pulled up, the daily line closed positive yesterday, and the bulls began to counterattack, and the 1H low was rising. If it doesn't fall further in the short term, it will most likely bottom out and rebound. The upper pressure is at the Bollinger middle track of 3355, which is also the high point of Tuesday's decline. If gold breaks and stabilizes at this price, it will have a larger upward space, and the upper side will look at 3385. In the 4H chart, MACD temporarily forms a golden cross, which is a bullish signal; but the BOLL track pressure is still there, and gold bears still have momentum in the short term. Therefore, on the whole, in the short term, gold should pay attention to the 3350-3360 resistance above. If it encounters resistance under pressure here, it can consider shorting. Pay attention to the 3330-3320 support area below.
🏅 Trading strategies:
SELL 3350-3360
TP 3340-3330-3320
BUY 3330-3320
TP 3340-3350
If you agree with this view, or have a better idea, please leave a message in the comment area. I look forward to hearing different voices.
TVC:GOLD FXOPEN:XAUUSD FOREXCOM:XAUUSD FX:XAUUSD OANDA:XAUUSD

Xauusd market update This chart shows a Gold Spot (XAU/USD) analysis on the 1-hour timeframe. Here's a breakdown of the setup:
---
Key Levels:
Current Price: $3,326.695
Support Zone (Blue Area): ~$3,280 – $3,310
Resistance Zone (Purple Area): ~$3,375 – $3,400
---
Chart Insights:
The price appears to be consolidating in a range (highlighted by the blue support/resistance bands).
There's a dotted projected path showing a possible:
1. Short dip into the lower support zone around $3,280
2. Reversal and sharp move up toward the $3,375–$3,400 resistance zone
---
Interpretation:
This is a bullish setup suggesting a buy opportunity if price dips to the lower blue zone and shows a reversal.
The target lies near the upper purple zone ($3,400).
Traders might watch for:
Bullish candlestick confirmation near the support zone
Breakout from the current consolidation
Volume confirmation on the move upward
---
Would you like a risk-reward analysis or entry/stop/target levels based on this setup?

XAU/USD-Mart money
🚨 Smart Money Sniper Signal – XAU/USD (Gold)
🕒 Timeframe: M15 or H1
📅 Date: June 25, 2025
---
🔍 Market Context
Current price: ~$3,326
Market structure: Bullish on H1
Liquidity grab zone: Observed around $3,322
Order block support: $3,318 – $3,322
RSI: Above 50 (bullish momentum)
---
🟢 Buy Setup (Sniper Entry)
Entry zone: $3,322 – $3,324 (on bullish confirmation)
Confirmation: Bullish engulfing or strong bullish candle on M15
Stop Loss: Below $3,318
Take Profit targets:
TP1: $3,330
TP2: $3,336
TP3: $3,344
🧠 Tip: Use a Risk:Reward ratio of at least 1:2. Set trailing stop once TP1 is reached.
---
🔴 Sell Scenario (If invalidation)
If price breaks below $3,318 with volume:
→ Wait for a retest of the zone and enter SELL
TP1: $3,312
TP2: $3,304
---
🔔 For TalionPromosal (TradingView page)
Use this caption for your idea post:
> 💥 Smart Money Signal (Gold – M15/H1)
Bullish structure still valid. Looking for sniper entry near $3,322 with OB + RSI confluence.
SL below $3,318. TP targets $3,330 / $3,336 / $3,344.
Risk-managed & institutionally aligned setup.
#SmartMoney #XAUUSD #Gold #SniperEntry #TalionPromosal #TradingView
-

Gold has Bottom OutAfter 2 weeks of selling gold gas bottom out
Best level to enter Long position
High risk reward at current level
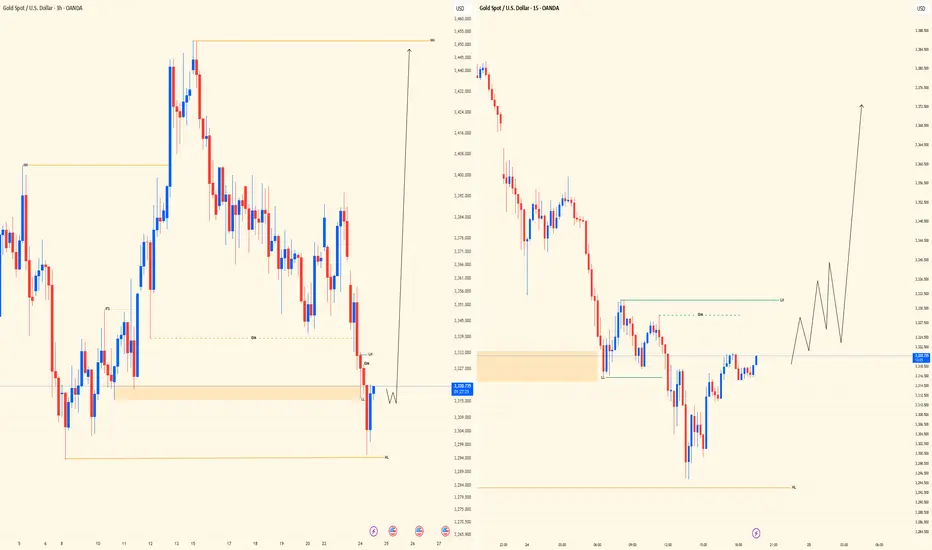
Midweek XAUUSD Insight | Dual View SetupPair: XAUUSD
Bias: Bullish
HTF Overview (Left Panel – 3H): Price action has been moving within bullish structure, with a major higher low currently holding strong. This HL is the key pivot I’m watching for continuation.
Refinement Zone (Middle – 30M): We’ve tapped into a 30M OB and are now sitting in mitigation territory. No signs of reversal yet, but the setup is maturing.
Entry Technique (Right Panel – 15M View): Just waiting for that classic Smart Money confirmation — LTF CHoCH, liquidity sweep, then return into OB. Will refine down to 5M for precise entry if price plays out clean.
Entry Zone: Waiting on confirmation around the OB zone
Target Zones: Based on HTF structure continuation
🧠 Mindset Note: Setup is solid, but patience wins. Let the story unfold — we only strike with clarity and precision.
Bless Trading!
XAUUSD: Post-Crash Buy Zone and Bullish SetupHere's a structured breakdown of today's #XAUUSD (Gold) trading idea, including key levels, wave structure, and risk/reward zones for both short-term and swing traders.
---
🔹 Key Technical Zones (H1 & H4 Charts)
Support Levels
- 3,303 USD – Key support on H4; potential false breakout area
- 3,324–3,327 USD – Wave 5 completion zone and high-probability buy area
- 3,337–3,343 USD – Entry zone for early bullish setups
- 3,340–3,345 USD – Clean long entry; targeting up to 3,450 USD
Resistance Levels
- 3,363–3,365 USD – Sell zone tied to wave 4/5 overlap
- 3,375–3,383 USD – Mid-range resistance; key for short-term profits
- 3,405–3,500 USD – Long-term bullish targets; includes ATH region
---
🔹 Wave Count (H1 Structure)
- Wave X – Recent sell-off ended a potential uptrend; suggests ongoing correction (WXY)
- Wave Y – 5-wave drop toward 3,363–3,365 USD; acting as a short-term sell zone
- Wave Z – Expected final leg down toward 3,324–3,327 USD (ideal buy zone)
- Retracement Setup – Anticipated bullish retrace post-wave 5, with targets back at 3,363–3,376 USD
---
🔹 Order Blocks & FVGs
Buy Zones
- 3,343–3,330 USD – FVG within an order block; strong bullish entry area
- 3,319–3,317 USD – Deep support with short-term target at 3,349 USD
Sell Zone
- 3,363–3,365 USD – Key area for short setups, with targets at 3,342–3,330 USD
---
🔹 Strategy & Key Takeaways
1. Bullish Structure Still Intact
- Rising channel remains valid on H4
- Holding 3,303 USD is critical for confirming bullish continuation
2. Trade Setup
- Long entries near 3,340–3,345 USD
- Target range: 3,450 USD and above
- Tight stops around 3,325 USD recommended for low-risk exposure
3. Wave Completion Zones in Play
- Monitor 3,324–3,327 USD (buy zone) and 3,363–3,365 USD (sell zone) for end-of-wave activity
4. Risk Management Is Key
- Scale into positions
- Respect intraday volatility and breakout traps

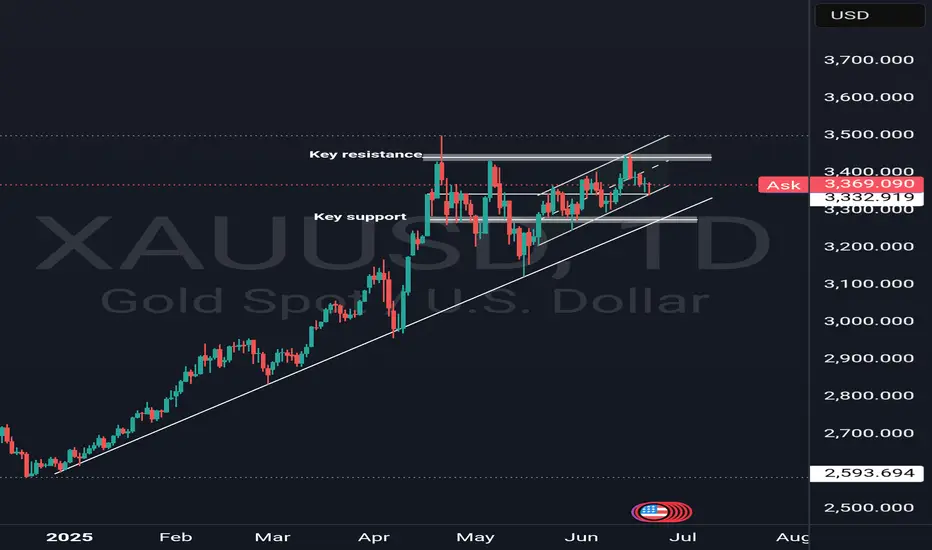
XAUUSDGold has shown a strong historical pattern of impulsive rallies followed by significant corrections. After the recent explosive move from the $2,067 breakout zone to new all-time highs around $3,500, representing a +67% rally, the metal appears overextended and due for a healthy pullback.
Past cycles suggest that after such parabolic moves, price tends to retrace back to key demand zones or previous accumulation levels. In this case, the medium-term correction target aligns with the $2,800–$2,750 region — a strong structural support and confluence with the 2024 breakout base.
While the long-term trend remains bullish, this setup hints at a potential mean reversion or consolidation phase. Traders should remain cautious at current highs and watch for signs of distribution and lower highs forming in the coming weeks
