XAUUSD DOUBLE BOTTAM CHART PATTERN 📈 XAUUSD – Potential Bullish Breakout from Double Bottom
Timeframe: 30m | Bias: Bullish
Price has formed a Double Bottom (Bottom 2) structure near a key support zone, indicating potential accumulation. The current move toward the neckline hints at a possible breakout.
🔹 Entry Zone: 3,345–3,350 (on breakout or strong bullish candle close above neckline)
🔹 Stop Loss (SL): Below 3,335 (beneath recent swing low)
🔹 Take Profit (TP):
▫️TP1: 3,360
▫️TP2: 3,375
▫️TP3: 3,385+ (if momentum sustains)
📌 Pattern: Double Bottom → Breakout Potential
📌 Confluence: Bullish structure, demand zone bounce, trendline support
📌 Invalidation: Clean break below 3,335
CFDGOLD trade ideas

XAUUSD ANALYSYS 💸GOLD💸
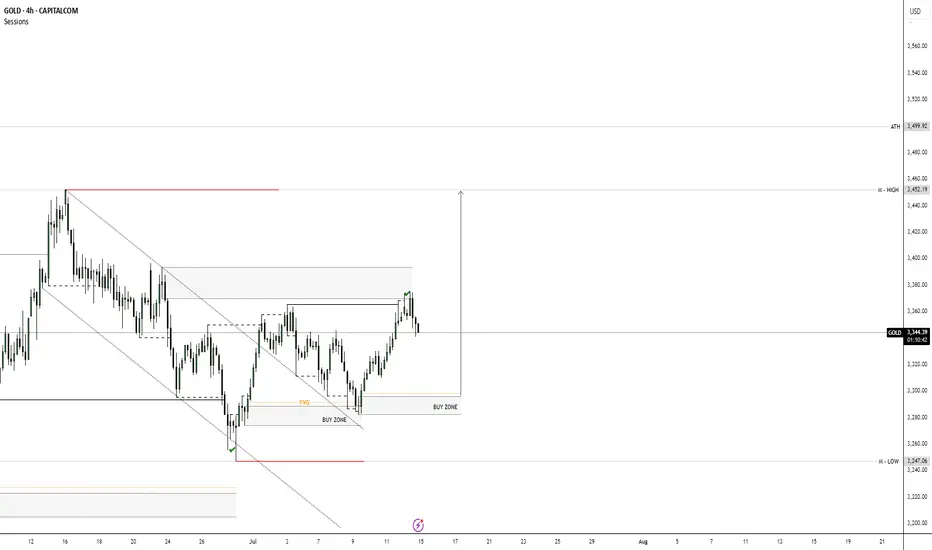
Market Outlook: Bullish
• Price broke out of a downtrend channel and is now forming higher highs and higher lows — clear sign of a trend reversal.
• Current move is a pullback after a strong push up.
⸻
📍 Key Zones:
• Buy Zones and Fair Value Gaps (FVGs) are marked.
• These are areas where buyers may step in again.
• Price is pulling back into these zones — potential long entry area.
⸻
🎯 Target:
• The top red line marks a liquidity zone or resistance.
• Price is likely aiming to reach this area next.
⸻
📈 Trade Setup Idea:
• Buy on pullback to the FVG / Buy Zone.
• Stop Loss: Below the Buy Zone.
• Take Profit: At the previous high (resistance zone).
⸻
⚠️ Risk to Watch:
• If price breaks below the Buy Zone, bullish setup is invalidated — wait for new structure.
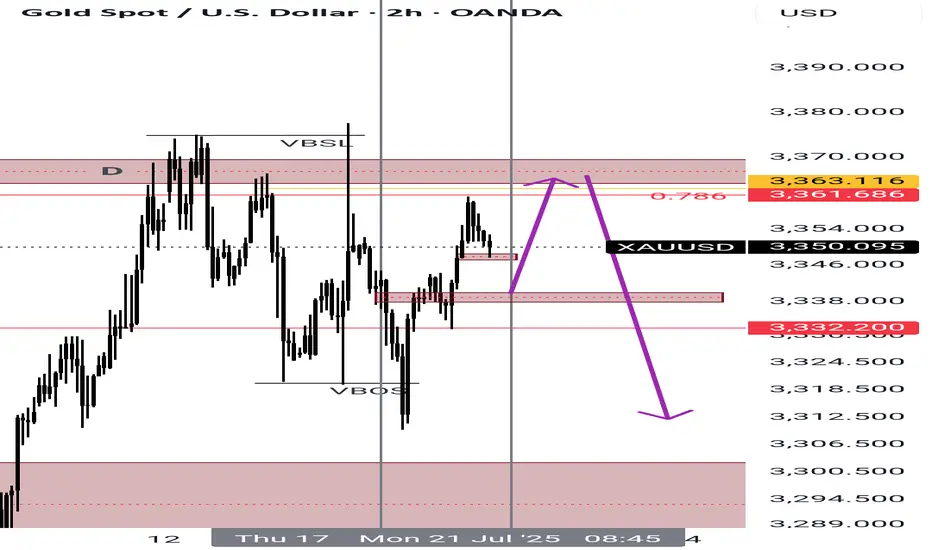
GOLD: Local Bearish Bias! Short!
My dear friends,
Today we will analyse GOLD together☺️
The price is near a wide key level
and the pair is approaching a significant decision level of 3,349.76 Therefore, a strong bearish reaction here could determine the next move down.We will watch for a confirmation candle, and then target the next key level of 3,341.88..Recommend Stop-loss is beyond the current level.
❤️Sending you lots of Love and Hugs❤️

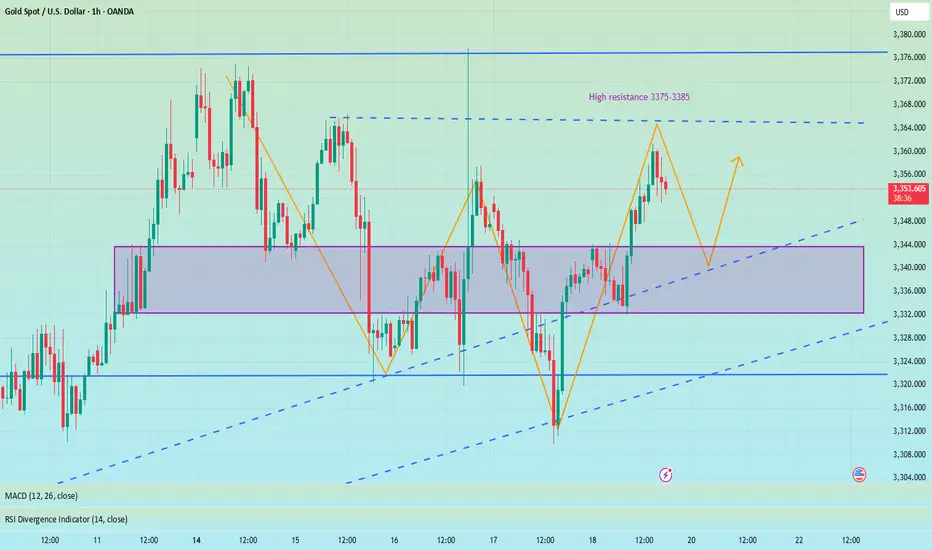
XAUUSD 1H – Bullish Trend Continuation Setup (TCB Trend Phase)📈 XAUUSD 1H – Bullish Trend Continuation Setup (TCB Trend Phase)
Timeframe: 1H
Strategy Phase: ✅ Trend Phase (Pullback & Breakout)
🔍 Analysis:
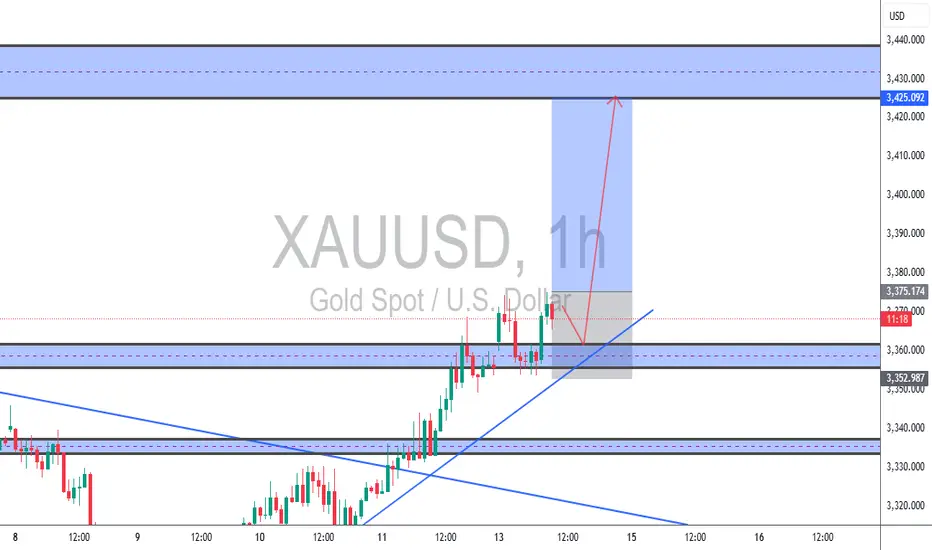
Gold (XAUUSD) continues to hold its bullish trend structure, with price breaking above the descending trendline and forming higher highs and higher lows.
After a recent breakout, price pulled back to a key support + trendline confluence zone near 3,353, where it printed bullish continuation candles. This zone has also acted as a breakout-retest area, adding confidence.
The next major target lies around 3,425, just beneath the next supply/resistance zone.
📌 Trade Setup Summary:
Entry Zone: 3,360–3,370
Stop Loss: Below 3,352
Take Profit: 3,425
Risk-to-Reward: ~1:3+
Bias: Bullish continuation unless price breaks below structure
📋 TCB Checklist Review (Trend Phase):
✅ HTF Bullish Trend Confirmed (4H/1H)
✅ Pullback to Demand/Structure
✅ Breakout + Retest
✅ Trendline Confluence
✅ Clean RRR and no major chop
✅ No nearby HTF resistance until 3,425 zone
✅ Score: 100% A+ Setup
🧠 Trade Management Plan:
Move SL to breakeven at 1:1
Consider partial TP near 3,400
Re-enter if price forms another continuation setup
📚 Strategy: TCB (Trend – Countertrend – Breakout)
This trade follows the Trend Phase rules – trading pullbacks in a strong bullish market.
Gold (XAUUSD) Analysis – 4-Hour TimeframeGold (XAUUSD) Analysis – 4-Hour Timeframe
Currently, the price is moving in an upward trend and approaching a key resistance area. Recent volatility suggests that buyers have shown enough strength to break through previous resistance zones and are now attempting to overcome the next significant barrier ahead.
🔴 Bullish Scenario:
If the price manages to break above the current resistance and hold above it, we can expect a continuation of the upward move toward higher zones. In this case, the bullish wave could extend toward the next resistance levels (marked in blue).
🔴 Bearish Scenario:
If the price reacts negatively to the current resistance area and fails to break above it, a corrective decline may follow. The nearest support zone below could play a crucial role in maintaining the bullish structure. However, if this support is also broken, the path could open for a deeper pullback toward lower support levels.

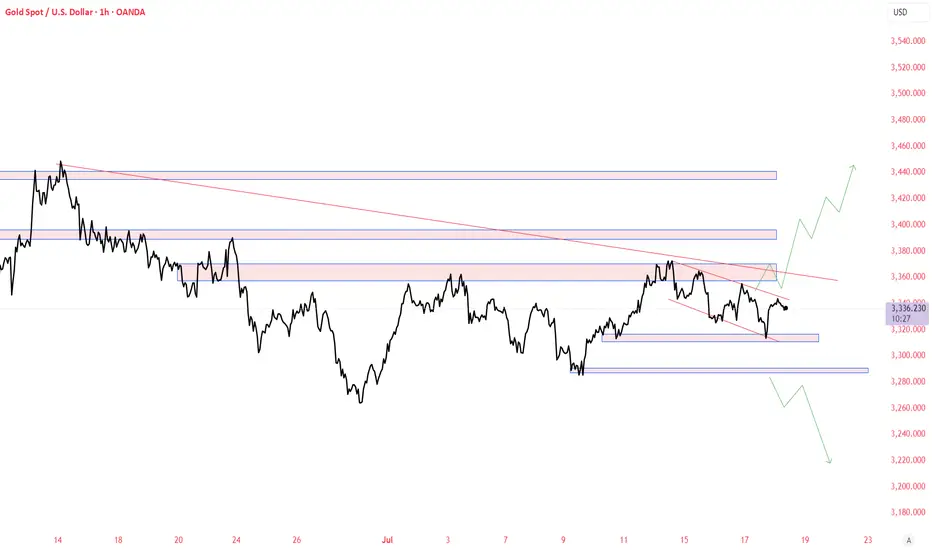
GOLD UPDATE – Demand Zone Bounce📊 GOLD UPDATE – Demand Zone Bounce
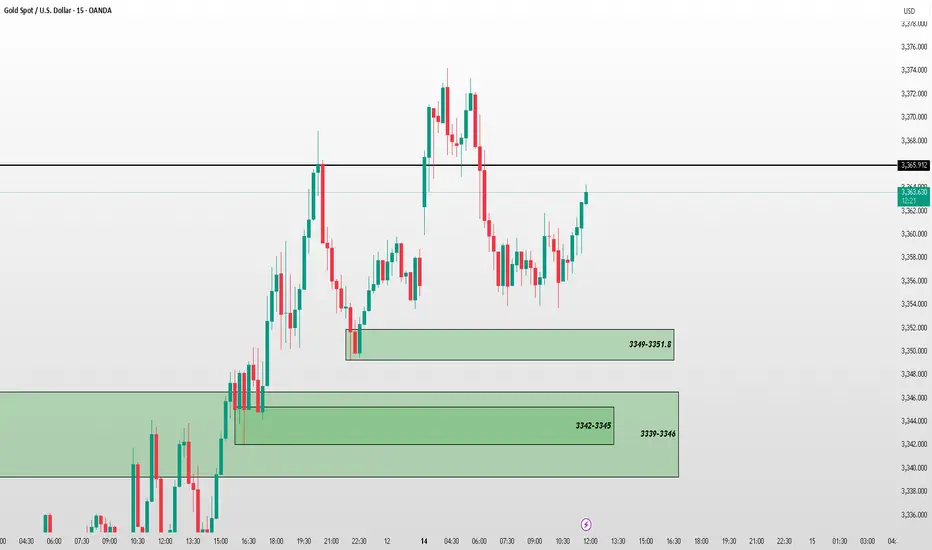
Price respected the 3349–3351.8 demand zone and is now climbing toward key resistance at 3366.912.
🟩 Demand Zone Held: 3349–3351.8
📈 Target: Resistance Level 3366.912
📉 Backup Demand: 3342–3345 & 3339–3346 (in case of pullback)
This reaction reinforces the importance of level precision and smart zone selection. Let's watch for confirmation near resistance.
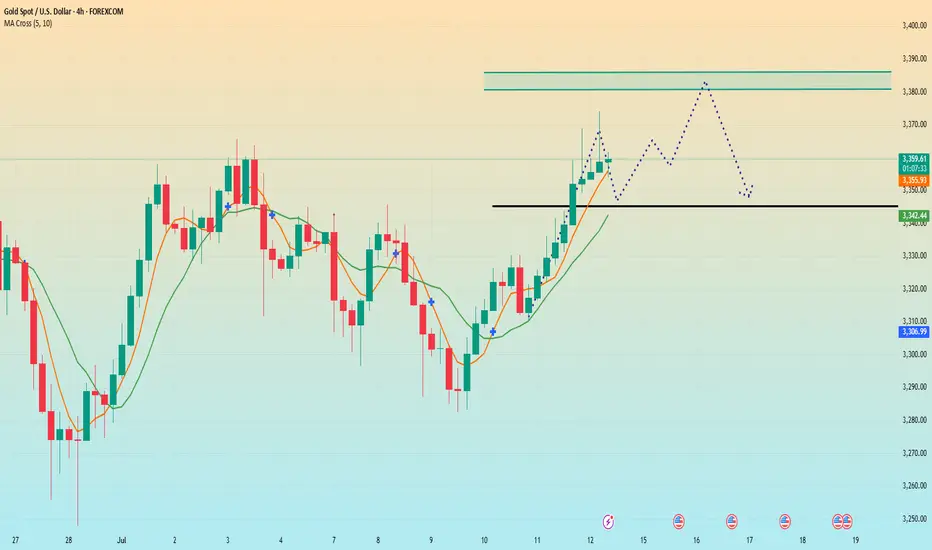
Affected by tariffs, gold rose again.On Saturday, Trump announced that he would impose a 30% tariff on goods imported from the European Union and Mexico from August 1. This news triggered a rise in risk aversion in the market. As a traditional safe-haven asset, gold was once again sought after. The price continued the rise on Friday and continued to open high in the early Asian session. As of now, the highest price reached around 3373.
From the current market point of view, after breaking through the triangle pattern last Friday, there was a sharp rise. The price successfully stood on the short-term moving average, showing an overall bullish trend. However, it should be noted that the short-term moving average has not yet formed an upward cross, which means that there is a high possibility of a confirmation process in the future. Looking back at the trend in the past two months, gold rarely opens high and then continues to rise. Most of them open high and go low. Therefore, under the current situation, although it is bullish overall, it is not advisable to blindly chase more. It is more suitable to wait for a decline before arranging more orders. The key lies in grasping the decline position.
From the perspective of pressure level, 3380-3385 is the first pressure level, and the second pressure level is 3395-3400. The support level below is around 3345, which is also the pressure level that has been emphasized in the early stage, and the top and bottom conversion position. For today's operation, Quaid recommends low-to-long.
Operation strategy:
Short near 3380, stop loss 3390, profit range 3360-3345
Long near 3345, stop loss 3335, profit range 3360-3380
XAUUSDA short sell but our overal biased is a buy. once we see a sign of weakness to the downside we will definitely close our open trade and focus on entry to the upside.

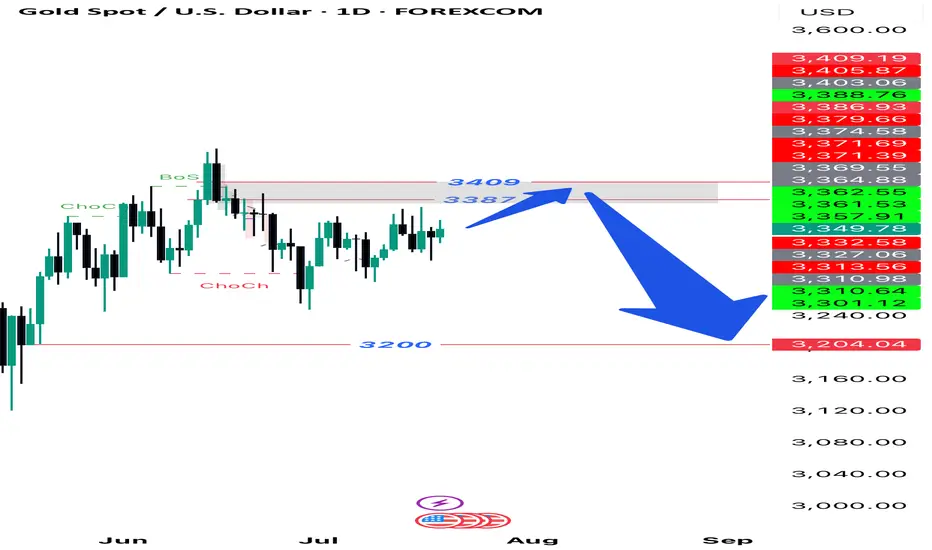
1D, chart analysis.
Drawn from the major swing low ($3,500):
0.236 Level = $3,418 → minor resistance
0.618 Level = $3,274 → critical retracement (gold bounced near this)
1.000 Level = $3,131 → absolute support
These levels suggest the retracement may be over, and price could be prepping for a new push.

Mapping for week 21-25th july.As per my mapping.
this is the video version of it and hopefully its gonna be helpful for you and me.

XAUUSD Daily Setup On the daily timeframe, a change in the internal structure has occurred, so the price moves upwards to the range of 3378 to 3409, then moves downwards to the indicated support area.
Weekly Analysis on GOLDFor next week trading session i will wait for buy set up since market structure is still in a bullish trend. There might be a selling opportunity but still i will wait for a great buy set up.

Gold is indecisive Gold is indecisive
As the chart pattern has the indication of the market is ready for a price correction.
the slow and steady breakout up wards is visible too.
for the moment the momentum is more of a sideways. hence its safe to sell high and buy low.
no trade zone in between. for example potential good sell area will be 3377-79 or buys on 3310-12 or 3288-90.
until a proper clear direction for a goo swing trade to break its triangle compression.

XAUUSD ANALYSISWe are waiting for the price to come to our zone demand where we look for buy UpTo the level of supply zone where we look for sell entry .
Long and short fluctuations, the market is waiting for a break📰 News information:
1. Powell responds to White House issues
2. Will other countries impose reciprocal sanctions on tariffs?
📈 Technical Analysis:
Although the MACD indicator of the gold hourly line formed a golden cross, the market reached a high of around 3361, and the RSI indicator was close to the overbought area, so we need to be cautious about corrections. From the 4H chart, the MACD second golden cross is on the zero axis. Currently, we are paying attention to the moving average SMA5 near 3343, and the SMA60 support line 3332. If the 4H upward trend falls back, we need to go long. At present, gold is still running above, and there is no good participation point in the short term, but on the whole, we should pay attention to the support of 3345-3332 below, and we can consider going long if it retreats and stabilizes. We continue to pay attention to the resistance pressure of 3375-3385 above, and we can try to go short if it does not break.
🎯 Trading Points:
SELL 3375-3385
TP 3365-3355
BUY 3345-3332
TP 3365-3375-3385
In addition to investment, life also includes poetry, distant places, and Allen. Facing the market is actually facing yourself, correcting your shortcomings, facing your mistakes, and exercising strict self-discipline. I share free trading strategies and analysis ideas every day for reference by brothers. I hope my analysis can help you.
FXOPEN:XAUUSD OANDA:XAUUSD FX:XAUUSD FOREXCOM:XAUUSD PEPPERSTONE:XAUUSD TVC:GOLD
Long XAUUSDPrice retest the fomo zone
Uptrend in H4, M15
Stoploss at the swing low
TP at the previous highest high peak
Lfg
Buy Opp!Hello all. after missing my last idea (I explain the reason on that idea), price is ready to makes a new Higher High. be happy and have a great day. be aware about 16 UTC or times around that. (wink)

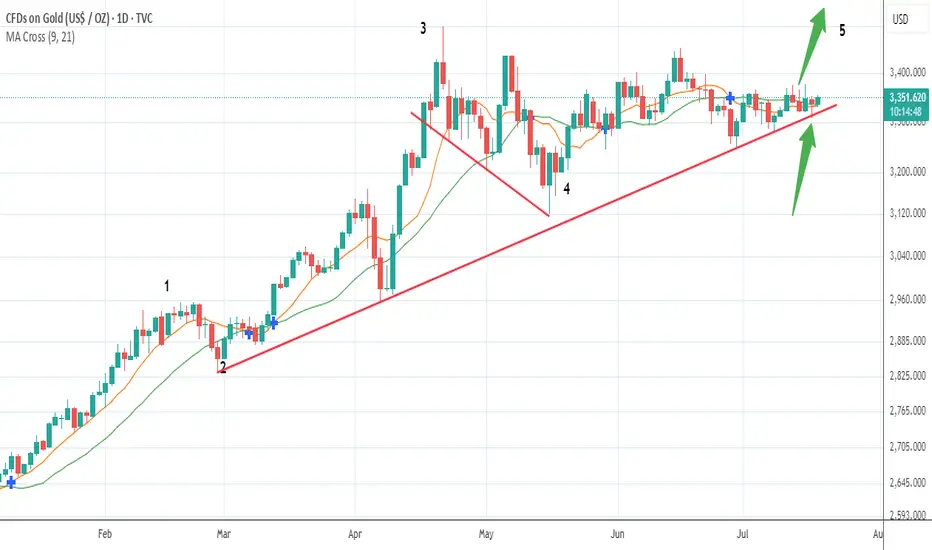
Bet The Farm!Gold's consolidation period in a wave 4 sideways pattern is about to conclude.
Anybody short this asset is about to get burned, a more than 90% probability of an upward surge is imminent.
There are multiple support touch points on this upward trend line...does it get any clearer?
Appreciate a thumbs up...God Bless you all!
Excellent profits booked As I mentioned in yesterday’s commentry session:
My strategy is still the same – buying every dip in Gold around my key level yesterday at 3312, which the market respects well and as our first target was 3345
I'm aiming for a breakout to the upside.
Very happy with the profits so far.
My medium-term targets remain 3380 &3,400 and I’ll keep buying every local low until then.
Also I mentioned if 3310 turns flips on down side then buy at 3290 will be the perfect buy.

Xauusd and gold wasn next move police📈 TradingView Professional Bullish Idea – XAUUSD (Gold/USD)
Timeframe: 1H
Bias: Bullish, with confirmation from FVG & CHoCH
Structure:
Strong Break of Market Structure (BMS)
CHoCH (Change of Character) confirming bullish shift
Fair Value Gap (FVG) filled and respected
Price above EMA 50 & 100, showing momentum alignment
---
📌 Trade Plan (Professional Format)
> ENTRY ZONE:
Watch for bullish continuation above 3,339–3,343 FVG zone
Confirmation: Strong candle close above FVG with volume support
> TP Targets:
🎯 TP1: 3,350.00 (previous minor high – already hit)
🎯 TP2: 3,361.00 (liquidity target)
🎯 TP3: 3,375.00 (upper imbalance target)
> STOP LOSS:
🛑 Below 3,324.00 (below previous BMS & demand block)
> Invalidation:
Price closes below 3,322 with volume → invalidates bullish thesis
---
🔍 Idea Summary
> Price has respected demand zone with strong BMS & CHoCH.
FVG filled with bullish reaction suggests possible continuation.
As long as price stays above the EMA cluster and demand, bulls are in control.

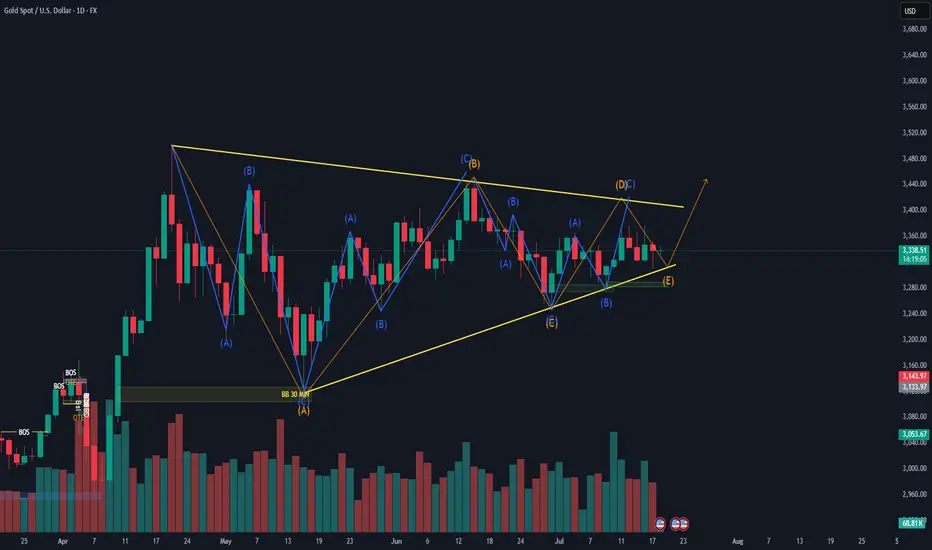
Symmetrical Triangle Correction – Elliott Wave PerspectiveSymmetrical Triangle Correction – Elliott Wave Perspective
The image depicts a Symmetrical Triangle Correction, a common corrective pattern in Elliott Wave Theory. This formation is typically observed during wave 4 or within a complex correction, and it signals consolidation before the next impulsive move.
Structure:
A symmetrical triangle is composed of five corrective waves, labeled A-B-C-D-E.
Each wave itself is subdivided into a-b-c zigzag patterns, indicating a 3-3-3-3-3 structure.
The triangle is bounded by two converging trendlines—one sloping downwards and the other upwards—forming a symmetrical shape.
Key Characteristics:
Occurs after a strong impulse, representing a period of indecision or balance between bulls and bears.
Volume typically contracts during the triangle formation.
The triangle resolves in the direction of the prior trend, meaning this is usually a continuation pattern.
Each leg (A to E) gets progressively smaller, reflecting decreasing volatility.
Market Psychology:
Wave A: Initial reaction to overextension in the previous move.
Wave B: Market attempts to resume the trend but fails.
Wave C: Bears regain strength but with less momentum.
Wave D: Bulls push again, but still no breakout.
Wave E: Final shakeout before breakout.
Trading Implication:
A breakout often occurs after wave E, confirming the end of the correction.
Traders may enter positions in the direction of the prior trend with a stop below/above wave E, targeting a move equal to the widest part of the triangle.
XAUUSD - Falling Wedge Parallel ChannelGold Volatility being more. Banks increasing the gold inventories, may surge to new highs. Sharing Some idea it may go either way some big rally or big correction.
This chart is only for educational purpose, Do your own study before taking any trades
July 18, 2025 - XAUUSD GOLD Analysis and Potential Opportunity🔍 Key Levels to Watch:
• 3375 – Top of range
• 3366 – Resistance
• 3358 – Resistance
• 3350 – Midpoint
• 3345 – Resistance
• 3336 – Support
• 3330–3332 – Support zone
• 3320 – Intraday key support
• 3310 – Key support
• 3300 – Psychological level
📈 Intraday Strategy:
• SELL if price breaks below 3336 → target 3332, then 3330, 3325, 3320
• BUY if price holds above 3345 → target 3348, then 3352, 3358, 3366
👉 If you find this helpful or traded using this plan, a like would mean a lot and keep me motivated. Thanks for the support!
Disclaimer: This is my personal opinion, not financial advice. Always trade with proper risk management.
