Gold will exit from pennant and then rise to resistance levelHello traders, I want share with you my opinion about Gold. Recently, the price formed a pennant pattern after a sharp bullish impulse from the buyer zone (3275–3285 points). That upward movement started after the price bounced off the strong support level (3285) and broke out from the wedge structure formed earlier. This bullish momentum indicated strong demand near the lower boundary, reinforcing the current market structure. Now, the price is consolidating inside the pennant formation, slowly approaching its apex. At the same time, we are still above the support trendline and close to the upper border of the pattern. This suggests a possible breakout to the upside. I expect that gold will soon exit the pennant and start rising again toward the resistance level at 3385, which also matches the seller zone (3385–3395 points). This area previously acted as a major reversal zone, so if price reaches it, I will consider locking profits at that point. Given the breakout structure, recent bounce from the buyer zone, and current bullish consolidation, I remain bullish and expect GOLD to continue growing toward TP 1 at 3385. Please share this idea with your friends and click Boost 🚀
Disclaimer: As part of ThinkMarkets’ Influencer Program, I am sponsored to share and publish their charts in my analysis.
CFDGOLD trade ideas

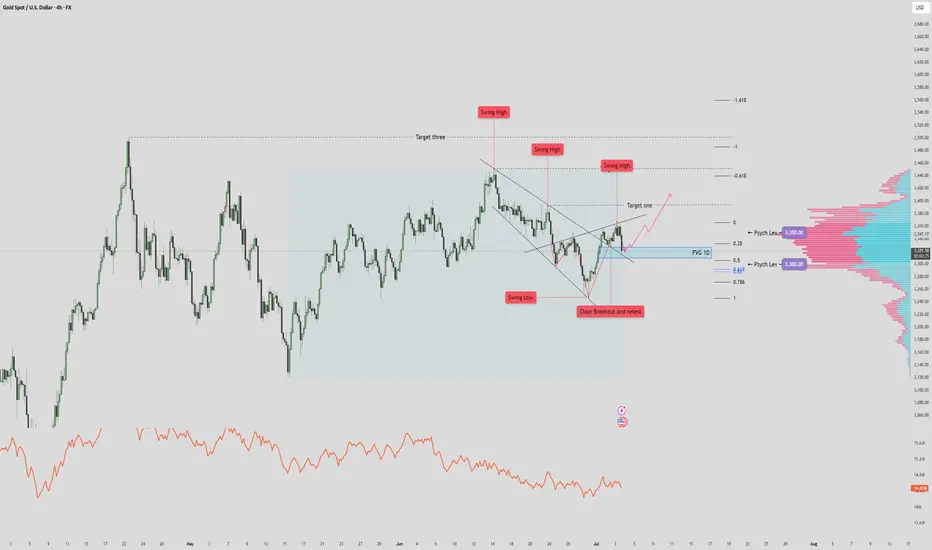
XAUUSD $3500 Recovery? Reverse Heads and Shoulders? 🔎 STRUCTURE & TECHNICAL ELEMENTS
1. Pattern:
A falling wedge was formed and broken cleanly to the upside → bullish reversal structure.
Breakout was followed by a successful retest at prior structure lows (marked “Clear Breakout and Retest”).
2. Fair Value Gap (FVG 1D) Zone:
Currently being tested. This zone coincides with:
Minor support from prior consolidation
Fib retracement (0.5 level)
Potential demand area (watch for bullish reaction/candle structure here)
3. Volume Profile:
3,350 = POC (Point of Control) → heavy resistance.
3,300 = Secondary HVN → strong support below current price.
Low-volume nodes just under current price → if broken, price likely accelerates into the GP zone.
4. Fibonacci & Liquidity Confluence:
Golden Pocket (3287) just below 3,300 = ideal liquidity draw if FVG fails.
Target 1 / 2 / 3 above are Fibonacci-based projections + historical swing zones.
✅ SCENARIO 1: Bullish Case – FVG Holds
If price respects the FVG 1D zone, expect:
Continuation up toward Target One (~3,430)
Extension to Target Two (~3,470) and even Target Three (~3,540+) possible
Confirmation: Bullish engulfing / high-volume bounce / sweep of intraday lows without close below FVG
Bias: Bullish continuation as long as price holds above FVG/0.5 Fib
🚨 SCENARIO 2: Bearish Case – FVG Breaks Down
If price closes below FVG zone, particularly below 3,312:
High probability drop toward 3,300 (psych level)
Liquidity sweep and deeper correction into Golden Pocket (~3,287) likely
This area can act as a high-probability long re-entry zone
Bias: Short-term bearish if close below FVG + swing structure invalidation
⚖️ REFINED SUMMARY
Price rejects off FVG - we can expect target 1 and 2 tagged.
Price breaks & closes below FVG zone - we can expect it to drop/wick to 3,300
HelenP I. Gold can correct to trend line and then bounce upHi folks today I'm prepared for you Gold analytics. If we look at the chart, we can see that gold has formed a broadening wedge pattern with several touches of the trend line, which acts as a dynamic support. After a strong drop, the price found support near the 3295 level and rebounded, forming a local upward movement. However, bulls have not yet shown a strong impulse, and the price is still trading below the resistance zone between 3390 and 3400 points. Currently, the price is hovering just above the trend line, and appears to be testing this support again. I expect a short decline, possibly to the area around 3295 - 3285 points - that’s the key support zone. If this area holds and we see a bounce, it will confirm that buyers are still active and ready to push the price up again. In this case, we could see gold continue moving inside the wedge pattern and aim for the upper resistance. My goal is set at the 3390 level, right near the wedge's upper border and strong resistance. This target matches the local highs from previous attempts, and if bulls gain momentum, they may try to break through this zone. But for now, I remain cautiously bullish and expect gold to bounce off the trend line and move upward toward the resistance. If you like my analytics you may support me with your like/comment.❤️
Disclaimer: As part of ThinkMarkets’ Influencer Program, I am sponsored to share and publish their charts in my analysis.

THE KOG REPORT - UpdateEnd of day update from us here at KOG:
We said we would stick with the plan and look for the higher levels on Gold, which we did and worked well. Once we approached the red box however, you'll notice we broke straight through it. The indicators then gave us numerous long signals which meant we either got in with the madness of the move, or, simple waited for the red box target to hit and then attempt the short on the RIP, which is moving nicely at the moment.
Now resistance is on the flip 3350 with support below 3333-5 which is we're we are looking for a potential bounce. We have made a big move today so not expecting much towards the end of the session.
KOG’s bias for the week:
Bullish above 3250 with targets above 3278✅, 3285✅, 3297✅ and above that 3306✅
Bearish below 3250 with targets below 3240, 3232, 3220 and below that 3212
RED BOX TARGETS:
Break above 3275 for 3279✅, 3285✅, 3289✅ and 3306✅ in extension of the move
Break below 3260 for 3255, 3251, 3240 and 3235 in extension of the move
As always, trade safe.
KOG

DeGRAM | GOLD held the support area📊 Technical Analysis
● Bullish rebound from the green 3 250-3 300 demand, where the rising-channel base and May’s inner trend-line intersect, prints a higher low and invalidates the prior break.
● Price is reclaiming the channel median; a push through 3 378 unlocks the June swing cap at 3 434, while risk is contained by the fresh pivot turned support at 3 300.
💡 Fundamental Analysis
● Softer US ISM-Mfg prices and a dip in 2-yr yields eased dollar pressure, while IMF data show another uptick in official gold purchases—both restoring near-term bid.
✨ Summary
Long 3 300-3 320; hold above aims 3 378 → 3 434. Invalidate below 3 250.
-------------------
Share your opinion in the comments and support the idea with a like. Thanks for your support!

Gold Breakout and Potential RetraceHey Traders, in today's trading session we are monitoring XAUUSD for a selling opportunity around 3,350 zone, Gold was trading in an uptrend and successfully managed to break it out. Currently is in a correction phase in which it is approaching the retrace area at 3,350 support and resistance zone.
Trade safe, Joe.

Gold price recovers above 3300⭐️GOLDEN INFORMATION:
Gold (XAU/USD) trades at $3,292 after rebounding from an intraday low of $3,246 and looks set to close out June with a modest gain of over 0.18%. However, its upward momentum has been restrained by easing geopolitical tensions in the Middle East and growing optimism over forthcoming trade agreements. Meanwhile, analysts at Citi expect Gold to consolidate within the $3,100 to $3,500 range throughout the third quarter.
In Washington, US Treasury Secretary Scott Bessent expressed confidence that the “One Big Beautiful Bill” will make progress in the coming hours. The sweeping tax reform legislation, which narrowly passed the Senate over the weekend, includes major tax deductions funded by reductions in Medicaid spending and green energy incentives.
⭐️Personal comments NOVA:
Gold price recovers above 3300 , ahead of NF reports this week . Accumulates above 3300
⭐️SET UP GOLD PRICE:
🔥SELL GOLD zone: 3353- 3355 SL 3360
TP1: $3340
TP2: $3330
TP3: $3320
🔥BUY GOLD zone: $3272-$3270 SL $3265
TP1: $3283
TP2: $3295
TP3: $3310
⭐️Technical analysis:
Based on technical indicators EMA 34, EMA89 and support resistance areas to set up a reasonable BUY order.
⭐️NOTE:
Note: Nova wishes traders to manage their capital well
- take the number of lots that match your capital
- Takeprofit equal to 4-6% of capital account
- Stoplose equal to 2-3% of capital account

Gold 30 Min Engaged ( Dual Entry's Detected )➕ Objective: Precision Volume Execution
Time Frame: 30-Minute Warfare
Entry Protocol: Only after volume-verified breakout
🩸 Bullish Reversal : 3309
Volume Poc + Value
🩸 Bearish Reversal : 3284
Volume Poc + Value
➗ Hanzo Protocol: Volume-Tiered Entry Authority
➕ Zone Activated: Dynamic market pressure detected.
The level isn’t just price — it’s a memory of where they moved size.
Volume is rising beneath the surface — not noise, but preparation.
🔥 Tactical Note:
We wait for the energy signature — when volume betrays intention.
The trap gets set. The weak follow. We execute.

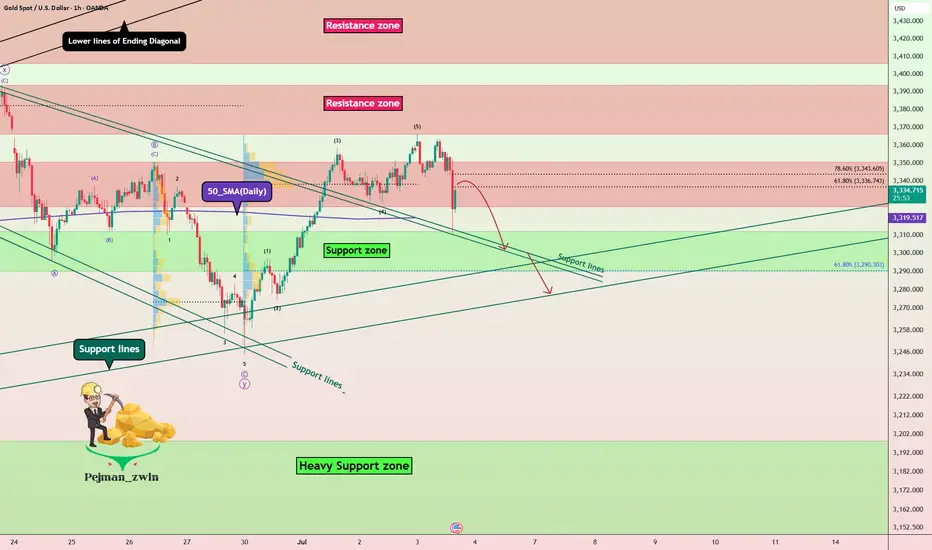
Gold Under Pressure After NFP Beat – More Downside Ahead?Moments ago, the US Non-Farm Payrolls surprised to the upside at 147K (vs 111K forecast), while the Unemployment Rate dropped to 4.1% (vs 4.3% expected) .
This stronger-than-expected labor market data reinforces the idea that the Fed has no immediate reason to cut rates. As a result, the USD( TVC:DXY ) strengthened, and gold came under renewed selling pressure.
If the dollar momentum continues, Gold ( OANDA:XAUUSD ) may face further downside in the short term.
In terms of Technical Analysis , Gold fell below the Resistance zone($3,350-$3,326) again after the announcement of US indices and is currently moving near the Support lines and 50_SMA(Daily) .
In terms of Elliott wave theory , it seems that Gold has completed 5 impulsive waves in the one-hour time frame, and we should now wait for corrective waves .
I expect Gold to fall again after the upward correction , and the Support zone($3,312-$3,290) could be the target.
Note: Stop Loss (SL) = $3,365
Gold Analyze (XAUUSD), 1-hour time frame.
Be sure to follow the updated ideas.
Do not forget to put a Stop loss for your positions (For every position you want to open).
Please follow your strategy; this is just my idea, and I will gladly see your ideas in this post.
Please do not forget the ✅ ' like ' ✅ button 🙏😊 & Share it with your friends; thanks, and Trade safe.
Gold Breakout and Potential RetraceHey Traders, in today's trading session we are monitoring XAUUSD for a buying opportunity around 3,330 zone, Gold was trading in a downtrend and successfully managed to break it out. Currently is in a correction phase in which it is approaching the retrace area at 3,330 support and resistance area.
Trade safe, Joe.

Gold - The final resistance breakout!Gold - TVC:GOLD - prepares a final rally:
(click chart above to see the in depth analysis👆🏻)
Over the past 12 months, Gold rallied more than +70%. However the past three months clearly rejected a major horizontal resistance. But price action on the smaller timeframe remains incredibly bullish. Therefore an all time high breakout will most likely follow.
Levels to watch: $3.500
Keep your long term vision!
Philip (BasicTrading)

THE KOG REPORT - UpdateEnd of day update from us here at KOG:
Not a bad start to the week with the path working well, we got the swoop we wanted and the opportunity for the long presented itself. We've completed quite a few of the bias targets as well as the red box targets, so now, with it being the last trading day of the month and quarter and tomorrow being the first, we'll take a back seat.
Support stands at the 3275 level with resistance still at 3404-6. Higher box is defence so we'll stick with it and see if it works how we intended.
KOG’s bias for the week:
Bullish above 3250 with targets above 3278✅, 3285✅, 3297 and above that 3306
Bearish below 3250 with targets below 3240, 3232, 3220 and below that 3212
RED BOX TARGETS:
Break above 3275 for 3279✅, 3285✅, 3289✅ and 3306 in extension of the move
Break below 3260 for 3255, 3251, 3240 and 3235 in extension of the move
As always, trade safe.
KOG

Gold on the Move – Major Resistance Levels to Watch AheadThe current price action looks strong, and if the bullish momentum continues, we have three main target levels in mind.
The first target is $3,380. This is an important level we expect gold to reach soon if the trend continues upward.
If the price breaks above $3,380, the next target is $3,433. This level is likely to act as a strong resistance, meaning the price might slow down or pull back here. But if gold can push through it with strength, that’s a strong signal of continued upside.
After that, the third target is $3,495, which would mark a strong extension of the current bullish trend.
As long as gold stays above key support levels, we believe the bullish outlook remains valid, and these targets are possible in the coming days or weeks.

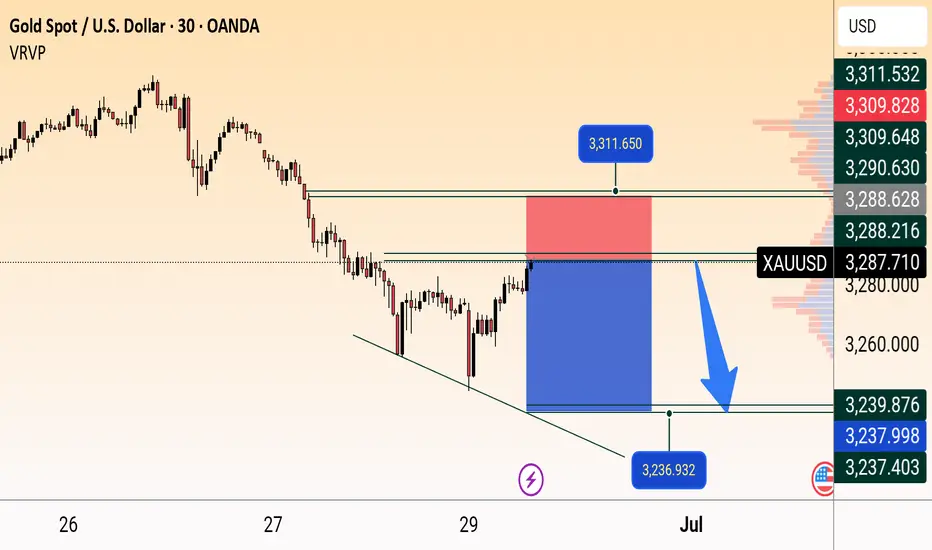
XAU/USD Bearish Rejection Setup Below Resistance ZoneXAU/USD (Gold) is forming a bearish setup on the 30-minute chart. Price is testing a resistance near 3288, with a potential reversal towards the 3236 level. Entry is marked around current price, with a stop loss at 3311 and take profit near 3237, supported by a descending channel.
HelenP. I Gold will make small correction and then continue growHi folks today I'm prepared for you Euro analytics. In this chart, we can see how the price declined to the 3245 support level, which coincided with the support zone, and then started to grow. In a short time, it reached the 3395 resistance level, which coincided with the resistance zone, and then dropped to the trend line, breaking two levels, and made a gap. After this movement, the price started to grow in a wedge and soon reached the support level, which broke it and continued to rise next. Later, it made a correction to the 3245 level and then continued to move up and reached the resistance level. Price bounced from this level and corrected, after which it turned around and rose to the resistance line of the wedge pattern, breaking the 3395 resistance level. But soon, it turned around and corrected to the trend line. Not a long time ago, price exited from the wedge, fell to the support level, and then started to grow. For this case, I expect that XAUUSD will make a small correction. Then I think it can continue to grow and reach the 3395 resistance level, which is my current goal. If you like my analytics you may support me with your like/comment.❤️
Disclaimer: As part of ThinkMarkets’ Influencer Program, I am sponsored to share and publish their charts in my analysis.

GOLD 3H Chart Pattern, I have marked a cup formationGOLD 3H Chart Pattern, I have marked a cup formation, which often indicates a bullish reversal setup. Based on the chart:
Key Levels:
Current Price Zone: Around 3,323 - 3,330
First Target: Near 3,380 - 3,400
Final Target: Near 3,440 - 3,460
Analysis:
Price is forming a cup pattern with resistance around 3,380 - 3,400
Break above 3,400 could lead towards the final target zone of 3,440 - 3,460
Watch for price reaction near Ichimoku Cloud; clean breakout above the cloud confirms bullish momentum
Suggested Targets:
✅ First Target: 3,380 - 3,400 USD
✅ Second Target: 3,440 - 3,460 USD
Note: Wait for confirmation above 3,330 - 3,340 and bullish momentum to continue.
If you want, I can also give stop-loss and entry suggestions based on this chart. Let me know!

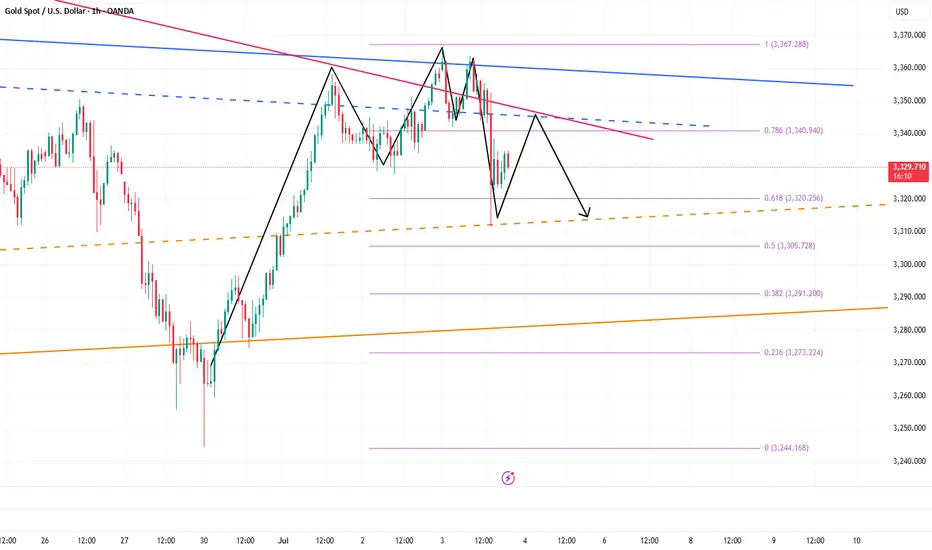
XAU/USD) bearish reversal analysis Read The captionTechnical analysis of (XAU/USD) based on price action and technical indicators on the 15-minute timeframe. Here's a
---
Key Technical Insights:
1. Resistance Level (Highlighted Yellow Zone):
Price is approaching a strong resistance zone (previous rejection marked by red arrows).
This area has historically pushed price downward.
2. Trendline Support (Rising Black Line):
Price has been following a short-term ascending trendline, forming higher lows.
A break below this trendline signals potential bearish reversal.
3. EMA 200 (Blue Line):
Price is currently above the EMA 200, indicating short-term bullish momentum.
However, price is testing resistance — a rejection could flip momentum bearish.
4. Bearish Rejection & Projection:
The chart shows an anticipated rejection from resistance, followed by a break of trendline support.
Target zone is marked near 3,228.098, indicating a drop of ~94 points from the current level.
5. RSI (Relative Strength Index):
RSI is nearing overbought territory (68.79).
A bearish divergence or RSI crossing down may confirm weakening momentum.
Mr SMC Trading point
---
Conclusion / Trading Idea:
Bias: Bearish
Entry Zone: Near the resistance level (~3,322)
Confirmation: Break of trendline support
Target: 3,228
Stop-Loss: Above resistance zone (just over the upper trendline)
---
pelas support boost 🚀 this analysis)

GOLD/USD Bearish Rejection From Resistance Zone – Potential DropGOLD/USD Bearish Rejection From Resistance Zone – Potential Drop Ahead! 🎯
📊 Technical Analysis Summary:
The chart illustrates a bearish setup forming after multiple rejection points near a key resistance zone around 3,360–3,380 USD.
🔍 Key Observations:
🔴 Double Rejection Pattern:
Red arrows highlight strong bearish rejections from resistance.
Indicates sellers are defending this zone aggressively.
🟠 Support Turned Resistance:
The previous support (labelled as "SUPPOT") is now acting as resistance.
Classic bearish retest behavior.
🔷 Bearish Flag Formation:
Price consolidates in a descending flag pattern.
Breakdown below the flag suggests continuation to the downside.
🎯 Target Zone:
If breakdown confirms, price may drop towards target area near 3,275–3,280 USD (marked as “TARGET FAXS”).
🟧 Important Reaction Zones:
Multiple orange circles indicate zones of high reaction – historically significant for both buyers and sellers.
📌 Conclusion:
Unless bulls reclaim the 3,360–3,380 resistance zone convincingly, the bias remains bearish, and the next leg down may target the 3,280 USD area.
🔔 Traders should watch for a clean break below 3,320 to confirm bearish continuation.

Gold Trading Strategy July 3✏️D1 candle continues to increase towards the price gap zone. At the beginning of the European session, sellers accept to enter the market at this resistance price zone around 3365. The accumulation pattern of gold price is forming a triangle pattern.
The lower boundary is broken, it will lead to the breakout point of the lower boundary and vice versa, if the upper boundary of the triangle is broken, the price will move towards the next resistance.
📉 Key Levels
Resistance: 3388-3363
Support: 3330-3311-3297-3277
Buy trigger: breakout above 3363
Sell trigger: breakout below 3330
If this idea resonates with you or you have other ideas, please comment. I look forward to reading your thoughts!
Best regards, VHT Traders!

Continue to short gold, bears will exert force againAffected by the NFP market, gold fell precipitously, almost giving back 50% of the gains in the previous wave, and the short-selling performance was particularly strong; technically, gold successfully built a double-top structural resistance in the 3365-3363 area in the short term, which played a technical suppression role in the short term. As gold fell, the current short-term resistance moved down to the 3340-3350 area;
On the other hand, although gold began to rebound after falling to around 3312, it clearly showed the characteristics of weak rebound, and it did not even stand above 3340 once, and the long forces were insufficient; and technically, a single lower shadow line was not enough to support the continued rebound of gold, so gold still had the need to retrace the support below from a technical perspective; and once gold fell again, it was very likely to test the 3305-3295 area again.
So I think we can take advantage of the rebound of gold to short gold again. We can still short gold with the 3340-3350 area as resistance and look at the target area: 3315-3305-3295.
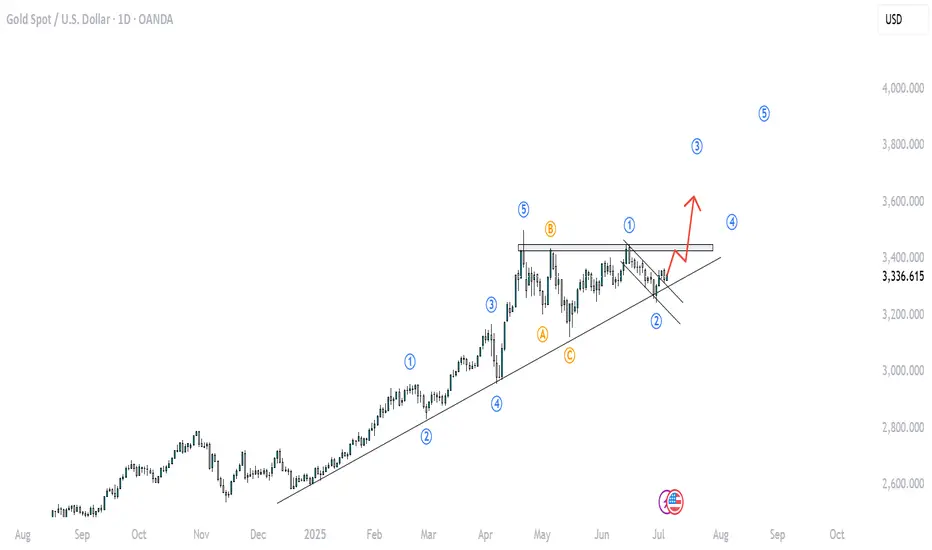
XAUUSD REVERSAL OR CONTINUATION?The analysis on GOLD in D1 shows us a bullish structure for several months. But could this be the end of this trend with the current configuration? NO!!!! today in July 2025 we can see that the price is facing strong resistance which has already been tested 3 times? certainly this resistance is solid but it is not what will reverse the trend. Indeed, looking more closely at this configuration we can see that the price forms a well-known chart pattern "THE ASCENDING TRIANGLE" which indicates a continuation of the trend. Furthermore, the price, still in its bullish run, rebounded on our D1 support LINE, thus marking the end of our retracement of the first wave and the start of the third which will go so far as to break the resistance in D1 and offer us new historic highs. DONNEZ VOS AVIS EN COMMENTAIRE.
Gold: Eyes on QML Zone for Potential Reaction Before Deeper DropHello guys!
Let's go deep into the GOLD chart!
Price has completed a liquidity grab near 3440 (marked as "a hunting") and is now heading downward toward a key QML zone.
First, a reaction is expected around the QML area (3180–3220), where previous structural interest and demand may cause a temporary bounce.
After this reaction, the price is likely to retest higher, potentially forming a lower high.
Then, the dominant bearish structure is expected to continue, with a possible sharp drop toward the final demand zone around 3050–3080.
This movement represents a classic manipulation.

DeGRAM | GOLD retest of the resistance line📊 Technical Analysis
● Price holds above the broken blue resistance line, now acting as support near 3 347, while an inner up-sloper is guiding a stair of higher lows inside the new grey channel.
● The confluence of channel mid-line and 3 355 swing high is the gate; its clearance activates an equal-width objective at 3 380, with the outer rail / former consolidation lid at 3 425 next.
💡 Fundamental Analysis
● Easing US ISM-services prices trimmed real 2-yr yields and the dollar, while latest WGC data show June net central-bank purchases rising for a third month, reviving dip-buying in gold.
✨ Summary
Long 3 345–3 355; hold above 3 355 targets 3 380 → 3 425. Invalidate on an H1 close below 3 320.
-------------------
Share your opinion in the comments and support the idea with a like. Thanks for your support!

XAUUSD Weekly Chart Buying area📊 XAU/USD (Gold) Price Analysis – 4H Chart
🕒 Date: July 6, 2025
🔍 Technical Overview:
Gold is currently trading around the $3,337 level, showing signs of consolidation after a recent bounce.
🔸 Key Zones:
🟡 Resistance Area 1: $3,295 - $3,310
🟡 Resistance Area 2: $3,250 - $3,270
🟡 Target Zone: $3,390 - $3,410
📈 Possible Scenarios:
Price may retrace to the $3,295 - $3,310 resistance area, hold support, and aim for the $3,390 - $3,410 target zone.
A deeper pullback to the lower $3,250 - $3,270 resistance turned support area may occur before a stronger bullish move.
Breakout confirmation will come on a clean close above the $3,337 level with volume.
📌 Bias: Bullish above the $3,295 level
📌 Watch for: Bullish price action or liquidity grabs near support zones
💡 This setup is based on structure, liquidity zones, and institutional footprints.
