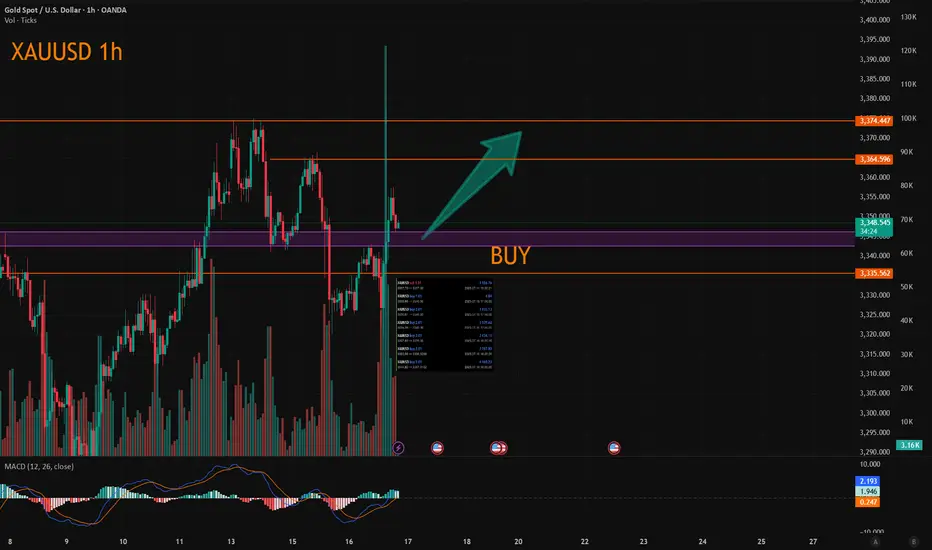
Excellent profits booked As I mentioned in yesterday’s commentry session:
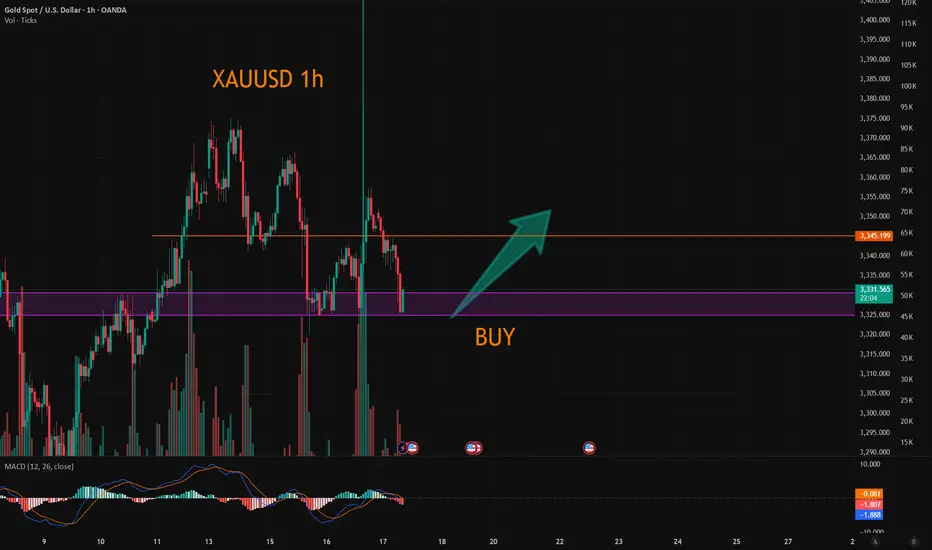
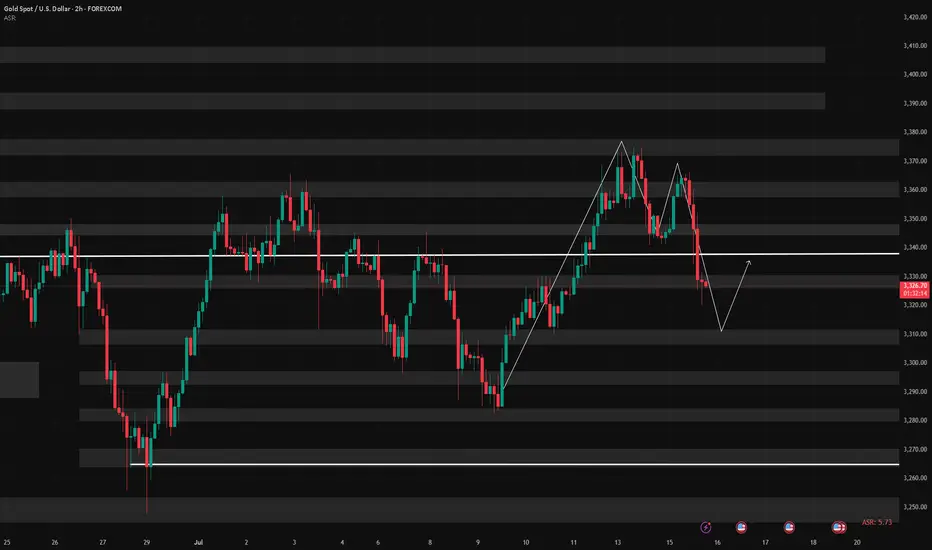
My strategy is still the same – buying every dip in Gold around my key level yesterday at 3312, which the market respects well and as our first target was 3345
I'm aiming for a breakout to the upside.
Very happy with the profits so far.
My medium-term targets remain 3380 &3,400 and I’ll keep buying every local low until then.
Also I mentioned if 3310 turns flips on down side then buy at 3290 will be the perfect buy.
CFDGOLD trade ideas

Xauusd and gold wasn next move police📈 TradingView Professional Bullish Idea – XAUUSD (Gold/USD)
Timeframe: 1H
Bias: Bullish, with confirmation from FVG & CHoCH
Structure:
Strong Break of Market Structure (BMS)
CHoCH (Change of Character) confirming bullish shift
Fair Value Gap (FVG) filled and respected
Price above EMA 50 & 100, showing momentum alignment
---
📌 Trade Plan (Professional Format)
> ENTRY ZONE:
Watch for bullish continuation above 3,339–3,343 FVG zone
Confirmation: Strong candle close above FVG with volume support
> TP Targets:
🎯 TP1: 3,350.00 (previous minor high – already hit)
🎯 TP2: 3,361.00 (liquidity target)
🎯 TP3: 3,375.00 (upper imbalance target)
> STOP LOSS:
🛑 Below 3,324.00 (below previous BMS & demand block)
> Invalidation:
Price closes below 3,322 with volume → invalidates bullish thesis
---
🔍 Idea Summary
> Price has respected demand zone with strong BMS & CHoCH.
FVG filled with bullish reaction suggests possible continuation.
As long as price stays above the EMA cluster and demand, bulls are in control.

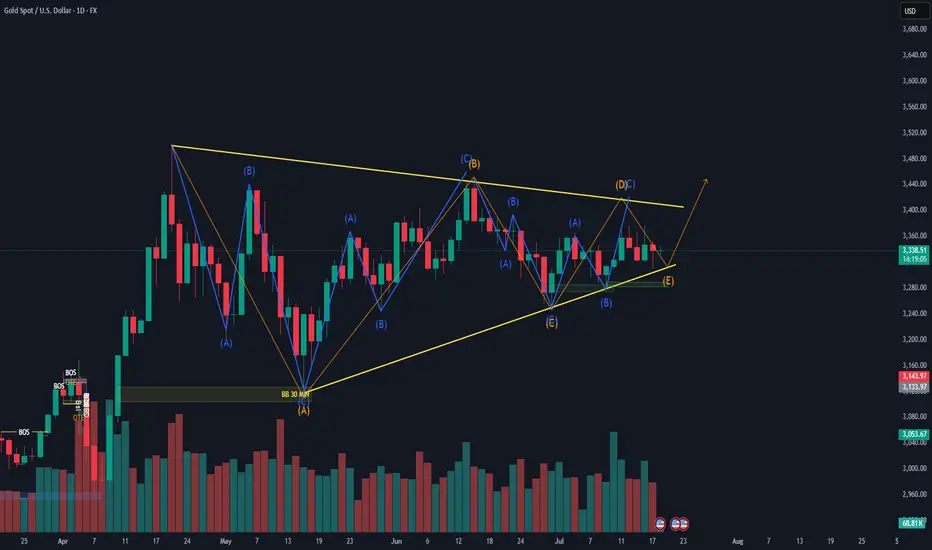
Symmetrical Triangle Correction – Elliott Wave PerspectiveSymmetrical Triangle Correction – Elliott Wave Perspective
The image depicts a Symmetrical Triangle Correction, a common corrective pattern in Elliott Wave Theory. This formation is typically observed during wave 4 or within a complex correction, and it signals consolidation before the next impulsive move.
Structure:
A symmetrical triangle is composed of five corrective waves, labeled A-B-C-D-E.
Each wave itself is subdivided into a-b-c zigzag patterns, indicating a 3-3-3-3-3 structure.
The triangle is bounded by two converging trendlines—one sloping downwards and the other upwards—forming a symmetrical shape.
Key Characteristics:
Occurs after a strong impulse, representing a period of indecision or balance between bulls and bears.
Volume typically contracts during the triangle formation.
The triangle resolves in the direction of the prior trend, meaning this is usually a continuation pattern.
Each leg (A to E) gets progressively smaller, reflecting decreasing volatility.
Market Psychology:
Wave A: Initial reaction to overextension in the previous move.
Wave B: Market attempts to resume the trend but fails.
Wave C: Bears regain strength but with less momentum.
Wave D: Bulls push again, but still no breakout.
Wave E: Final shakeout before breakout.
Trading Implication:
A breakout often occurs after wave E, confirming the end of the correction.
Traders may enter positions in the direction of the prior trend with a stop below/above wave E, targeting a move equal to the widest part of the triangle.
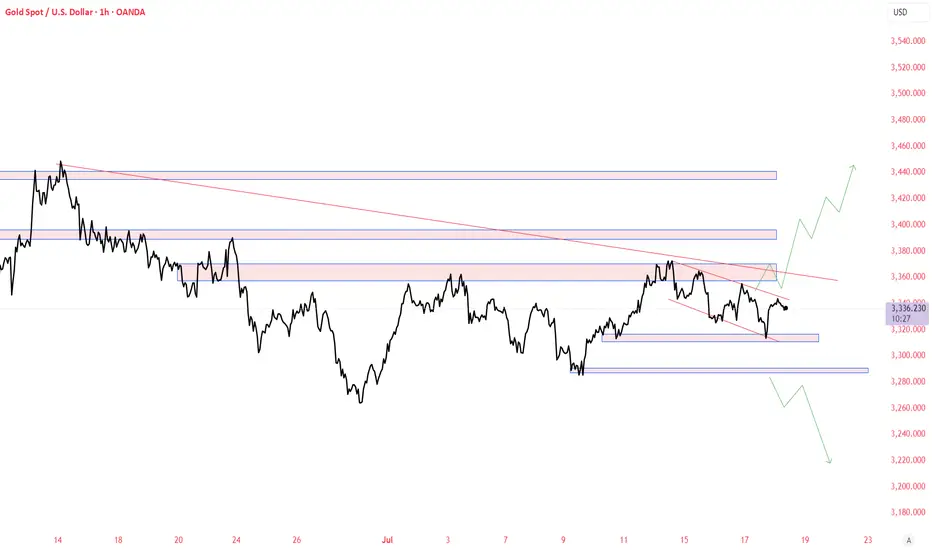
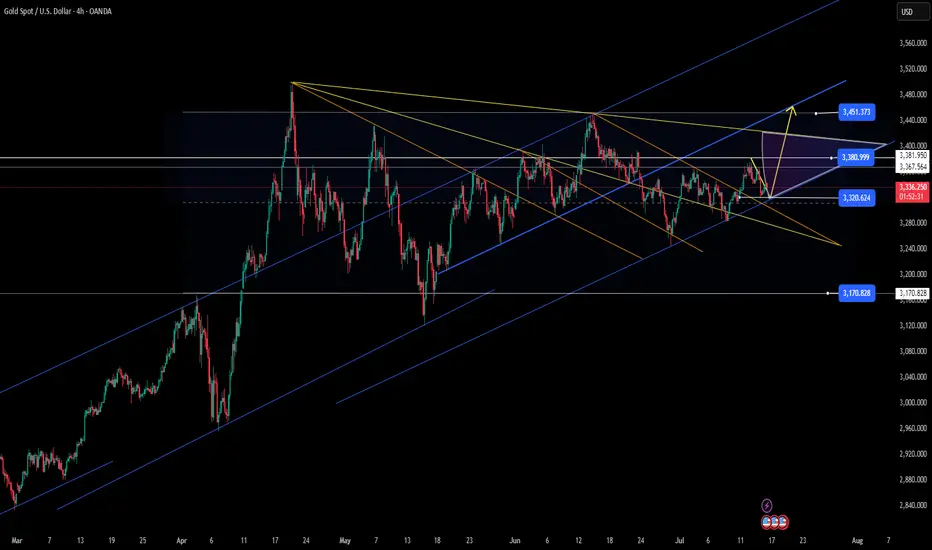
XAUUSD - Falling Wedge Parallel ChannelGold Volatility being more. Banks increasing the gold inventories, may surge to new highs. Sharing Some idea it may go either way some big rally or big correction.
This chart is only for educational purpose, Do your own study before taking any trades
July 18, 2025 - XAUUSD GOLD Analysis and Potential Opportunity🔍 Key Levels to Watch:
• 3375 – Top of range
• 3366 – Resistance
• 3358 – Resistance
• 3350 – Midpoint
• 3345 – Resistance
• 3336 – Support
• 3330–3332 – Support zone
• 3320 – Intraday key support
• 3310 – Key support
• 3300 – Psychological level
📈 Intraday Strategy:
• SELL if price breaks below 3336 → target 3332, then 3330, 3325, 3320
• BUY if price holds above 3345 → target 3348, then 3352, 3358, 3366
👉 If you find this helpful or traded using this plan, a like would mean a lot and keep me motivated. Thanks for the support!
Disclaimer: This is my personal opinion, not financial advice. Always trade with proper risk management.

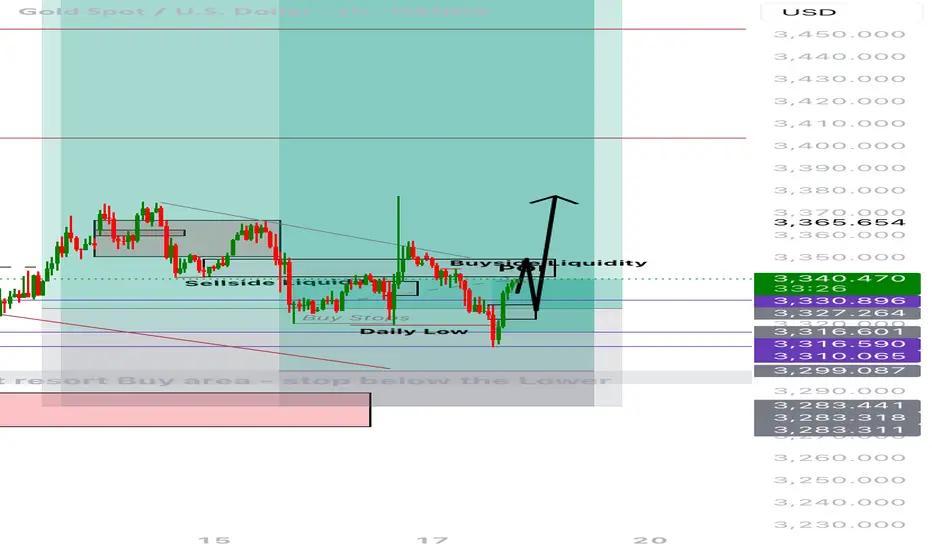
Re-attempt to buy?Trade Journal Entry – XAUUSD (Gold Spot)
Date: July 17, 2025
Platform: TradingView (Demo Account)
Timeframe: 1H/4H
Direction: Long Bias
Status: Stopped Out – Awaiting New Setup
Result of Last Trade: +£33
New Plan: Wait for buy opportunity in Asian or London session
Previous Trade Outcome
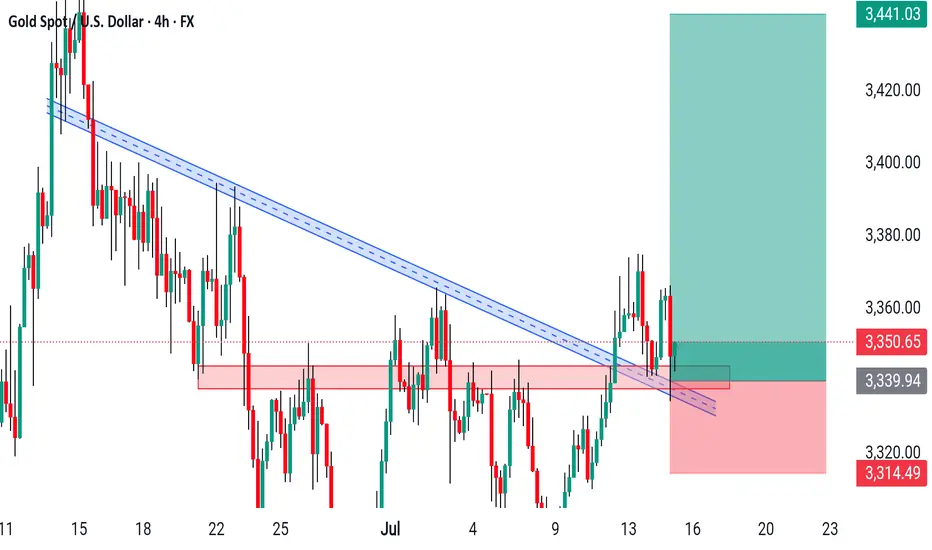
Entry was valid at POI based on bullish setup logic.
Trade failed to break structure to the upside convincingly.
Stop-out occurred after price pushed below mitigation zone (~3,316).
However, due to early partials and trade management, the result was a net profit of £33.
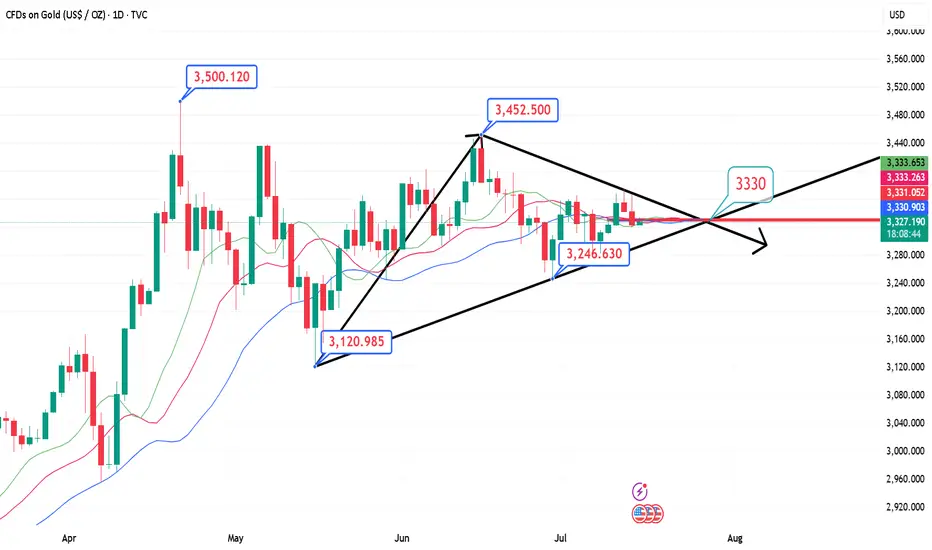
Updated Outlook
Price has rebounded aggressively from just below Daily Low.
Current price near 3,339.305 — strong push back into prior structure.
Buyside liquidity and POI overhead acting as short-term magnet.
Ideal pathing (marked with black arrows):
→ Sweep POI
→ Retest structure (likely near 3,327–3,330)
→ Continuation toward 3,365+, targeting liquidity void above.
Entry Plan
Await price to revisit POI, potentially after liquidity run.
Ideal confirmation setup:
- SFP or bullish engulfing on M15–H1
- Volume divergence or re-accumulation pattern
Target entry during Asian or early London session when liquidity is typically engineered.
Management Approach
- Keep risk tight on re-entry (0.5% max risk)
- SL below new HL formed during retest
- TP: 3,365 / extended 3,380–3,390 depending on session follow-through
- If no clean retest, skip trade — don’t chase
Emotional Reflection
Felt more in control than previous attempts. Took the stop like a professional.
No revenge trades — staying focused on structure and quality.
Grateful that proper risk management led to a small win despite being stopped out.
Reflection Questions
- Did I adjust my expectations quickly once structure failed?
- Am I giving the market enough space and time to form clean entries?
- Will I stay patient for session-specific setups?
XAUUSD:Go long
Based on the 4-hour analysis, the short-term support below for today remains focused on the area around 3318-25, while the short-term resistance above focuses on the 3340-45 level. The key resistance above is at 3380. Overall, this range remains the main framework for our participation in the trade, with positions generally being cautious and waiting for key levels to enter. I will provide specific trading strategies during the session, so please stay tuned. Given that the current market has retraced to 3325 and then rebounded, we can go long in the 3325-30 range.
Trading Strategy:
BUY@3325-30
TP:3340-45
More detailed strategies and trading will be notified here ↗↗↗
Keep updated, come to "get" ↗↗↗
Trump's five major factors! Will gold continue to rise?The past six months may have been dizzying, but a clear theme has emerged since U.S. President Donald Trump returned to the White House: It’s good news for the gold market.
Although gold prices broke through $3,500 an ounce nearly three months ago, setting a new record high, five key factors that have emerged since the start of Trump’s second term are likely to continue to support gold prices in the coming months. These factors may even prove that the precious metal is becoming a core asset class in investors’ portfolio strategies.
David Miller, co-founder and chief investment officer of Catalyst Funds, said that as the market enters the third quarter, gold remains a standout asset class that “provides both a hedge against the potential risks of geopolitical conflict and a break from the erosion of fiat currencies.”
The first key factor supporting gold is demand from central banks, which indicates that the market has weakened confidence in the U.S. dollar. Miller pointed out in emailed comments that central bank demand is surging, and the BRICS countries, especially China and India, are accelerating the accumulation of gold reserves “as part of a broader de-dollarization strategy.” According to a report released by the World Gold Council on Wednesday, the People’s Bank of China’s official gold holdings have climbed for eight consecutive months.
David Russell, head of global market strategy at TradeStation, said the global tariffs threatened and implemented by Trump have accelerated the "de-dollarization process." De-dollarization refers to efforts by some countries to reduce their reliance on the U.S. dollar as a reserve currency.
"Trade is becoming less dependent on the U.S. end market and less dependent on the dollar. This is more like the 19th century than the era after World War I and World War II," Russell said in emailed comments. "This trend back to the old model is creating structural demand for gold after decades of neglect. Fiat currencies are in decline," he added.
Russell also said the decline in the credit quality of developed country governments, such as the United States, is also a major concern for the market. "We have lost our AAA rating from the three major rating agencies because of growing deficits and looming pressure on unfunded liabilities such as Social Security," he said, referring in part to Moody's downgrading its top credit rating for the United States in May. "After decades of procrastination, we are running out of ways to go."
That said, trade policy is a third factor affecting gold. Russell said that "large budget deficits or increased tariffs" would reduce demand for U.S. Treasuries, supporting gold prices.
With both 2-year and 10-year Treasury yields falling so far this year and real rates under pressure from inflation, "the opportunity cost of holding gold is falling," noted Catalyst Funds' Miller. That's leading to a fourth potential support for gold -- a resurgent interest in gold exchange-traded funds and other alternatives.
In the first half of 2025, North America led the growth in global gold ETF inflows, according to the World Gold Council. Global physically-backed gold ETFs saw inflows of $38 billion in the first half of this year, marking the strongest half-year performance since the first half of 2020, according to the World Gold Council.
Finally, from a technical perspective, gold prices have held above $3,250 an ounce for much of June, Miller said. That shows signs of "a potential breakout as equity market volatility returns," he said. Gold for August delivery closed at $3,359.10 an ounce on Wednesday.
“Gold is not just a crisis hedge, it is becoming a core asset class in modern portfolio strategies.” Miller said that the current macroeconomic environment “justifies a meaningful allocation to gold and gold-related strategies.”
He said: “The combination of fragile stock market sentiment, uncertain policy direction and structural macro headwinds reinforces our view that gold is not just a crisis hedge, it is becoming a core asset class in modern portfolio strategies.” PEPPERSTONE:XAUUSD ACTIVTRADES:GOLD ICMARKETS:XAUUSD ACTIVTRADES:GOLD EIGHTCAP:XAUUSD VELOCITY:GOLD

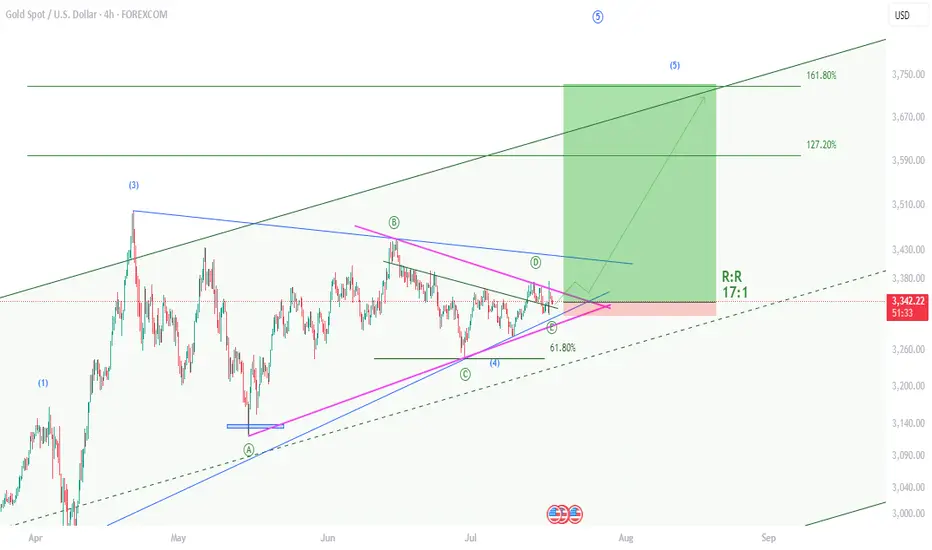
XAUUSD , Bullish Setup , R:R 17Hello friends
I am back after a long time and I want to share the results of my efforts of several years with you.
Gold is starting a 5th wave of bullishness and yesterday it gave us the necessary confirmations by rejecting the previous ceiling. I have identified the best buying position for you now. With a reward to risk 17
Take advantage of this opportunity.
If you are interested in Elliott waves or work in this field at a professional level, contact me and share your analysis with me.
I hope we will all be profitable together.
xauusd:Going long can lead to making money.
This week and last week, we have been continuously recommending a bullish position. There is no doubt that you love trading. Welcome!
POST-CPI CAPTION (TRADINGVIEW)🧩 POST-CPI CAPTION (TRADINGVIEW)
XAU/USD | 15min | Post-CPI Reaction Trade
Headline CPI came in slightly hot (+2.7% YoY), but core softened (+0.2% MoM). Expecting USD strength → bearish gold. Watching $3,371–3,380 for a short entry on CHoCH + volume rejection. Targets $3,350 → $3,337. Soft retrace + clean structure flip may open longs back to $3,400, but only on clear demand reaction.
#SMC #XAUUSD #CPI #LiquiditySweep #OrderFlow #SmartMoney

Gold price fluctuated upward today: target 3400 pointsGold price fluctuated upward today: target 3400 points
Fundamentals:
CPI data: US CPI rose 0.3% month-on-month in June (the largest increase since January), and the core CPI annual rate rose to 2.9%, which strengthened the market's cooling of the Fed's expectations for rate cuts (the probability of a rate cut in September fell to 53%).
US dollar index: rose to 98.70 (a three-week high), suppressing the attractiveness of gold.
Trump's tariff policy: plans to impose tariffs of "slightly above 10%" on several small countries, and the EU plans to impose retaliatory tariffs of US$84.1 billion on US goods, supporting the safe-haven demand for gold.
Technical aspects:
(1) Short-term trend (4-hour line)
Support level: 3320, if it falls below, it will fall to 3300 or even 3222.
Resistance level: 3350 (short-term pressure level), after breaking through, it is expected to challenge 3375-3400.
MACD and RSI: Showing a tug-of-war between bulls and bears, tending to fluctuate upward in the short term.
(2) Medium- and long-term trends (weekly chart)
The rising channel remains intact, the Bollinger Band opening widens, and the medium-term target is $3,400-3,700.
Today's focus
US June PPI data (if it exceeds expectations, it may further suppress expectations of interest rate cuts).
Speech by Fed officials (pay attention to policy direction).
Progress of the trade war (if the tariff conflict escalates, gold may receive safe-haven buying).
Summary and operational suggestions
Short-term:
Gold prices fluctuate in the 3300-3400 range, pay attention to the breakthrough of the 3320 support level and the 3350 resistance level.
Strategy:
Buy on dips (try to go long with a light position near 3330 points, with a stop loss below 3320 points).
Go long after breaking through 3350 (target 3375-3400).
If it falls below 3320, it may further correct back to the 3300-3250 area.
What Gold actually wants to sayThis trend line shows on daily chart that gold is sustaining on his supports and rising day by day, Pure bullish in long run for swing and position trading.

Gold is accelerating downward, pay attention to important supporThe U.S. inflation data for June was released overnight. The actual data showed that U.S. inflation rebounded slightly in June, but it did not exceed expectations. After the data was released, Trump made a speech at Truth A post on Social said that given the low consumer prices, the Fed should lower interest rates. He has been calling for a rate cut for some time, so the market still has some uncertainty about the timing of the Fed's subsequent rate cuts, but the probability is in September. The probability of keeping interest rates unchanged this month is high. The US dollar index is also supported and continues to rebound. Gold fluctuated higher from around 3344 in the morning of the previous trading day. During the European session, it refreshed the intraday high and touched the 3366 line under pressure and maintained repeated narrow consolidation. After the data was released, it first rebounded quickly to the 3360 line and then quickly fell back. After two repetitions, it finally moved downward. In the evening, it fell below the intraday low and once touched around 3320 and then stabilized and rebounded. The daily line closed with a middle shadow. Technically, the continuation of the previous convergence triangle after the break is currently returning to the downward channel again.
Pay attention to the pressure of 3342/44 during the day, and pay attention to the support near 3308 below. If it falls below 3308 again, it will return to the downward channel.
XAUUSD Expecting bullish Movement Gold is showing potential for a bullish reversal from the key support zone between 3390 to 3395. Price has formed a base in this range, and if it holds, we may see an upside breakout above the descending trendline
Buy Zone: 3390 – 3395
First Target: 3355.50
Second Target: 3380.50
A successful breakout and hold above the trendline resistance could trigger a move toward our short-term targets. Watch for bullish confirmation before entering. Manage risk accordingly

7/16: Will Gold Reclaim 3350 or Fall to 3250?During today’s session, gold briefly broke through the 3352–3358 resistance zone, but due to news-driven pressure during the pullback, bullish momentum weakened, and the price retreated to the MA60 support level on the daily chart.
Given the significant retracement, there is a possibility that a short-term bottom may form during the upcoming Asian session, potentially leading to a retest of the 3337-3343/3352-3358 resistance area:
If the price breaks above this zone and holds above it after a pullback, the bullish trend could resume;
However, if it fails to break through or is rejected again, caution is warranted, as this could signal a larger-scale downtrend on the weekly chart, possibly targeting the 3250 area.
XAUUSD H1 ANALYSISGold price sticks to modest intraday gains around the $3,360 region heading into the European session and remains close to a three-week high touched the previous day. The US Dollar eases from a multi-week top amid some repositioning trade ahead of the crucial US consumer inflation figures, which is seen as a key factor acting as a tailwind for the commodity.

XAUUSD H4 Outlook XAUUSD/GOLD
H4 Chart Analyse
Buy Direction 📈
TG ~ 3370
TG ~ 3390
TG ~ 3410
TG ~ 3440
XAUUSD 1:4 R Trade Idea - Bullish on gold - ICT1:4 RR trade idea on gold, we are at the daily FVG and aiming for the -OB on the 2hr.

Gold read but greenIt is crazy that gold right now, being in a red phase is still green in every single monthly candle.
Yes it will double.

GOLD: Target Is Up! Long!
My dear friends,
Today we will analyse GOLD together☺️
The in-trend continuation seems likely as the current long-term trend appears to be strong, and price is holding above a key level of 3,363.43 So a bullish continuation seems plausible, targeting the next high. We should enter on confirmation, and place a stop-loss beyond the recent swing level.
❤️Sending you lots of Love and Hugs❤️

XAU/USD(20250715) Today's AnalysisMarket news:
Sources said that after Trump's latest trade tax threat, the European Central Bank will discuss a more negative scenario next week than expected in June. The ECB is still expected to keep interest rates unchanged at its meeting on July 24. Discussions on rate cuts are still postponed to September.
Technical analysis:
Today's buying and selling boundaries:
3353.05
Support and resistance levels:
3386.70
3374.12
3365.96
3340.13
3331.97
3319.40
Trading strategy:
If it breaks through 3353.05, consider buying in, the first target price is 3365.96
If it breaks through 3340.13, consider selling in, the first target price is 3331.97

Trading Game of the Day 14-JULY-2025Trading Plan:-
1-BIAS
2-NARRATIVE
3-CONTEXT
4-ENTRY
5-RISK MANAGEMENT
My tools:-
OB,nested OB , FVG , iFVG ,MSS and CISD
