SHORT IDEAI previously posted a bullish play. But now after studying the charts.
I see a potential for a really big BULL squeeze.
And a very nice opportunity to swing gold!!
CFDGOLD trade ideas

Gold price summary: will continue to rise to $3,400Gold price summary: will continue to rise to $3,400
Analysis of the latest gold news (as of July 12, 2025)
1. Macroeconomics and monetary policy
The market generally pays attention to the interest rate meeting on July 29-30.
If the Fed sends a dovish signal, it may further enhance the attractiveness of gold as an anti-inflation asset.
However, the non-farm payrolls data in June showed that the labor market is still resilient, and the pressure to cut interest rates in the short term is limited.
The US dollar index continued to weaken, and the medium- and long-term depreciation trend has not changed, providing monetary support for gold.
2. Geopolitical risks are heating up
The situation in the Middle East has escalated
Israel arrested a special agent team of the Iranian "Quds Force" in southern Syria, triggering escalation of regional tensions.
At the same time, the Houthi armed forces used hypersonic missiles to attack Israel, resulting in obstruction of Red Sea shipping and a 300% surge in aviation insurance costs, further boosting the demand for gold as a safe-haven asset.
The conflict between Russia and Ukraine continues to ferment
The Russian army announced that it had completely controlled the entire territory of Luhansk, and the United States suspended some military aid to Ukraine, and the situation on the battlefield was stalemate.
Geopolitical risks and global central bank gold purchases (China has increased its holdings to 73.9 million ounces for eight consecutive months) highlight the value of gold as a "crisis hedge tool."
Technical Analysis
Key resistance: $3,370
Short-term support moves up to $3,330.
Macro support: 3300 (psychological support), 3277 (trend line support), 3247 (61.8% Fibonacci retracement level).
Macro resistance: 3370 (61.8% retracement level), 3400 (psychological barrier), 3452 (previous high).
Short-term trend:
Breaking through key resistance:
Gold price breaks through the upper track of the triangle pattern ($3327) and the $3350 resistance level (50% Fibonacci retracement level), and the short-term technical side is strong.
Operation strategy
Long position:
Pull back to 3320-3330 range to go long
Stop loss at $3310
Target at $3380-3400.
Be cautious about shorting
Oscillating range strategy:
If the price stabilizes at $3350-3365, it may further hit $3400; start a new round of rise.
If it falls below $3300, it may fall to the support level of 3277-3247.

Xauusd - 4H
Gold (XAU/USD) is currently showing bullish momentum near the 3,358 level.
Price is expected to pull back slightly before forming a consolidation pattern.
A breakout toward the 3,400–3,420 resistance zone is anticipated.
This zone may act as a key decision point for further upside or rejection.
Traders should watch for bullish confirmation before entering long positions.

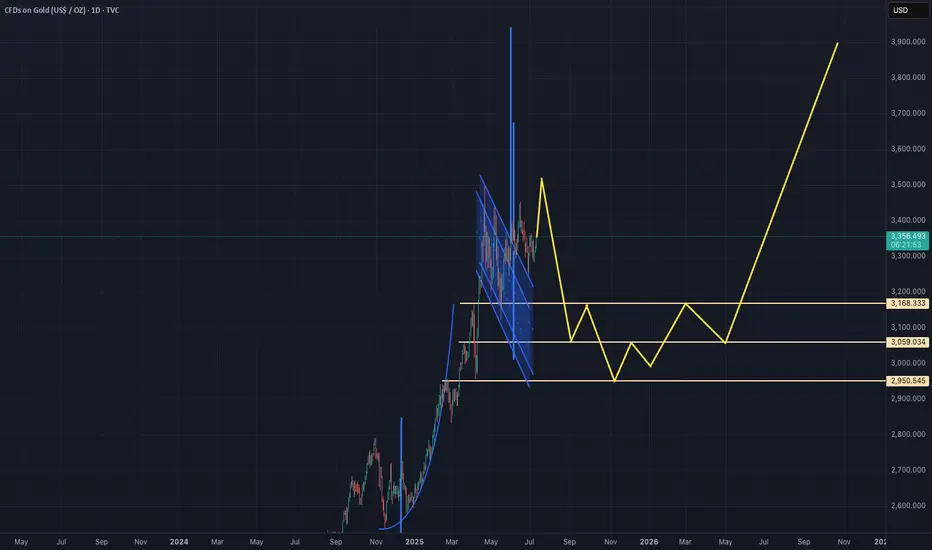
GOLD (H2 2025 - 2027)GOLD (H2 2025 - 2027)
This is the estimated path that I think gold will take for the next year and a half or so.
GOLD : Bullish Trend-Following Movement Ahead!GOLD shows several bullish signals on the 4H chart.
Initially, the price surpassed and closed above a resistance line of a bullish flag pattern.
Following that, a confirmed Change of Character (CHoCH) took place.
The price appears poised for further growth, with the next resistance level at 3380.

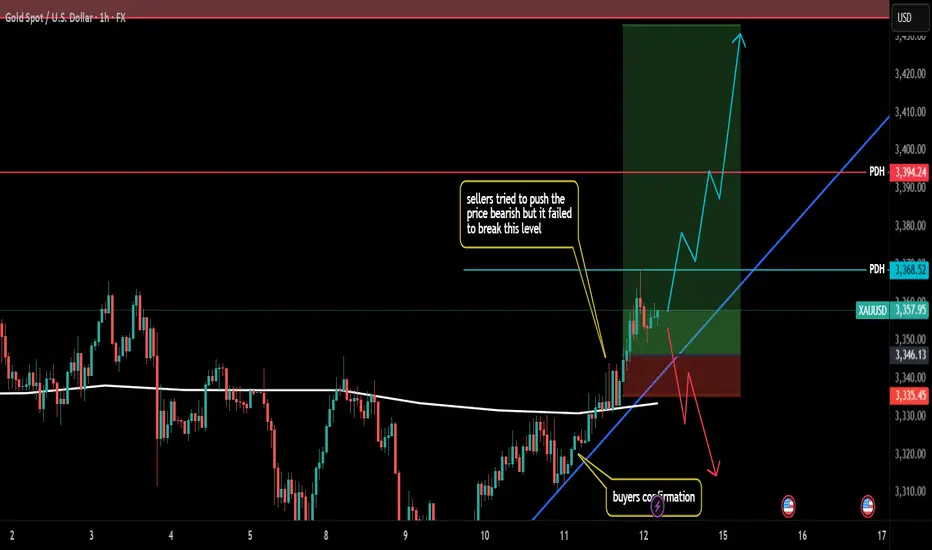
No Bullish Confirmation – Targeting 3250 on XAU/USDIn yesterday’s analysis, I mentioned that due to Monday’s daily Pin Bar, I closed my short trade on Gold around break-even and decided to wait for more confirmation.
Unfortunately, that wasn't the best decision. The price failed to break above resistance for a bullish continuation and instead dropped sharply, closing the day exactly at the 3300 figure. At the time of writing, Gold is trading even lower at 3293, after briefly rebounding from the 3285 support zone—a level I’ve highlighted in the past.
Moving forward, after the failed bullish continuation and yesterday’s bearish move, it’s clear that bears are back in control. A drop toward the 3250 zone is now on the table.
Conclusion: I’m looking to sell rallies, with my invalidation zone set above 3340, aiming for a good risk-to-reward setup.
Disclosure: I am part of TradeNation's Influencer program and receive a monthly fee for using their TradingView charts in my analyses and educational articles.

XAU/USD) bearish Trand analysis Read The captionSMC trading point update
Technical analysis of (XAU/USD) on the 3-hour timeframe, projecting further downside after rejection from a resistance zone aligned with a descending trendline.
---
Analysis Summary
Trend Bias: Bearish
Current Price: ~$3,301.96
Structure: Price is respecting a descending channel, with multiple rejections from the upper boundary and key resistance zone.
---
Key Technical Insights
1. Resistance Zone & Downtrend Line:
Price was rejected from a resistance block near the EMA 200 (~$3,331) and descending trendline.
This level has repeatedly triggered strong downside moves (highlighted with red arrows).
2. EMA 200 Reaction:
The EMA 200 at $3,331.10 is acting as dynamic resistance.
Each time price reaches or crosses above this line, selling pressure increases.
3. Bearish Price Projection:
After recent rejection, the chart anticipates a pullback to the support zone between $3,248.26 and $3,245.71.
A deeper drop toward $3,159.13 is projected as a next major target, consistent with previous price moves.
4. RSI Indicator:
RSI at 40.24 suggests bearish momentum is still in play but not yet oversold—indicating room for more downside.
---
Bearish Trade Idea
Element Level / Description
Entry Zone Below resistance: $3,310–$3,320
Target 1 $3,248.26–$3,245.71 (support zone)
Target 2 $3,159.13 (channel base / next support)
Stop-Loss Above $3,335 (above resistance zone)
---
Risk Considerations
Fundamental catalysts: Gold is sensitive to USD strength, interest rate decisions, and macroeconomic data.
Invalidation: A strong breakout and close above the descending trendline and EMA 200 would negate the bearish outlook.
---
Summary
This analysis outlines a bearish setup for XAU/USD, supported by trendline resistance, EMA rejection, and RSI momentum. If current structure holds, a move toward the $3,245 and $3,159 levels is likely.
Please support boost 🚀 this analysis)

Update on: "XAU USD a little & nice BUY set up" 11-07-2025Quick update : I did "collect" a bit earlier (Unlucky I haven't got possibility to monitor trade all the way down today ), TP @ 3365.405.... Like I said earlier, a little & nice trade!
Also, did hit TP around - 3367.188 as promised ! AAA+ trade !
All analysis is based on technical analysis only...
Short & clear without any "BS"...
I do not believe in fundamental analysis (& if you are desperate for it, then... gold is never going to get cheaper in a very long term & it is a good investment for the next 50-100+ years, if you are happy with "preserving" your wealth, but if you are looking get paid this or next week, then...trading is a way. )
All of you have a lovely weekend ( with a nice profit in the pocket ! )

Gold Expecting bullish Movement Price is currently showing strong momentum with visible rejections and key zone reactions. According to my analysis
First Resistance Zone: 3382.70
Second Resistance Zone: 3360.50
Support Zone: Around 3330.50
Yellow Arrow: Indicates possible early rejection and a move toward the support zone
Blue Arrow: Suggests price may bounce back from the 3330.50 support and retest upper zones
As long as price remains below the 3360.50 resistance zone, my bias remains bearish However, if price breaks above this level with strong volume, we may see bullish continuation

GOLD BEARISH BIAS RIGHT NOW| SHORT
GOLD SIGNAL
Trade Direction: short
Entry Level: 3,346.66
Target Level: 3,283.88
Stop Loss: 3,388.42
RISK PROFILE
Risk level: medium
Suggested risk: 1%
Timeframe: 9h
Disclosure: I am part of Trade Nation's Influencer program and receive a monthly fee for using their TradingView charts in my analysis.
✅LIKE AND COMMENT MY IDEAS✅

Uptrend at the end of the week 3367, maintain the upward force⭐️GOLDEN INFORMATION:
Gold prices (XAU/USD) are on track to notch a third straight day of gains on Friday, climbing toward the upper boundary of this week’s trading range as escalating trade tensions fuel safe-haven demand. In a significant intensification of global trade disputes, US President Donald Trump issued formal notices this week to multiple trading partners, detailing individual tariff rates set to take effect on August 1 should no agreements be reached. This has rattled investor sentiment and weighed on risk assets, offering solid support to Gold.
Meanwhile, expectations for an imminent interest rate cut by the Federal Reserve (Fed) have cooled following last week’s strong US jobs data. As a result, the US Dollar (USD) remains firm, holding near a more than two-week high reached on Thursday. This USD strength could limit the upside for the non-yielding yellow metal in the near term. Therefore, traders may look for a sustained breakout before committing to further bullish positions in the XAU/USD pair.
⭐️Personal comments NOVA:
Gold price breaks 3330, maintaining good buying pressure, recovering at the end of the week
⭐️SET UP GOLD PRICE:
🔥SELL GOLD zone: 3367- 3369 SL 3374
TP1: $3355
TP2: $3342
TP3: $3325
🔥BUY GOLD zone: $3306-$3308 SL $3301
TP1: $3315
TP2: $3325
TP3: $3338
⭐️Technical analysis:
Based on technical indicators EMA 34, EMA89 and support resistance areas to set up a reasonable BUY order.
⭐️NOTE:
Note: Nova wishes traders to manage their capital well
- take the number of lots that match your capital
- Takeprofit equal to 4-6% of capital account
- Stoplose equal to 2-3% of capital account
XAUUSD SHORT
📉 CHoCH Spotted (LTF) – Market just flipped bearish!
🔥 Sellers in control after breaking structure.
🎯 TP: Demand Zone below
🛑 SL: Just above the supply zone

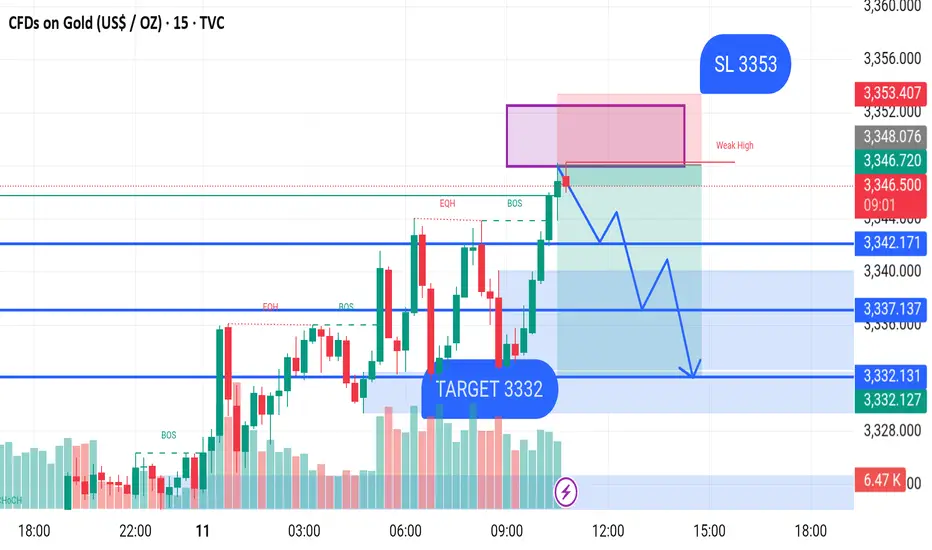
GOLD SELL M15 Gold (XAU/USD) 15-Min Chart Analysis – July 11, 2025
Price is currently trading around 3346.94, after showing a Break of Structure (BOS) to the upside, reaching into a supply zone (highlighted in red). This area also marks a "Weak High", indicating potential for a bearish reversal.
Key Observations:
Supply Zone: Between approximately 3346 – 3353
Stop Loss (SL): Set at 3353
Entry: Anticipated from the top of the supply zone after rejection
Expected Move: Price is projected to drop after rejecting from the supply zone and form lower highs and lower lows.
Target Levels (Bearish Scenario):
1. First Support: 3342.17
2. Second Support: 3337.13
3. Main Target: 3332.13 (highlighted as "TARGET 3332")
This analysis anticipates a bearish move from the current level, based on price action and structure.
Gold delivering excellent Scalp opportunitiesGold has tested #3,330.80 Resistance and got rejected many times as I firstly Bought Gold from #3,322.80 towards #3,330.80 Resistance zone in extension. Later on, I have added Selling order on #3,327.80 to the downside and closed it on #3,320.80. I have engaged Buying order on #3,318.80 Support once again and added more Buying orders on #3,321.80 / closed all before #3,327.80 and ultimately Sold again on #3,327.80 towards #3,318.80. Excellent Scalping opportunities throughout yesterday's session.
Technical analysis: Since the #3,318.80 breakout point was not compromised, the Price-action Naturally spiked to the #3,327.80 - #3,330.80 Resistance zone mentioned on the previous commentary. Based on the #5-session Higher High’s sequence, this zone is the new local High’s (very possible that Price-action is pricing a Top here, temporary or not) and as both the Hourly 4 chart and Daily chart are Neutral to a very great extent and does not look so good for Buyers (Gold is already critically Overbought within #3,340's, I should Naturally expect a correction within #1 - #3 session horizon. The Technical answer is the Hourly 1 chart’s Support near #3,327.80, which has been always touched after every Higher High’s rejection and holding as flood gate towards #3,322.80 and #3,318.80 wall of Support zones. Gold is kept Higher on pure Fundamental gradient and weak DX (on a parabolic downtrend) but this state has to end sooner or later and Gold should continue it’s Bearish trend and connect with the fair Technical Price around #3,300.80 mark or less. The turmoil with the Inflation in U.S. causing Investors turn to capital from riskier assets for protection (safe-havens in High demand such as Gold), thus causing Gold to gain value. Regardless, DX is the strongest correlation driving Gold at the moment. Fundamentally though Gold is Bullish and cannot overcome such patterns as it is overreacting to every DX and Bond Yields movements.
My position: I am currently Buying #3,332.80 Bottom (third Scalp this morning all closed on #3,335.80) and holding last one until #3,340.80 ideally and with that regardless what happens on U.S. opening, I will call it for the session and comfortably take early weekend break since I am Highly satisfied with my returns. Enjoy the Profits and have a great weekend!

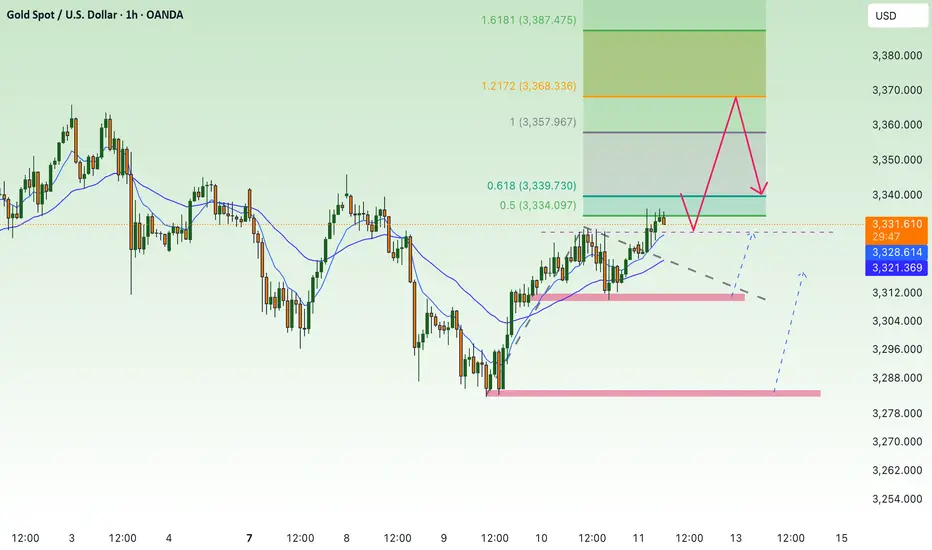
XAUUSD H4 | Premium Supply RejectionPrice has tapped into a premium selling zone around 3,340 - 3,350 and is showing signs of rejection.
📍 Key Levels:
• Premium Supply Zone: 3,340 – 3,350
• Current Price: 3,332
• Target Zone: 3,275 – 3,265
• Intermediate Support Zones: Around 3,320 & 3,300
🔴 Liquidity was swept above the previous high, and price has reacted strongly from this level.
🔻 Bearish Bias:
• Expecting a move down towards target support.
• Clean break of structure confirms bearish intent.
• Multiple FVGs and imbalance zones below price support the downside continuation.
📌 Trade Idea:
Sell from premium zone with confirmation
🎯 Target: 3,275 zone
📉 SL suggestion: Above 3,355 (structure invalidation)

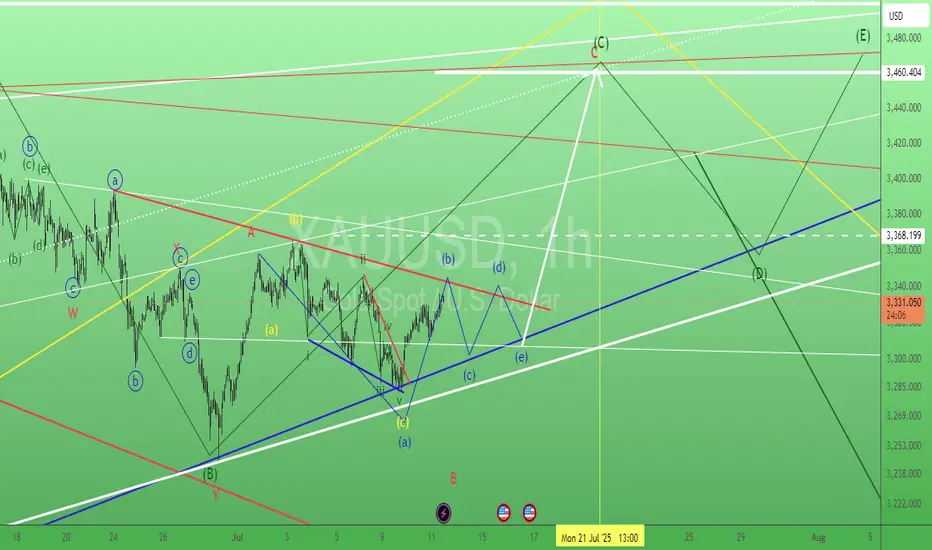
Gold. Swing trade setup 11/July/25XAUUSD. Based on latest 'speed' of chart "touching" those trendlines, gold probably having a triangle base now..before moving toward 3460 +/-...
Gold has a big win this dayNews: In the early Asian session on Thursday (July 10), spot gold fluctuated slightly higher, once regaining the 3320 mark, and is currently trading around $3323/ounce. On Wednesday, gold prices rebounded strongly after hitting a two-week low of 3282.61, closing at $3313.38/ounce, showing strong momentum for recovery. Trump extended the tariff agreement to August 1 and began to collect tariffs again. Although it eased market tensions, his remarks will not be extended after the expiration, and he issued tariff threats, which increased global trade uncertainty and pushed up risk aversion. The market is still facing economic and inflation concerns brought about by tariffs, which will also weaken the dollar and support gold prices.
Analysis of gold trend: After the full-day trend of gold on Wednesday, the lowest price was 3282 and the highest price was 3322, with a range of $40, so the bullish strength has come out. However, Li Siyu would like to emphasize here that gold is in a bullish trend for the time being, but it is not an absolute unilateral trend, but a fluctuating trend under the bullish trend. There are opportunities both up and down on Thursday. If it rises, you can look at 3345, and if it falls, you can look at 3285. Therefore, before there is an absolute strong unilateral rise, it is recommended that everyone keep looking at this wave of gold fluctuations. However, today's market is more important. Today is Thursday, and Thursday is often the node of the weekly change time. Today is likely to continue the rebound on Wednesday and continue to rise.
From a technical point of view, the daily line closed positive under the rebound of 3282 and stood firmly above the lower Bollinger track. If it continues to close positive on Thursday, it is necessary to pay attention to the suppression of the middle Bollinger track, that is, the high point of 3345. After breaking through, there will be another wave of rise on Friday, and you can see 3365 and 3400. Therefore, today's gains and losses of 3345 are crucial. The strong rebound in the H4 cycle is quite obvious. When it falls, it is very weak and continuous. When it rises, it is very strong and continuous. It depends on whether the continuous positive trend on Thursday will continue. Now the K-line stands firmly on the middle track of Bollinger. If it continues to rise, the high point of the upper track is around 3340-3345. In principle, the continuation of the long position will test the high point of the upper track. Therefore, it is still possible to go long today. Of course, it is not an absolute long trend now, so don't chase the rise. The support below the small cycle is around 3310-3300. If it falls back to this price, you can continue to go long. Clearly define the target. Today, we will see the gains and losses of 3345.

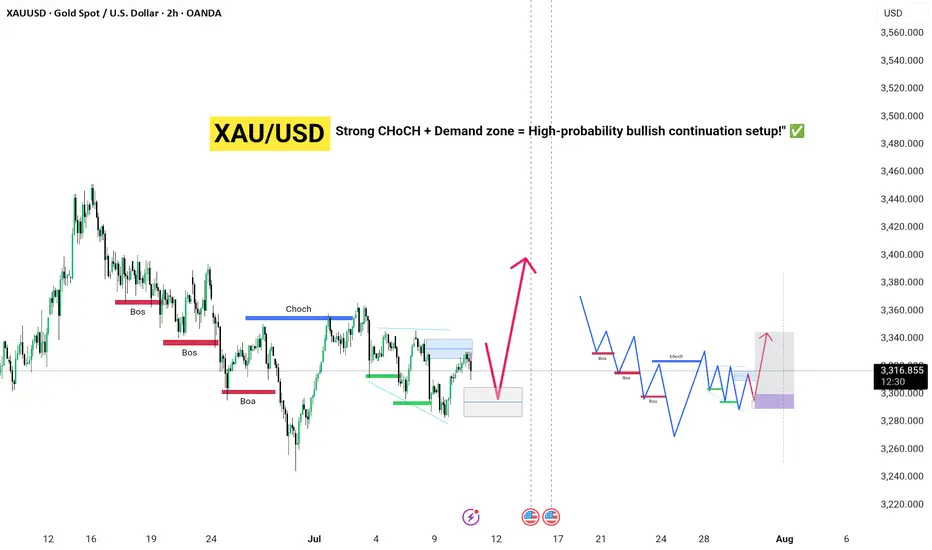
Bullish move , gold money Strong CHoCH + Demand zone = High-probability bullish continuation setup!" ✅
Key Highlights:
🔴 Multiple BOS confirm bearish trend continuation up to late June.
🔵 CHoCH on early July marks a potential bullish reversal zone.
📉 Price currently retracing into a demand zone (highlighted blue box) for potential long entries.
🔮 Expected bullish leg targeting the 3,350–3,400 zone before another possible correction.
🧠 Projected schematic aligns with Wyckoff accumulation + SMC concepts—anticipating further BOS and CHoCH as price unfolds.
📅 Watch for upcoming U.S. economic events that may influence volatility (shown with news icons).
📌 Bias: Bullish above demand zone | Invalidation: Clean break below demand and failure to hold above recent BOS.
XAUUSD Breakout Done , Long Entry Valid Now To Get 150 Pips !Here is my opinion on Gold On 15 Mins , we have a very good closure with breakout candle and now the price retest the broken res and new support and we can enter a buy trade as a scalping , if we have a 4H Closure Below 3326.00 this idea will be not valid anymore.

Gold Eyes 3365 as Tariff Tensions Support Bullish MomentumGOLD OVERVIEW
Gold extended gains to around $3,329 amid a weaker dollar and ongoing tariff tensions, with markets reacting to new U.S. trade actions and divided Fed minutes on rate cuts.
Technical Outlook:
Gold remains bullish while above 3320.
A 1H close above 3342 opens the door to 3365.
A 1H close below 3314 will turn sentiment bearish toward 3297 and potentially 3282.
Resistance: 3330, 3342, 3365
Support: 3309, 3297, 3282

Gold on the Move – Major Resistance Levels to Watch AheadThe current price action looks strong, and if the bullish momentum continues, we have three main target levels in mind.
The first target is $3,380. This is an important level we expect gold to reach soon if the trend continues upward.
If the price breaks above $3,380, the next target is $3,433. This level is likely to act as a strong resistance, meaning the price might slow down or pull back here. But if gold can push through it with strength, that’s a strong signal of continued upside.
After that, the third target is $3,495, which would mark a strong extension of the current bullish trend.
As long as gold stays above key support levels, we believe the bullish outlook remains valid, and these targets are possible in the coming days or weeks.

Weekly Analysis on GOLDCurrently in a buy trade position. Im looking for possible bullish continuation next week so i can add my position.
Am I looking for longs on XAUUSD?Hello traders , here is the full multi time frame analysis for this pair, let me know in the comment section below if you have any questions , the entry will be taken only if all rules of the strategies will be satisfied. wait for more price action to develop before taking any position. I suggest you keep this pair on your watchlist and see if the rules of your strategy are satisfied.
🧠💡 Share your unique analysis, thoughts, and ideas in the comments section below. I'm excited to hear your perspective on this pair .
💭🔍 Don't hesitate to comment if you have any questions or queries regarding this analysis.
