Lingrid | GOLD Major Support Level ViolatedOANDA:XAUUSD has formed a lower high beneath the key resistance at 3,310, showing fading bullish momentum after a breakout failure. Price is trading below the upward trendline and moving toward the 3,260 support zone with a corrective structure. The rejection from the resistance block and breakdown of a key level suggests continued bearish pressure.
📉 Key Levels
Sell trigger: rejection from 3,300–3,330 resistance block
Target: 3,260 key support, followed by 3,240 lower zone
Invalid level: breakout and close above 3,320 regains bullish bias
Resistance zone: 3,310–3,330 acting as a ceiling for upside attempts
⚠️ Risks
Reclaiming 3,310 would shift the bias back to neutral/bullish
Sideways range between 3,260–3,320 could cause fakeouts
Volatility spikes from macroeconomic events may trigger stop hunts
If this idea resonates with you or you have your own opinion, traders, hit the comments. I’m excited to read your thoughts!
CFDGOLD trade ideas

GOLD → Readiness to test the local bottomFX:XAUUSD is under pressure from the rising dollar and uncertainty, breaking through support levels, which opens up a corridor for the market to fall to 3255 - 3246
The price of gold is consolidating around $3300 after falling more than 1% amid expectations of the Fed minutes and news about tariffs.
Investors remain cautious: the dollar is supported by hopes for US trade deals, while the threat of new tariffs from August 1 is holding back gold's growth.
Weak inflation data in China did not support the metal, while expectations that the Fed will not rush to cut rates due to inflationary pressure from tariffs are also limiting interest in gold. Traders are waiting for the Fed minutes and new statements from Trump to determine the further direction.
Technically, the market looks weak (on D1, the price closed below the key level of 3300 on Tuesday) and there is a chance of a further decline.
Resistance levels: 3300, 3311
Support levels: 3295, 3255, 3246
Consolidation below 3295-3300 could trigger a further decline to 3255, from which the market could react with a correction.
Buying can be considered if gold reverses the short scenario, manages to strengthen to 3311, and consolidates above this level. At the moment, the price is in the selling zone...
Best regards, R. Linda!

(XAU/USD – Gold vs US Dollar on 4H timeframe)(XAU/USD – Gold vs US Dollar on 4H timeframe), the analysis shows a bearish setup with a breakdown from the ascending trendline and confirmation below the Ichimoku cloud.
1. First Target: 3,220
2. Second Target: 3,180
3. Final Target Zone: 3,130 – 3,100
Note.
Price has rejected from the resistance zone (highlighted in yellow).
Break below support and cloud suggests bearish momentum.
The blue box (around 3,240–3,250) seems to be a possible retest zone before continuation downward.
📉 Bias: Bearish
If price stays below 3,250, these targets remain valid. Watch for retest failures or strong rejection candles to confirm entries.
Let me know if you want SL (stop-loss) or entry suggestion too.

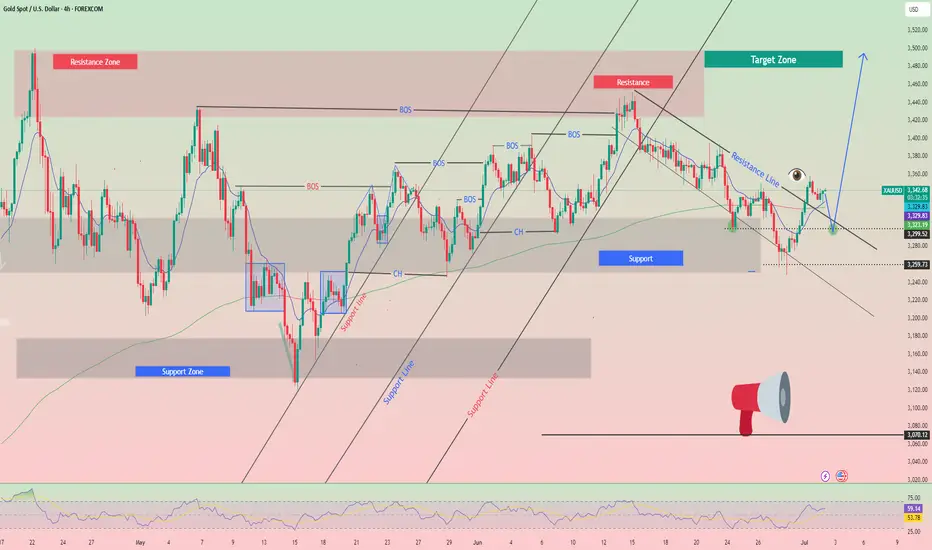
XAUUSD h4 buying target levelsGOLD (XAU/USD) - 4H Analysis
Price is currently reacting from a well-defined support zone (demand area) near $3,250–3,270, which previously acted as strong resistance and now flipped to support.
🔍 I'm watching for bullish confirmation from this zone for a potential upward move toward the next resistance levels.
🎯 Targets:
Target 1: $3,400 (First key resistance)
Target 2: $3,460 (Major resistance & previous high)
📉 If price fails to hold above the support area, this setup will be invalidated. Risk management is key.
This idea is based on structure breakout and price respecting previous resistance turned support zone.
📊 Levels:
Support (Entry Area): $3,250 – $3,270
Target 1: $3,400
Target 2: $3,460
Invalidation Below: $3,240
#GOLD #XAUUSD #PriceAction #TradingSetup #BuySetup #4HChart #ForYou #BreakoutTrade #SmartMoney #ForexAnalysis #LiquidityGrab
CAPITALCOM:GOLD

Gold on it's way back up!After finishing the descending broadening wedge break out, Gold got stopped short by the previous weekly high. It should only be knocked down to the main trendline it's been bouncing off of lately and then head back up to break that previous weekly high again.

XAU/USD : Get Ready for Another Fall ! (READ THE CAPTION)By analyzing the gold chart on the 4-hour timeframe, we can see that, as expected from our previous analysis, when the price was trading around $3327, it climbed to the supply zone at $3345. After reaching this key level, strong selling pressure emerged, leading to a sharp drop in gold today down to $3296.
This move played out exactly as anticipated, and now, if the price stabilizes below $3330, we could expect further downside pressure on gold.
The Main Analysis :

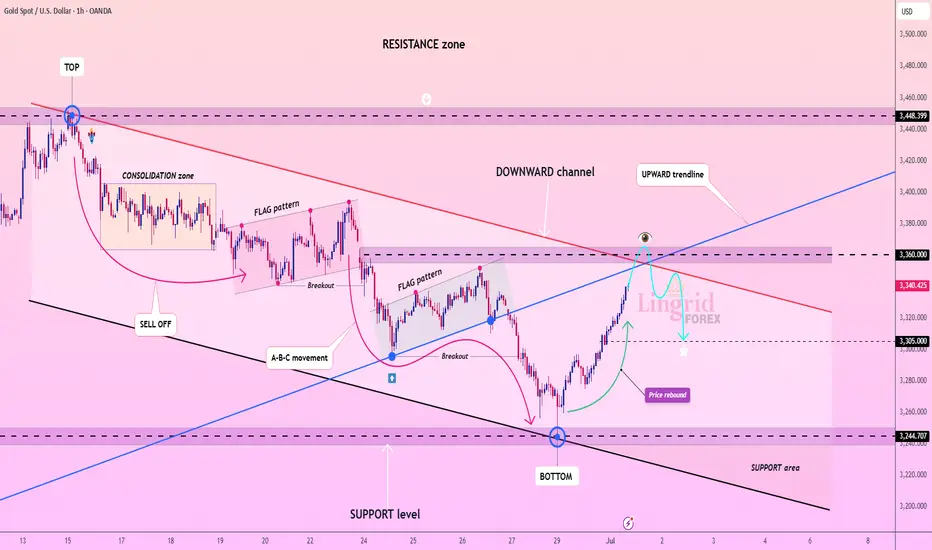
Lingrid | GOLD Shorting Opportunity at Confluence ResistanceOANDA:XAUUSD is approaching the key resistance near 3360 after rebounding from the 3245 support level and breaking out of the downward channel. Price is now testing the upward trendline from below, intersecting with the red descending trendline and horizontal resistance. If this confluence zone rejects the rally, a return toward 3305 or lower is likely, forming a potential bearish retest.
📉 Key Levels
Sell zone: 3350–3360
Buy trigger: breakout above 3360 with close above 3375
Target: 3305
Sell trigger: rejection from 3360 and break of 3340
⚠️ Risks
Break and retest of 3360 may invalidate short setup
Volatility around red trendline could trigger fakeouts
Demand near 3305 may cause sharp bounces if sellers stall
If this idea resonates with you or you have your own opinion, traders, hit the comments. I’m excited to read your thoughts!
Bullish reversal off major support?The Gold (XAU/USD) has bounced off the pivot and could rise to the 1st resistance which is an overlap resistance.
Pivot: 3,301.09
1st Support: 3,280.12
1st Resistance: 3,343.92
Risk Warning:
Trading Forex and CFDs carries a high level of risk to your capital and you should only trade with money you can afford to lose. Trading Forex and CFDs may not be suitable for all investors, so please ensure that you fully understand the risks involved and seek independent advice if necessary.
Disclaimer:
The above opinions given constitute general market commentary, and do not constitute the opinion or advice of IC Markets or any form of personal or investment advice.
Any opinions, news, research, analyses, prices, other information, or links to third-party sites contained on this website are provided on an "as-is" basis, are intended only to be informative, is not an advice nor a recommendation, nor research, or a record of our trading prices, or an offer of, or solicitation for a transaction in any financial instrument and thus should not be treated as such. The information provided does not involve any specific investment objectives, financial situation and needs of any specific person who may receive it. Please be aware, that past performance is not a reliable indicator of future performance and/or results. Past Performance or Forward-looking scenarios based upon the reasonable beliefs of the third-party provider are not a guarantee of future performance. Actual results may differ materially from those anticipated in forward-looking or past performance statements. IC Markets makes no representation or warranty and assumes no liability as to the accuracy or completeness of the information provided, nor any loss arising from any investment based on a recommendation, forecast or any information supplied by any third-party.

Bullish reversal off major support?XAU/USD has bounced off the support level which is an overlap support that lines up with the 76.4% Fibonacci projection and could rise from this level to our take profit.
Entry: 33,295.00
Why we like it:
There is an overlap support level that lines up with the 76.4% Fibonacci projection.
Stop loss: 3,278.48
Why we like it:
There is a pullback support level that aligns with the 100% Fibonacci projection.
Take profit: 3,338.86
Why we like it:
There is a pullback resistance level.
Enjoying your TradingView experience? Review us!
Please be advised that the information presented on TradingView is provided to Vantage (‘Vantage Global Limited’, ‘we’) by a third-party provider (‘Everest Fortune Group’). Please be reminded that you are solely responsible for the trading decisions on your account. There is a very high degree of risk involved in trading. Any information and/or content is intended entirely for research, educational and informational purposes only and does not constitute investment or consultation advice or investment strategy. The information is not tailored to the investment needs of any specific person and therefore does not involve a consideration of any of the investment objectives, financial situation or needs of any viewer that may receive it. Kindly also note that past performance is not a reliable indicator of future results. Actual results may differ materially from those anticipated in forward-looking or past performance statements. We assume no liability as to the accuracy or completeness of any of the information and/or content provided herein and the Company cannot be held responsible for any omission, mistake nor for any loss or damage including without limitation to any loss of profit which may arise from reliance on any information supplied by Everest Fortune Group.


GOLD - SHORT TO $2,800 (UPDATE)I would like to see the 4H candle close strongly ABOVE this current resistance zone & turn it into support, before I can confidently say it'll shoot up to $3,400 next. For all we know, price might reject this resistance again & shoot back down, but that is looking unlikely right now.
Let's see how the weekly candle closes tonight.

The Unicorn Model: : Guide to ICT’s Best Standalone setup🦄 The ICT Unicorn: The Most Powerful Setup in ICT
Among all the concepts of ICT, the Unicorn setup stands out as the ultimate precision entry model, it’s confluence perfected. Why? Because it merges two of the most potent ideas in ICT theory: Breaker Blocks and Fair Value Gaps into a single zone.
This combination creates the most high-probability, sniper-level setup in the entire ICT playbook.
Why It’s the Best you think?
Most ICT setups (like simple FVGs, order blocks, or liquidity sweeps) offer high-probability trades on their own, but the Unicorn setup stacks the odds in your favor by combining multiple layers of confirmation. This makes it the most disciplined and rewarding entry model for traders who rely on market structure.
Core Concepts Explained
A breaker block is a former order block that gets invalidated when price breaks structure, then acts as support or resistance upon a retest. It’s a sign of a shift in market intent, from bullish to bearish or vice versa.
A fair value gap (FVG) is a three-candle pattern where a sudden price move creates an imbalance, a "gap" between the wicks of the first and third candle. Price often retraces into that gap before continuing its trend.
When these two concepts overlap, a breaker block and a fair value gap in the same zone, it forms the “unicorn” setup. It suggests a strong level where liquidity has been taken and institutions may re-enter.
How the Setup Work s
First, you identify a market structure shift, like a break in a previous high or low. Then look for the breaker block left behind by that move. Within that block, check if there’s a fair value gap (the imbalance zone). When price retraces back into that confluence zone, wait for a reaction, often a strong reversal or continuation.
Entry is usually taken when price shows rejection within the zone on a lower timeframe. Your stop-loss goes just beyond the breaker block, and your target can be the next high/low or a logical liquidity pool.
Example of a bearish Unicorn Model:
Best Conditions to Use It
This setup works best when used in line with the higher timeframe trend. Many traders analyze structure on the 1-hour or 4-hour chart, then drop to 5-minute or 15-minute charts to enter. It’s commonly used in forex and indices but also works well in crypto or commodities.
Avoid using it during news events though. Like all ICT concepts, it requires patience and practice to identify clean setups and avoid forcing trades.
Example spotted on a Gold setup:
ICT Unicorn Model was first introduced in 2022, primarily applied to the Nasdaq 100 (NQ) and S&P 500 (ES). What stood out immediately was its precision, the kind of clean structure and consistency you don’t often find in most strategies.
As it was tested further, it was clear this wasn’t just for indices. The model transitioned beautifully into forex, especially on major pairs like GBP/USD and EUR/USD, delivering sharp entries as well.
I also tested it on metals like gold (XAU/USD) and silver (XAG/USD), as well as the Dollar Index (DXY), and the results spoke for themselves. Even in crypto, where volatility is the norm, the Unicorn setup held its ground.
It’s rare to find a trading model that adapts across markets this well.
Final Thoughts
The ICT Unicorn is all about confluence and precision. You’re not trading every breaker or every FVG, only the ones that align, especially with a clean shift in structure. When used with proper risk management, it can be a high-probability setup in your playbook.

Trading Signal for (XAU/USD) sell below $3,359 (21 SMA-7/8 MurraEarly in the European session, gold is trading around 3,341, below the 7/8 Murray and above the 21 SMA and the 200 EMA, with a bullish bias.
We can see that gold reached the 7/8 Murray level on the H4 chart. This has become strong resistance, so we believe a technical correction could occur below this level in the coming hours.
On Monday, we observed gold reaching a low of 3,238, where it found a technical rebound,, as this coincided with the bottom of the downtrend channel.
Gold has a bullish bias, having reached oversold levels since June 26. It is likely that after a technical correction, it could resume its bullish cycle and reach the 8/8 Murray level at 3,437.
If gold falls below 3,359 in the coming hours, we could expect it to reach the 200 EMA around 3,321. This area will be seen as an opportunity to resume buying, as a bullish trend is emerging.
The RSI indicator is showing a positive signal, so we could take advantage of a technical rebound around 3,320 or 3,305. Both levels could provide gold with good support and a buying opportunity.
Is Gold Ready for a Breakout or Pullback? | Weekly ForecastIn this video, we dive deep into the gold market analysis for the week of July 7 to July 11, 2025. I break down everything you need to know from last week’s price action — including the surge to $3,360, the impact of the U.S. tax cut and spending bill, and the 2.2% weekly gain despite consolidation.
We also look ahead at what to expect this week, including:
📅 July 9 Trade Tariff Deadline
📉 Key U.S. labor data (Initial Jobless Claims)
🏦 Market sentiment around Fed rate cut speculation
📊 Strategic insights based on technical and macro confluence
👉 If you find this content valuable, don’t forget to Vote, Comment, and Subscribe for weekly market breakdowns.
💬 Drop your thoughts in the comments:
Do you think gold will break above $3,360 this week? Or are we gearing up for a deeper pullback?
Disclaimer:
Based on experience and what I see on the charts, this is my take. It’s not financial advice—always do your research and consult a licensed advisor before trading.

July 8, 2025 - XAUUSD GOLD Analysis and Potential OpportunityAnalysis:
Bullish momentum remains strong. Watch the 3350 level as key resistance.
No clear directional bias yet, so Asia session strategy will focus on buying pullbacks near support.
🔍 Key Levels to Watch:
• 3375 – Resistance
• 3365 – Resistance
• 3350 – Resistance
• 3345 – Intraday key resistance
• 3330–3333 – Intraday key support zone
• 3322 – Short-term support
• 3315 – Support
• 3306 – Support
• 3300 – Psychological level
• 3295 – Key support
• 3275 – Support
📈 Intraday Strategy:
• SELL if price breaks below 3330 → watch 3326, then 3322, 3315, 3306
• BUY if price holds above 3346 → watch 3350, then 3355, 3360, 3365
👉 If you want to know how I time entries and set stop-losses, hit the like button so I know there’s interest — I may publish a detailed post by the weekend if support continues!
Disclaimer: This is my personal opinion, not financial advice. Always trade with caution and manage your risk.

The idea remains unchanged, NY3360-3365 is emptyThe idea remains unchanged during the NY period. Although gold has currently reached a high of around 3348, it has not stabilized above it. If gold successfully breaks through 3350 in the short term, it may reach 3360 or 3365. In the 4H cycle, it presents a step-by-step upward pattern. The K-line is temporarily fluctuating sideways near the upper track. At the same time, 3345 has formed a double top pattern. Combined with Thursday's low of 3310, an inverted triangle oscillation range of 3345-3310 is formed in the short term. This week's trend needs to pay close attention to the breakthrough direction of this range. Short-term long positions can be taken after the trend is confirmed.
XAUUSD@3330-3320 long TP 3345-3365
OANDA:XAUUSD

Gold rebound is powerless and waiting for catalyst! European sup
In the Asian session on Wednesday, spot gold suddenly fell rapidly in the short term, falling to the lowest level of 3284. At present, gold is firmly bearish in the near term, and the price of gold may fall to $3247/ounce. The Federal Open Market Committee (FOMC) is scheduled to release the minutes of the June monetary policy meeting on Wednesday. This document may reiterate what speculative interest already knows, that is, Fed officials are satisfied with their recent wait-and-see stance.
The Federal Open Market Committee (FOMC) will release the minutes of the June monetary policy meeting. The minutes of the Fed's June 17-18 meeting to be released will send a more dovish signal than expected, and the "wait-and-see period" for rate cuts may end in late summer.
Views on today's gold trend!
Looking back at the market, it fell first and then rose on Monday, and then retreated directly on Tuesday. The market turned so sharply, and after gold broke below 3300 again yesterday, the market tended to be weak. At present, the upward trend of gold is still in effect, but buyers seem to be losing momentum. It is worth noting that the relative strength index (RSI) triggered a "sell signal" as the index fell below 50, indicating that sellers outnumbered buyers.
From the perspective of price action, gold prices need to fall below the June 30 low of $3,246/oz to pave the way for further declines. From the 4-hour trend chart and the daily trend, the key node of opening pressure is around 3,321. This position is the low point of yesterday's sideways trading, and it is also the key suppression level of the trend line and the moving average. If you want to weaken again today, this position cannot stand firm, and the support below will first look at the double support of 3,376 and 3,247!
Gold: Short near 3,321, defend 3,331, and target 3,296-3,285! Enter long orders if it falls back to around 3,276 without breaking, defend 70, and target 3,310! If it continues to break, wait for the 3,347 first-line support to take more!

GOLD .. Alternative scenarios, long now??#GOLD.. market perfectly brokenhis today resistance that was at 3296-97
So now if market rholds above and sustains then bounce expected towards 3340 again..
Good luck
Trade wisely
Bearish Gold is consolidating in narrow zoneBearish Gold is consolidating in narrow zone. At present is facing resistance from whee it may fall.

Following Price Flow to the Next TargetPrice swept liquidity below the previous day’s low and then powered back up, breaking structure to the upside. Now it’s sitting above the 50 EMA, moving through fair value gaps left by the rally. I’m watching for a possible pullback into the FVG zone near the EMA. If that level holds, price could look to reach for the liquidity above around 3,365.
But here’s what matters most. Even if this ends up being a losing trade, I’d rather take that loss knowing I stuck to my plan than catch a random win by breaking my rules. Because long-term, winning trades that come from impulse actually set you up for future damage. They teach bad habits.
Losses that happen inside your system? Those are simply the cost of doing business. They protect your discipline and keep your edge intact. Over time, that’s exactly what allows you to stay in the game and grow your account.

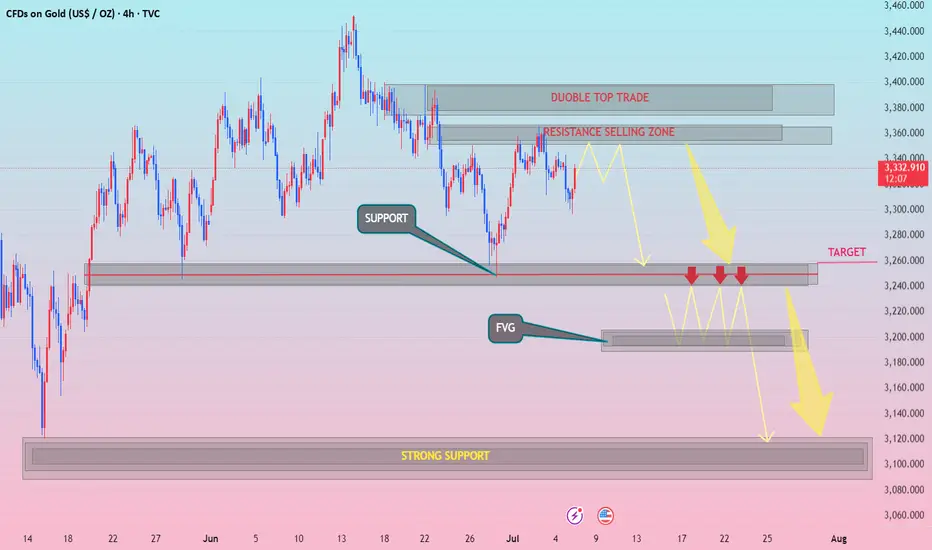
XAUUSD h4 down pattranDouble Top Yes Break above neckline = Bullish invalidation
Resistance Selling Zone Yes May flip to support
Target Zone (3,260) Yes Over-tested support may trigger reversal instead
FVG (~3,200) Yes May not fill if bullish momentum sustains
Strong Support (~3,100) Yes Price might not drop that far before buyers
WITH ZARA..FVG
XAUUSD Sniper Outlook – July 7, 2025"Structure over noise. Patience is power. Welcome back to the battlefield."
👋 Hey traders!
After a low-volume week due to the US Independence Day holiday, we now re-enter the battlefield with structure tightening under major resistance — and with Fed commentary on the radar.
No CPI. No NFP. But don't sleep on the setups — liquidity is quietly shifting.
🧭 Here’s what we’ve got ahead:
🔔 Key Events – July 8–12:
🟡 Monday–Tuesday: BRICS Summit (geo/political exposure)
🔵 Wednesday: FOMC Minutes – potential policy clues
🔴 Thursday: Unemployment Claims + Fed speakers (Muserlian, Waller)
⚪ Friday: Federal Budget Balance
We’re likely entering a reactive environment — fueled by internal structure shifts, not major macro catalysts. Perfect for smart money setups.
🧠 HTF Structure & Bias
🔹 Daily Bias:
Price remains capped under the key daily supply 3344–3351, which rejected cleanly before the holiday. Unless that flips into support, bias remains neutral to bearish.
EMAs 5/21 are curling sideways. RSI is flattening, and structure shows fading momentum.
🔹 H4 Bias:
We’re consolidating below a CHoCH + LH series, inside premium territory. The rejection from 3344 was precise, and unless broken, pressure favors the downside.
Price is rotating between the H4 EQ and the 3325–3332 intraday OB. Momentum is slowing — watch for re-accumulation or rejection depending on reaction at key zones.
🔴 Supply Zones (Sell Scenarios)
1. 3344 – 3351
This is the Daily + H4 supply from last week. EMA alignment + FVG + liquidity sweep confluence.
Perfect sniper rejection area if price trades up and stalls. Look for M15/M30 CHoCH confirmations.
2. 3380 – 3394
Untouched H1-H4 OB in premium. Not related to CPI/NFP — just pure inducement wick potential from above. If tapped after midweek liquidity push (e.g. FOMC Minutes), watch for overreaction entries.
🟢 Demand Zones (Buy Scenarios)
1. 3325 – 3332
Last week’s discount reaction zone. H1 OB + internal CHoCH zone. If swept and protected by bullish PA (M15 BOS), this becomes the best R/R long back into 3344.
Already tested Friday, but still holds weight for Monday.
2. 3286 – 3272
H4 OB + daily demand + RSI oversold zone.
If we get a full breakdown early week, expect this area to act as a reaccumulation pocket for bulls — but only with confirmation.
⚔️ Decision Zone – 3299 – 3305
This is the weekly flip area.
If bulls defend 3305 → bullish short-term bias returns.
If 3299 fails → downside continues into 3280s.
🧠 Summary & Gameplan
🧷 No CPI. No NFP. That means cleaner technical moves — no fake news spikes, just pure structure.
Expect Monday to be reactionary (post-holiday), and Wednesday–Thursday to bring intraday setups post-FOMC minutes.
✅ If price is in premium, watch for bearish rejections at 3344/3380.
✅ If price dips into discount, wait for confirmation longs at 3325 or 3286.
✅ Stay patient in mid-range. Don’t force trades inside chop zones.
🧲 If this gave you real clarity — don’t just scroll on.
Hit the ❤️ button, smash Follow, and tell us in the comments:
👉 Which zone do you trust more — the 3325 reentry or the 3380 inducement trap?
Let the gold tribe know 👇
—
📢 Disclosure:
This analysis is based on the Trade Nation TradingView feed. I’m part of their Influencer Program and receive a monthly fee.
⚠️ Educational content only — not financial advice.
— GoldFxMinds 💛
Patience | Discipline | Fearless Execution

Long on monday morning 3363 then short on Monday Gold still in range bound except both option 1st long on monday 3363 then sell from. this area to 3277 zone then continue till liquidation 3233
