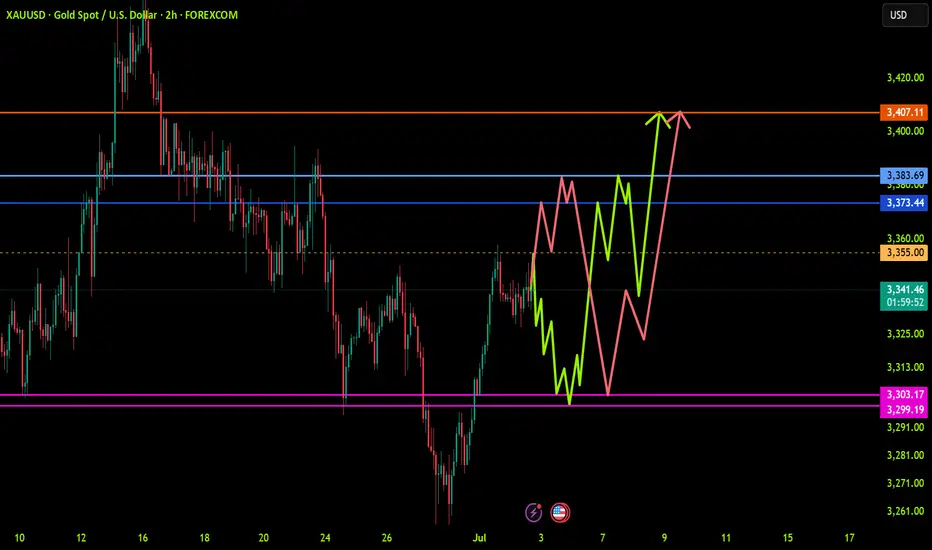
XAUUSD: Trend in 2H timeframevery important levels for GOLD, we have two trends,
Please pay special attention to the colored levels.
Trends are very accurate,
>>>>>>>>>>>>>>>>>>> The setup is very sensitive <<<<<<<<<<<<<<<<<<<<<<<<
Be careful
BEST
MT
CFDGOLD trade ideas
XAUUSD: Market analysis and strategy on July 2Gold technical analysis
Daily chart resistance 3400, support 3250
4-hour chart resistance 3355, support 3300
1-hour chart resistance 3345, support 3325
After gold adjusted to 3247, bulls launched a counterattack. This position is the 0.618 support from 3121 to 3451. It rose by $100 in two trading days. Bulls are still strong. Although the war is sometimes tense and sometimes relieved, the global geopolitical environment and economic environment are continuously getting worse step by step. This support logic has never changed. Even if it is temporarily relieved, gold will usher in a correction, but it is only a correction. Overall, the fundamental logic of the bull market has not changed.
Gold price reached 3358 and then fell back. Today, it fell below 3336 and continued to fall. The support point below is around 3325/3310. It continues to rise after the fall. It is necessary to pay attention to the specific point where it will stop falling and stabilize during the trading session. As far as the current market is concerned, it hit 3328 today to stop falling and rebound, and temporarily held the support position of 3325. It is bullish based on this position. There are ADP data today and NFP data tomorrow. Pay attention to the impact after the data is released.
BUY:3330near
BUY:3300near

Report - 2 jully, 2025US Fiscal Policy & Political Outlook:
Donald Trump’s sweeping tax and spending bill — dubbed the “big, beautiful bill” — took a major step forward with its razor-thin Senate passage (51-50), thanks to Vice President JD Vance’s tie-breaking vote. The bill extends Trump’s first-term tax cuts, slashes healthcare and social welfare spending, and increases military and border security budgets. It also proposes eliminating taxes on tips and overtime, aiming to galvanize Trump’s core voter base.
While the bill now moves to the House, it faces strong opposition even among Republicans. Fiscal hawks are deeply concerned about the bill’s projected $3.3 trillion addition to the deficit over the next decade (according to the Congressional Budget Office). Moderates object to Medicaid cuts, which threaten care for low-income Americans. The House vote will be crucial; if it passes before July 4 as Trump desires, it will mark a major policy victory — but at significant fiscal cost.
From a market perspective, this bill’s passage heightens concerns over US debt sustainability, already a major factor in the dollar’s ongoing weakness. Bond investors are bracing for increased Treasury issuance, adding upward pressure to yields despite recent dovish signals from the Fed.
Global Trade Dynamics & Tariff Strategy:
Simultaneously, the White House is pursuing narrower, phased trade deals as Trump’s July 9 tariff deadline looms. While originally promising 90 trade agreements in 90 days, officials are now prioritizing small, targeted “agreements in principle” to avoid immediate trade shocks.
Countries agreeing to narrower deals will escape the harshest “reciprocal” tariffs, maintaining a baseline 10% levy while negotiations continue. This two-track approach reflects both Trump's negotiating style and the complexity of global supply chains.
Meanwhile, the EU is hardening its stance, demanding immediate tariff reductions and threatening retaliatory measures on €95 billion of US goods if talks fail. Japan, on the other hand, has stood firm on protecting its rice farmers, refusing to sacrifice domestic agricultural interests for tariff relief.
These developments underscore the fragility of global trade flows. Investors should monitor sectors sensitive to tariffs (automotive, electronics, agricultural exports), as policy swings could impact earnings forecasts and supply chain costs.
Monetary Policy & Central Bank Positioning:
On monetary policy, Fed Chair Jay Powell hinted that a July rate cut is “not off the table,” softening his earlier stance. This flexibility follows Trump’s intensifying pressure for lower rates. Powell emphasized that decisions would remain “data-dependent,” highlighting strong jobs data and manufacturing strength as key considerations.
Markets reacted by trimming near-term rate cut bets, with two-year Treasury yields rising. Nonetheless, longer-term expectations still price in multiple cuts by end-2026, supporting a softer dollar and equity gains in large US multinationals.
In Europe, ECB policymaker Klaas Knot expressed surprise at the limited economic fallout from aggressive rate hikes, describing the current 2% policy rate as “neutral.” This sets the stage for potential stability in eurozone rates, with the ECB maintaining a vigilant eye on energy prices and trade war risks.
Switzerland & EU Relations: Brexit Echoes:
Switzerland’s agreement to secure continued access to the EU single market illustrates the tension between sovereignty and economic integration. The new framework would require Bern to adopt EU rules dynamically and contribute €375 million annually to the EU budget — sparking strong domestic debate reminiscent of Brexit tensions.
Although offering improved market access (e.g., rejoining Horizon Europe and Erasmus), the deal weakens Switzerland’s direct democracy tradition by mandating rule adoption without a formal vote. The referendum scheduled by 2027 will be pivotal, with risks of economic isolation if rejected.
For investors, stability in Swiss-EU ties is critical for sectors such as finance, pharmaceuticals, and industrial exports. A breakdown could disrupt supply chains and reduce Swiss competitiveness.
China & Hong Kong Equity Divergence:
Hong Kong’s equity market (+20% YTD) is decisively outpacing mainland China’s flat performance. The rally is fueled by flows into tech giants like Tencent and Alibaba, while A-shares lag due to weak consumer sentiment, deflationary pressures, and property market struggles.
Mainland retail investors — who dominate A-share turnover — remain cautious amid falling home prices and tepid stimulus measures. Beijing’s conservative policy approach, possibly influenced by US trade tensions, is delaying more forceful intervention.
For global investors, Hong Kong presents near-term upside due to its tech focus and valuation attractiveness, but mainland exposure demands caution until broader economic stimulus materializes.
Bond Markets & Yield Dynamics:
Gilt markets rallied after Bank of England Governor Andrew Bailey suggested potential slowing of gilt sales (quantitative tightening), easing supply pressure. Similarly, US Treasury Secretary Scott Bessent’s comments on restraining long-term debt issuance supported a rally in US Treasuries, with 30-year yields dipping to two-month lows before rebounding.
Global long-duration bonds remain volatile, driven by fiscal policy risks (like Trump’s tax bill) and evolving central bank guidance. Investors should remain tactical, using duration exposure as a hedge but preparing for abrupt shifts in issuance strategy or inflation surprises.
Health & Science Innovation:
On the science front, a landmark Nature Genetics study highlighted stark differences in how cancer drugs damage healthy blood cells genetically. These findings could pave the way for more personalized chemotherapy, with fewer long-term side effects, especially in children.
Such innovations support the thesis of accelerating healthcare sector breakthroughs, reinforcing bullish sentiment for biotech and specialized pharma companies.
Market overview:
US equities extended gains, with the S&P 500 reaching new highs, while European stocks lagged amid trade war uncertainty. Gold rose above $3,330/oz on renewed safe-haven demand, while Brent crude held around $67/bbl after Middle East tensions eased.

GOLD - Range bound, Need to stay calm??#GOLD.. .be ready for a headache range bound move guys,
It will be very choppy so don't be panic and dont expect too much.
It will be messy.
Good luck
Trade wisely

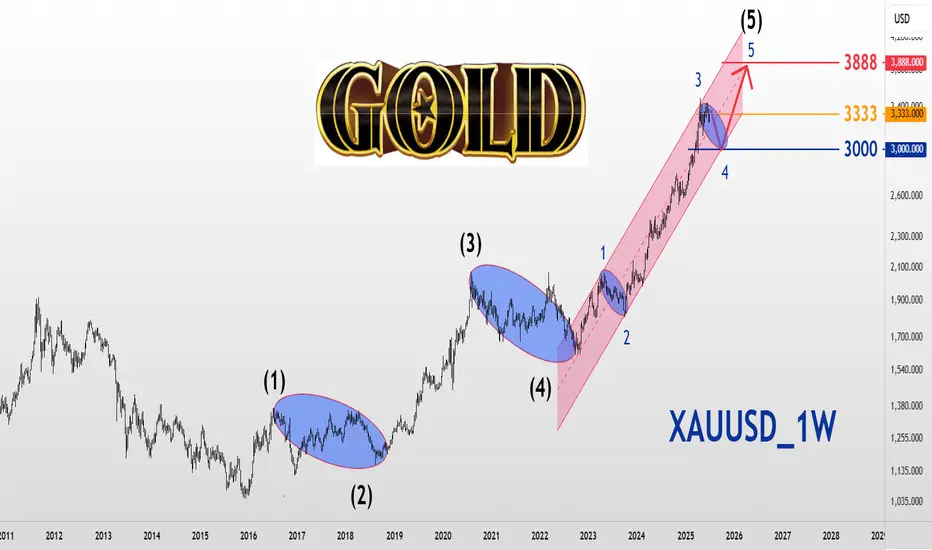
XAUUSD_1WWorld Gold Analysis
Long -term frame time
Eliot wave analysis style
The market is in five waves of climbing and we are expected to be in the 4th wave, with the main and important number being $ 3333, and if the price is maintained as a resistance, it will continue to reform and move to $ 3000, which can be modified for up to 3 months and enters the next wave on October 5, 2025. As a wave 5 and move toward $ 3888.
The original number $ 3333!
Cypher Pattern Walkthrough on GoldA look at a potential bearish cypher pattern on gold and an opportunity to trade while the market is stuck in a holding pattern.
Akil

GOLD. Why is Gold Rising Again?The yellow metal is one again receiving support driven by two main factors. The first is the continued risk of failure in the negotiations between Tehran and Tel Aviv. The second is related to the chronic weakness of the U.S. dollar amid the American economy slipping into a recession, which may persist for a prolonged period, and the uncertainty surrounding the future global impact of Donald Trump's customs tariff policy.
From a technical perspective, gold prices continue to be in a long-term upward trend. The bullish momentum, driven by the aforementioned reasons, may continue after breaking and consolidating above the 3340 level.
Technical Outlook and Trading Idea:
The price is trading above the middle line of the Bollinger Bands, as well as above the 5-and 14-period SMAs , which have crossed and are giving a buy signal. The RSI is crossing the 50% mark, also indicating a buy. the Stochastic Oscillator is above 50% and continues to rise.
In this situation, I believe gold should be bought, with a potential rise toward 3384. A likely entry point for a buy position could be considered around 3347.

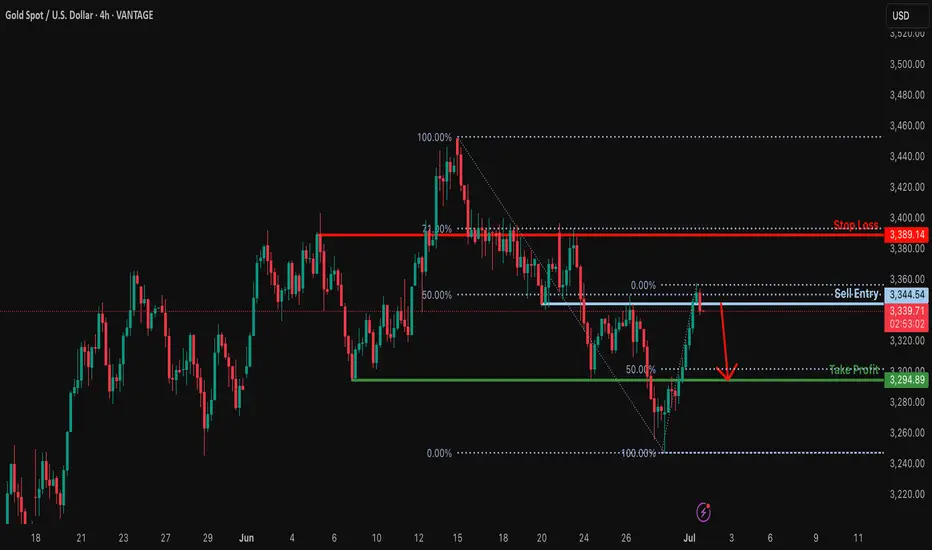
Bearish drop?XAU/USD is reacting off the resistance which is a pullback resistance that lines up with the 50% Fibonacci retracement and could drop from this level to our take profit.
Entry: 3,344.54
Why we like it:
There is a pullback resistance that lines up with the 50% Fibonacci retracement.
Stop loss: 3,389.14
Why we like it:
There is a pullback resistance that lines up with the 71% Fibonacci retracement.
Take prpofit: 3,294.89
Why we like it:
There is a pullback support level that aligns with the 50% Fibonacci retracement.
Enjoying your TradingView experience? Review us!
Please be advised that the information presented on TradingView is provided to Vantage (‘Vantage Global Limited’, ‘we’) by a third-party provider (‘Everest Fortune Group’). Please be reminded that you are solely responsible for the trading decisions on your account. There is a very high degree of risk involved in trading. Any information and/or content is intended entirely for research, educational and informational purposes only and does not constitute investment or consultation advice or investment strategy. The information is not tailored to the investment needs of any specific person and therefore does not involve a consideration of any of the investment objectives, financial situation or needs of any viewer that may receive it. Kindly also note that past performance is not a reliable indicator of future results. Actual results may differ materially from those anticipated in forward-looking or past performance statements. We assume no liability as to the accuracy or completeness of any of the information and/or content provided herein and the Company cannot be held responsible for any omission, mistake nor for any loss or damage including without limitation to any loss of profit which may arise from reliance on any information supplied by Everest Fortune Group.
GOLD ROUTE MAP UPDATEHey Everyone,
A fantastic close to the week as our analysis once again played out level to level with precision!
As a follow-up from yesterday's post:
- The swing range completed the move into 3348, as expected.
- However, we had no further EMA5 lock above, confirming rejection back into the swing range.
- This was followed by an EMA5 cross and lock below 3306, opening the secondary swing range.
- That range played out perfectly today, hitting both 3288 and 3271 targets.
We’re now seeing a bounce off those levels giving the 20 to 40 pips, and we will now be observing to see if the full secondary swing is completed.
It's Friday, and it's been a PIPTASTIC week across the board. Well done to everyone following the plan and sticking to the levels.
QUICK RECAP
BULLISH TARGET
3376 - DONE
BEARISH TARGETS
3348 - DONE
EMA5 CROSS AND LOCK BELOW 3348 WILL OPEN THE SWING RANGE
3330 - DONE
3306 - DONE
EMA5 CROSS AND LOCK BELOW 3306 WILL OPEN THE SECONDARY SWING RANGE
3288 - DONE
3271 - DONE
We’ll be back now on Sunday with our multi-timeframe analysis and trading plans for the week ahead. Thanks again for all your likes, comments, and follows.
Wishing you all a fantastic weekend!!
Mr Gold
GoldViewFX

XAUUSD: Market analysis and strategy for July 1.Gold technical analysis
Daily chart resistance 3400, support 3250
4-hour chart resistance 3374, support 3300
1-hour chart resistance 3355, support 3330
4-hour chart bearish, but 1H chart has reversed bullish. Technically, gold formed a double bottom support near 3247 and has entered the B wave rebound, but beware of the C wave decline that may start at any time.
Gold price accelerated upward after breaking through the key resistance of 3300. 3300 is the 0.50 position of the previous decline. Today's market rose slowly by 50 dollars without a callback. The bullish rally will continue at least until the second half of the NY market before a callback occurs.
The risky approach is to follow the trend and buy at the current price. The safe way is to wait for the callback to around 3325~3330 before buying.
BUY: 3350
BUY: 3330

Report - 1 jully, 2025Global Macro & Currencies:
The US dollar has experienced a historic slide in 2025, falling about 10% year to date — its worst first half since 1973. This dramatic weakness has been driven by a combination of political and economic factors: mounting concerns over the fiscal path under President Trump, ballooning debt loads fueled by aggressive tax cuts, and worries about the independence of the Federal Reserve as markets increasingly price in multiple rate cuts. Additionally, erratic tariff policies and renewed trade tensions have further undermined the dollar’s role as a global safe haven.
While many expected the dollar to strengthen as the US economy outperformed and global risks rose, the opposite has occurred. Instead, European currencies have surged: the euro has climbed nearly 10% against the dollar this year, and sterling has gained almost 9%. Meanwhile, the Japanese yen has remained under pressure, but there are signs that safe-haven flows may soon stabilize it, given rising geopolitical tensions and global volatility.
From a practical investment perspective, the weaker dollar provides a strong tailwind for US multinational corporations with significant overseas revenues. It also supports commodity prices broadly, as seen in gold trading near record highs at around $3,289 per ounce. Investors should consider increasing allocations to hedged international equities or adding European equity exposure, where currency gains can further enhance returns. Moreover, actively hedging USD exposure in global portfolios becomes increasingly important to protect against continued weakness and further policy surprises.
Equities & Sector Rotation Analysis:
US equities have staged a strong comeback in Q2, with the S&P 500 rising 10% in the quarter and hitting record highs. This recovery is largely driven by expectations of lower interest rates, robust corporate earnings, and renewed enthusiasm for technology and AI-focused stocks. Companies like Nvidia continue to lead, with massive gains fueled by AI infrastructure spending and optimism around future growth.
Interestingly, this rebound has narrowed the performance gap with European markets. Earlier in the year, investors rotated into European equities on hopes of fiscal stimulus and infrastructure spending, particularly Germany’s €1tn “whatever it takes” plan. While European stocks still slightly outperform on a year-to-date basis (+7% vs. +5% for the S&P 500), the momentum has clearly shifted back to the US as growth data and earnings resilience support valuations.
Sector-wise, leadership has again become narrow, with technology, communications, and financials outperforming while defensive sectors such as utilities and real estate lag. This suggests a renewed preference for growth and cyclicals over defensive positioning, at least in the short term. Small-cap stocks continue to underperform, reflecting persistent macro uncertainties and a flight to quality.
For investors, this implies a tactical tilt toward large-cap US growth and tech names could still deliver relative strength, but caution is warranted as valuations stretch and volatility could resurface with upcoming tariff decisions and geopolitical risks. European exposure remains attractive for diversification, especially if fiscal initiatives translate into stronger earnings growth, but conviction in execution is needed.
Fixed Income & Yield Curve Dynamics:
In fixed income markets, US Treasury yields have moved lower across the curve, with the 10-year yield dropping to 4.20% after peaking above 4.8% earlier this year. This decline reflects growing market conviction that the Federal Reserve will start cutting rates in September, with futures pricing in as many as five quarter-point cuts through 2025.
The recent dovish pivot by the Fed has significantly improved risk sentiment, driving demand for longer-duration assets. We see strong gains in 20+ year Treasuries (+1.0% on the day), while intermediate and short-term Treasuries have also rallied. The overall move has flattened parts of the curve, suggesting that while markets anticipate lower rates, growth concerns remain, especially as fiscal worries and debt sustainability questions persist.
Globally, yields are following a similar downward trajectory. UK gilts and German bunds have eased, as investors bet on further easing amid weaker economic data and a more cautious ECB stance. In Europe, inflation has cooled below the 2% target, supporting expectations of one more ECB cut before year-end, even as policymakers remain wary of structural inflation risks (like AI-driven wage pressures and supply chain fragmentation).
Credit spreads in US corporate bonds have remained tight, indicating strong appetite for risk despite macro uncertainties. High-yield and investment-grade bonds have both benefited from this supportive backdrop. Meanwhile, emerging market debt has rallied, helped by the weaker dollar and lower global rates, attracting inflows into local currency debt.
For investors, extending duration looks tactically appealing as rate cuts approach, but we remain cautious about heavy exposure to the long end given potential volatility from fiscal developments and geopolitical shocks. Credit remains attractive selectively, with opportunities in high-yield and EM debt, especially for investors looking to capture carry in a lower-rate environment.
Currencies & Dollar Dynamics:
The US dollar has experienced its worst start to a year since 1973, dropping over 10% year-to-date. The dollar index, which tracks it against a basket of major currencies (including the euro, yen, and pound), has fallen sharply as global investors reassess their exposure to the greenback amid Trump’s erratic trade policy, a ballooning fiscal deficit, and concerns over Fed independence.
The immediate trigger has been the combination of rising fiscal risks from Trump's proposed tax bill — expected to add $3.2 trillion to debt over the next decade — and expectations for aggressive Fed rate cuts. The perception that US economic exceptionalism might wane has undermined dollar demand as a safe haven.
The euro has benefited the most, climbing more than 13% to over $1.17 — defying earlier forecasts of a decline to parity. Meanwhile, the pound has gained nearly 9%, supported by relative political stability and a resilient labor market. The Japanese yen has strengthened as well (+12.6% YTD), despite traditionally dovish Bank of Japan policies, with investors treating it as a safe haven amid global trade uncertainty.
In emerging markets, a weaker dollar has lifted currencies and supported local debt. Brazil’s real, Mexico’s peso, and South Korea’s won have all rallied, reflecting strong investor appetite for higher-yielding assets.
However, caution is warranted: with the dollar’s sharp decline becoming a crowded trade, some technical consolidation is likely in coming weeks. We believe the dollar’s longer-term trend remains bearish but anticipate near-term volatility as markets recalibrate positions and digest fiscal developments in the US.
Investors should continue hedging dollar exposures and consider selectively increasing allocations to EM currencies and euro-denominated assets, which stand to benefit from continued dollar softness and potential European growth stabilization.

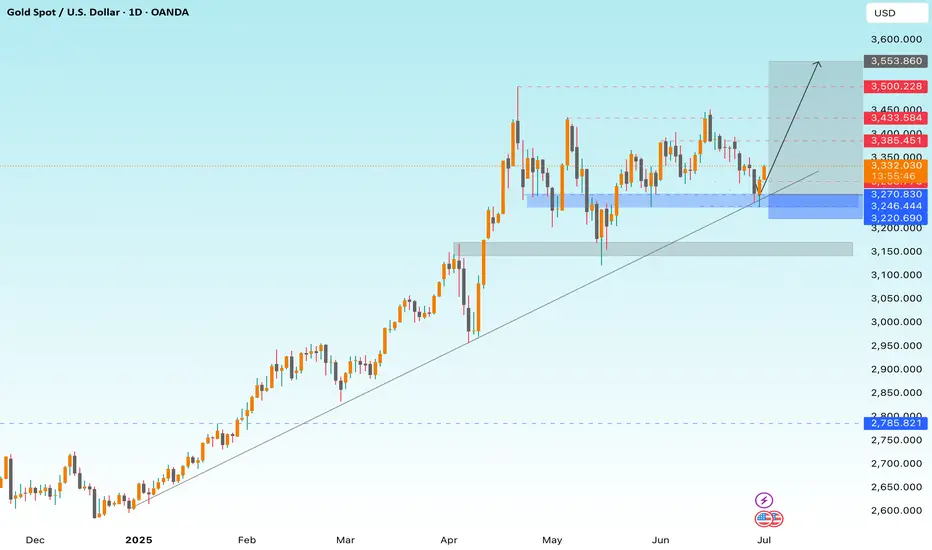
GOLD Bulls Winning ! 560 Pips and Still Aiming for +2500 Pips ! 📊 GOLD XAU/USD — Trendline Play in Action!
My plan from yesterday played out perfectly: price bounced from $3274 to $3334 — that’s +560 Pips banked so far! 💙
But this is only the start of the bigger move — I’m still targeting a 2500 Pips upside on this bullish leg.
✅ Technical Bias:
Price is respecting the main ascending trendline perfectly.
Demand zone at 3220 – 3270 held as expected.
Next resistances: 3385, 3433, 3500, then 3553 as extended target.
✅ Fundamental Bias:
The market is still pricing in more Fed rate cuts, which keeps the upside for gold alive.
📢 If you like clear setups that deliver:
Like 👍 | Comment 💬 | Share 📤 | Follow 🔔 me for real-time technical & fundamental updates!
Gold Rebounds from 3250 – But Bears Still in Control1. What happened last week
As you know, I’ve been bearish on Gold all last week long. Even though the geopolitical situation in the Middle East escalated over the weekend, the fact that price couldn’t reclaim the 3400 resistance was a major red flag.
It showed us that the bullish sentiment was fragile, and that downside pressure is just around the corner.
And indeed — Gold sold off. The weekly close below the 3300 level confirmed the weakness.
2. The key question now
Has Gold found a bottom at 3250, or is this just a temporary rebound before another leg down?
3. Why I expect a continuation lower
- The weekly close was under 3300, breaking key support
- 3250 is being tested again — a level touched multiple times since the mid-April ATH
- The current rebound looks corrective, not impulsive
- Resistance levels at 3320 and 3340 are likely to hold as ceilings
- No major catalyst yet to justify a reversal
- This looks like a classic “sell the rally” setup in a weakening trend.
4. Trading plan
The idea is simple: sell the spikes.
If price bounces into 3320–3340, I will look to short again, anticipating a renewed test of the 3250 support zone.
If 3250 breaks — we could see acceleration toward 3200 or lower.
5. Final thoughts 🚀
No need to complicate things. Gold remains vulnerable unless it clears 3340. Until then, the trend is your friend — and that trend points down.
Disclosure: I am part of TradeNation's Influencer program and receive a monthly fee for using their TradingView charts in my analyses and educational articles.

XAUUSD I Trade Update Welcome back! Let me know your thoughts in the comments!
** XAUUSD Analysis - Listen to video!
We recommend that you keep this pair on your watchlist and enter when the entry criteria of your strategy is met.
Please support this idea with a LIKE and COMMENT if you find it useful and Click "Follow" on our profile if you'd like these trade ideas delivered straight to your email in the future.
Thanks for your continued support!Welcome back! Let me know your thoughts in the comments!

Gold Bulls Back in Control as Trump Pressures Fed for Rate CutsHey Realistic Traders!
President Trump is ramping up pressure on the Fed to cut interest rates , saying the U.S. is falling behind countries with looser policies. As several Fed officials begin to shift their stance, expectations for rate cuts are growing. That’s putting pressure on the dollar and giving gold a fresh boost.
We’ll take a closer look at what this means for OANDA:XAUUSD (Gold) through technical analysis and explore its upside potential.
Technical Analysis
On the 4-hour chart, Gold has moved above the EMA-200, signaling a shift in momentum to the upside. Price has also broken out of a Descending Broadening Wedge (DBW) pattern, which often indicates the start of a bullish trend.
The breakout was confirmed by a Bullish Marubozu candle, reflecting strong buying pressure. To add further confirmation, the MACD has formed a bullish crossover, reinforcing the upward momentum.
Looking ahead, the first target is seen at 3417. If reached, a minor pullback toward the historical resistance zone (green area) may occur, with a potential continuation toward the second target at 3500.
This bullish outlook remains valid as long as the price stays above the stop-loss level at 3271 . A break below this level would invalidate the setup and shift the outlook back to neutral.
Support the channel by engaging with the content, using the rocket button, and sharing your opinions in the comments below.
Disclaimer: "Please note that this analysis is solely for educational purposes and should not be considered a recommendation to take a long or short position on XAUUSD.

GOLD Bouncing from Trendline, Breakout Ahead?GOLD BOTTOM IS HERE 🔥
Gold has taken support from the rising trendline and is now close to breaking a key resistance. The chart is showing an ascending triangle, which usually means a big move is coming.
If price breaks above the resistance, we might see a strong rally of 13% or more.
The setup looks positive as long as the support stays strong.
Looks like Gold is ready to shine again!
Retweet if you're bullish.
Like and follow for more updates!
#GOLD TVC:XAU

GOLD Price Analysis: Key Insights for Next Week Trading DecisionIn this video, I break down last week’s gold price action and give you a detailed outlook for the week ahead. With gold closing around $3,260 and major macroeconomic shifts unfolding—including the Israel-Iran ceasefire talks, rising US dollar strength, and concerns over the US Q1 GDP contraction, we are at a turning point.
📉 Will weakening economic data force the Fed to pivot?
📈 Could this create a fresh bullish wave for gold?
Or will stronger job numbers and inflation data drag gold lower?
✅ What you’ll learn in this video:
✅Key fundamental drivers affecting gold (XAU/USD)
✅Important economic events to watch (Fed Chair speech, NFP, ISM)
✅My technical analysis of gold price levels to watch
✅How to read the current market sentiment like a pro
✅Strategic trading zones for bulls and bears
🔔 Don’t forget to like the video in support of this work.
Disclaimer:
Based on experience and what I see on the charts, this is my take. It’s not financial advice—always do your research and consult a licensed advisor before trading.
#xauusd, #goldprice, #goldanalysis, #goldforecast, #goldtrading, #xauusdanalysis, #technicalanalysis, #fundamentalanalysis, #forextrading, #forexmentor, #nfpweek, #goldoutlook, #tradingstrategy, #chartanalysis, #julyforecast, #fedwatch, #priceaction, #traderinsights, #commoditytrading, #marketbreakdown, #xauusdforecast, #tradethefundamentals, #smartmoneytrading

Gold Retests Ascending TrendlineGold has pulled back to a key technical level, despite a mix of conditions that would usually support higher prices. This signals a potential shift in how investors are positioning for risk, inflation, and growth.
Gold Ignores the Playbook
You’d be forgiven for expecting gold to be higher. The past week saw softer US dollar action, rising bets on interest rate cuts, and inflation numbers that nudged uncomfortably higher. On paper, these are the sort of developments that traditionally give gold a boost. But the metal barely blinked.
The May core PCE figure, the Fed’s preferred inflation gauge, rose more than expected to 2.7%. Yet bond markets took it in their stride, with rate futures continuing to price in a strong chance of easing by September. At the same time, the US dollar lost ground, with the dollar index down over 1% on the week. That sort of move would usually feed straight through into dollar-denominated commodities like gold. This time, it didn’t.
Part of the answer lies in geopolitics. The ceasefire between Israel and Iran has cooled tensions that previously underpinned gold’s safe-haven appeal. Meanwhile, equity markets keep printing new highs, led by tech and growth stocks. Investors are shifting from protection to participation, favouring assets that benefit from improving trade flows and global demand. The latest US-China trade deal, focused on rare earth exports, only adds to that narrative. For now, risk-on is winning.
All Eyes on the Trendline
While the macro backdrop has turned more complex, the technical picture for gold remains clearly defined. After a strong rally into April, the market has entered a period of consolidation. A lower swing high formed in May, which was retested and rejected in June. That rejection triggered the most recent two-week slide, bringing the precious metal back to its rising trendline.
This trendline, in place since December 2024, has guided the broader uptrend and held firm on three previous tests. Once again, it finds itself under pressure. Whether it holds this time is an open question. Trendlines are only as good as the demand that supports them, and in a consolidation phase, that support can often be patchy.
The nature of consolidation is a kind of controlled drift, plenty of movement, but not much commitment. If the trendline does give way, that doesn’t necessarily spell the end of gold’s bull cycle. But it would likely open the door to a deeper correction, with the May swing lows in play. That area also aligns with the volume-weighted average price anchored to the December 2024 lows which is a key reference point for longer-term participants.
For now, gold is in wait-and-see mode. It is still above support, but no longer behaving like a market in control. If the broader risk-on mood continues, we may see further rotation away from safe havens. But if the growth narrative starts to wobble, don’t be surprised if gold finds its voice again.
Gold Daily Candle Chart
Past performance is not a reliable indicator of future results
Disclaimer: This is for information and learning purposes only. The information provided does not constitute investment advice nor take into account the individual financial circumstances or objectives of any investor. Any information that may be provided relating to past performance is not a reliable indicator of future results or performance. Social media channels are not relevant for UK residents.
Spread bets and CFDs are complex instruments and come with a high risk of losing money rapidly due to leverage. 85.24% of retail investor accounts lose money when trading spread bets and CFDs with this provider. You should consider whether you understand how spread bets and CFDs work and whether you can afford to take the high risk of losing your money.

GOLD XAUUSD potential 1-2 setup to downsideLooking at an potential 1-2 setup to the downside wave 3 of 5. adding to my previous gameplay

Gold: Eyes on QML Zone for Potential Reaction Before Deeper DropHello guys!
Let's go deep into the GOLD chart!
Price has completed a liquidity grab near 3440 (marked as "a hunting") and is now heading downward toward a key QML zone.
First, a reaction is expected around the QML area (3180–3220), where previous structural interest and demand may cause a temporary bounce.
After this reaction, the price is likely to retest higher, potentially forming a lower high.
Then, the dominant bearish structure is expected to continue, with a possible sharp drop toward the final demand zone around 3050–3080.
This movement represents a classic manipulation.

MULTIPLE TIME FRAME ANALYSIS, gather data to make good decisionsAll the information you need to find a high probability trade are in front of you on the charts so build your trading decisions on 'the facts' of the chart NOT what you think or what you want to happen or even what you heard will happen. If you have enough facts telling you to trade in a certain direction and therefore enough confluence to take a trade, then this is how you will gain consistency in you trading and build confidence. Check out my trade idea!!
www.tradingview.com

Gold in a Shifting Macro Landscape Fundamentals First: Why is Gold Falling While DXY is Too?
Normally, gold and the U.S. dollar share an inverse relationship (which means, when DXY weakens, gold rises). But recently, this correlation has broken down, and that divergence is a loud macro signal.
What’s Happening:
Trade Deal Optimism:
Headlines suggest the U.S. is nearing a resolution with China and other partners. With reduced geopolitical tension, investors are reallocating from safe-haven assets like gold into risk-on trades like equities and crypto.
Iran-Israel Ceasefire:
The temporary cooling of conflict has revived risk appetite. Traders are rotating out of war hedges (like gold and oil) and into tech, growth, and EM plays.
Real Yields Still Elevated:
Despite a softening Fed narrative, U.S. real yields remain positive, keeping pressure on non-yielding assets like gold. The fact that gold couldn't rally even as the 10-year note softened post-Moody's downgrade could be telling.
My Perspective:
This is the first clear signal in months that geopolitical hedging may have peaked. When gold decouples from its safe-haven narrative despite macro uncertainty, that often precedes a structural rotation phase, especially if institutional flows favor equities.
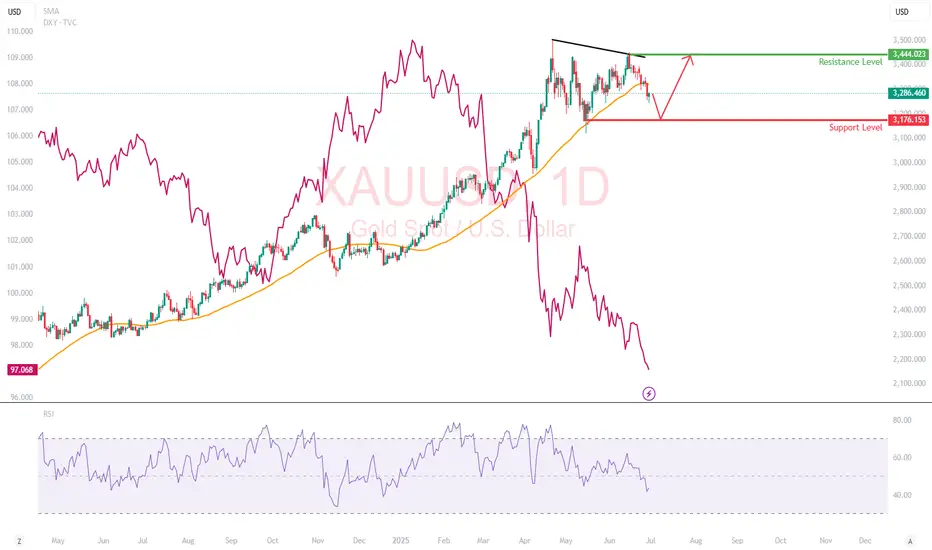
Technical Breakdown
Gold has broken below its 50-day SMA at $3,322 and is trading in the lower third of its 3-month range. While the daily candles show increasing selling pressure, especially on lower highs (a sign of weakening bullish momentum)
RSI : Falling toward 40, with no bullish divergence yet.
Support Level : $3,176: Previous swing low
Resistance Level : $3,444: previous swing high
What This Move Might Be Telling Us
When gold sells off on dollar weakness and geopolitical calm, the market isn’t just relaxing. It is rotating. The de-grossing of gold-heavy hedges: Some hedge funds may be taking profit on gold-heavy exposure from Q1’s rally.
Rise of risk appetite despite cracks: Markets are forward-pricing trade peace and earnings resilience, possibly too early. Gold might not be in trouble, but it’s on the bench. Unless something reignites fear (e.g., Fed policy mistake, Middle East flashpoint, or economic shock), capital may stay elsewhere.
XAUUSD: We must adapt to the market conditions! Bears in ChargeGold prices dropped as Trump announced a ceasefire between Iran and Israel, causing a significant decline. We anticipate this trend to persist, as recent price data, including volume and price momentum, indicates a strong seller’s control in the current market conditions. We have two targets for you to set your own based on your analysis, along with a stop-loss based on your strategy.
We appreciate your unwavering support throughout the years. Please like and comment.
Team Setupsfx_
❤️🚀
