Gold will retest $3,451 in the coming week I my opinion that based on my 4H analysis, Gold will retest $3,451 in the coming week but we need to pay attention to those daily key support zones. Gold usually does deep retracement and that makes the unmitigated Bullish OB a good zone for patient buyers/ Play safe.
CFDGOLD trade ideas

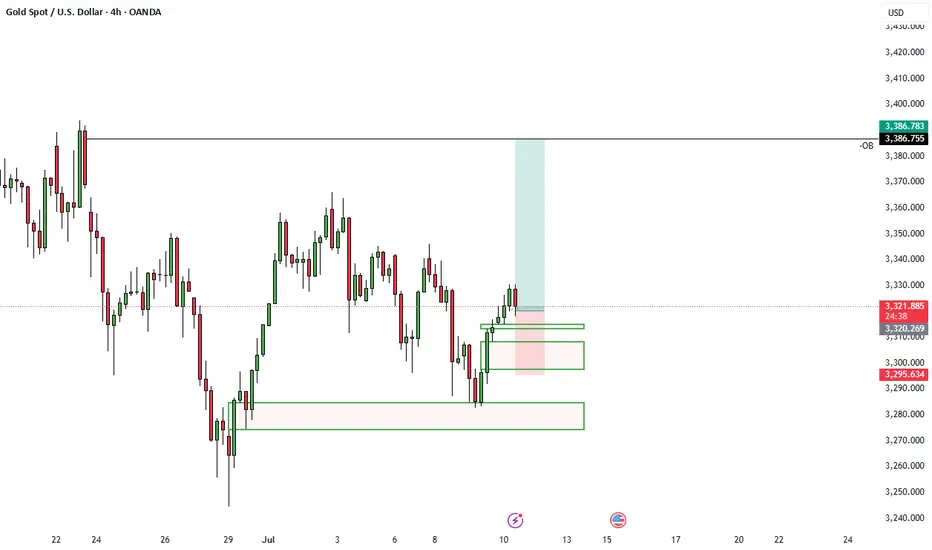
XAUUSD 1:2.7 R Trade Idea - ICTBullish on lower and higher time frames on gold, looking good to hit the -OB highlighted.
GOLD: Long Trade with Entry/SL/TP
GOLD
- Classic bullish formation
- Our team expects pullback
SUGGESTED TRADE:
Swing Trade
Long GOLD
Entry - 3315.7
Sl - 3312.0
Tp - 3322.6
Our Risk - 1%
Start protection of your profits from lower levels
Disclosure: I am part of Trade Nation's Influencer program and receive a monthly fee for using their TradingView charts in my analysis.
❤️ Please, support our work with like & comment! ❤️

Liquidity Phucqon friday the gold moves upside and took the phucqing liquidity of some moderphucqars and move in sell i'm expecting the previous low as my take profits
Perfect prediction, pay attention to the high short entry pointTrump extended the tariff agreement to August 1 and began to collect tariffs again. Although it eased market tensions, his remarks will not be extended after the expiration, and he issued a tariff threat, which increased global trade uncertainty and pushed up risk aversion. There was no clear direction coming out of the Fed's meeting minutes last night, but the potential bias was bullish.
At the beginning of the Asian session this morning, I also indicated that gold would rise and then fall. At present, it has reached the highest point near 3325 and then began to retreat, but the 4H golden cross has just been formed. There is still a certain pressure above 3333. If the gold price repeatedly competes for this position, we can continue to short without hesitation. The second short position today is near 3340-3345. There is potential momentum for the bulls in the short term. If the European session continues to fluctuate below 3333, then the entry of short positions will be slightly more stable. Yesterday, short orders were given at the key points of 3321 and 3333, and TP looked at 3310. If the bulls re-emerge below 3310-3305, you can consider short-term long positions and target 3330-3335.

Gold Potential UpsidesHey Traders, in today's trading session we are monitoring XAUUSD for a buying opportunity around 3,330 zone, Gold is trading in an uptrend and currently is in a correction phase in which it is approaching the trend at 3,330 support and resistance area.
Trade safe, Joe.
GOLD – Demand-Driven Strength Amid Economic DataGOLD – Demand-Driven Strength Amid Economic Data
Gold (XAUUSD) continues to show bullish momentum today, driven by increased demand and buying interest following a backdrop of recent economic data.
Key Price Levels to Watch:
Resistance Zones: 3320 and 3345 / 3293
Technical Outlook: The recent decline is forming an interesting bullish correction pattern, and as long as bulls maintain price within the upward trend channel, the structure remains constructive.
You may find more details in the chart Ps Support with like and comments.

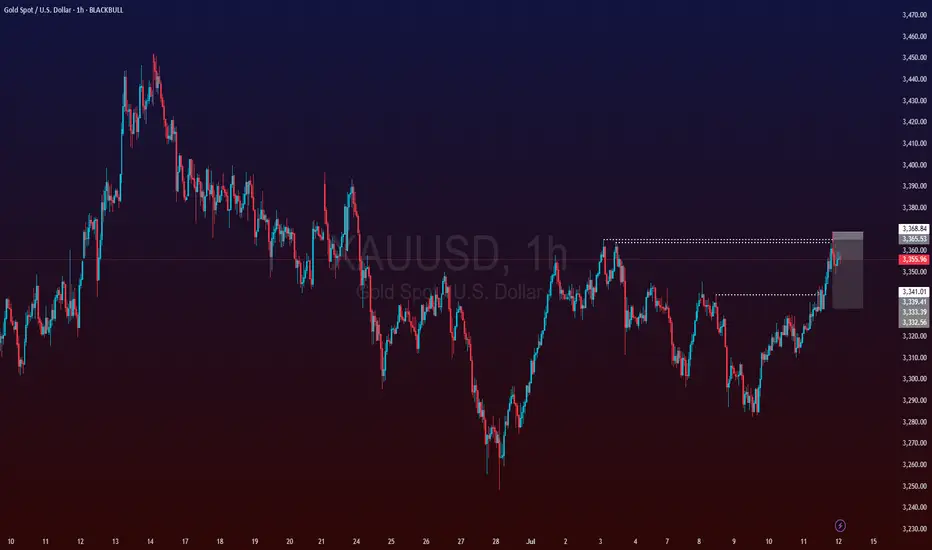
Reversal pattern. The price has tested $3,368.but failed to hold. A second failed attempt could form a double top—a classic bearish reversal pattern.

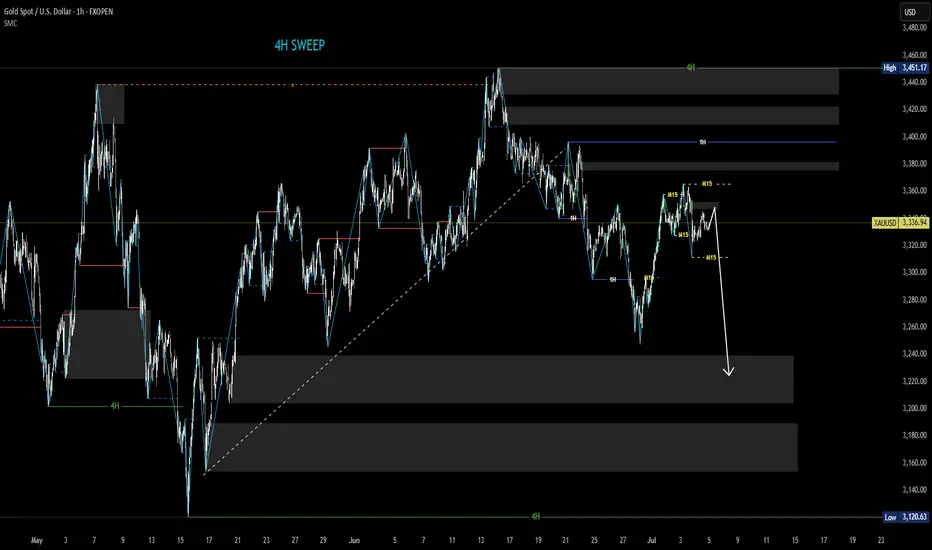
XAUUSD structure analysis on M15 and H1- 4H swing is bearish => currently giving a top sweep signal.
- H1 swing is bearish
- M15 swing is bearish
- We can look for selling opportunities according to the down structure of the M15 timeframe
(probably) sell!Hi all. as you see my last idea on Gold was failed but I think market needs a new Lower Low. I wanna try this critical Top as a second option. Let see what happened.(wink)

XAULD.1 setupDear all my friends.
this would be my setup for today.
calculate your position size with 583 Point stoploss.
final tp is TP3.
..
..
..
XAULD STRATEGY setup no.1
feel free to ask any question.

XAUUSD on mini rangeGold is currently holding Rangebound 3330-3345.
Break of this range will give proper next move.
What's possible scanarios we have?
▪️if the H4 candle flips Above 3345 then keep buy set targets at 3365 then 3375.
Additional TIP:
Below 3330 I will Activate my resell and hold till 3315 then 3305.
All the entries should be taken if all the rules are applied
#XAUUSD

Gold Trade Plan 11/07/2025Dear Trader,
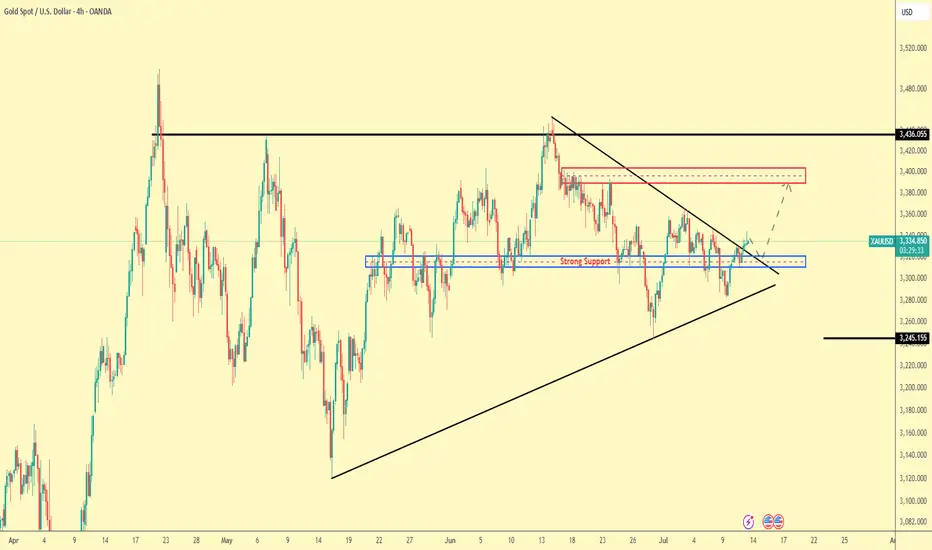
Technical Analysis – XAUUSD (Gold Spot/USD) – July 11, 2025
🕐 Timeframe: 4H
Gold price is currently trading around $3334. After rebounding from a strong support zone (blue box), price has broken out of a symmetrical triangle pattern to the upside, suggesting a potential bullish continuation.
🔸 Key Points:
Strong Support Zone: $3295–$3310 (held well during recent retests)
Symmetrical Triangle Breakout: Confirmed to the upside – typically a bullish signal
Next Resistance: $3390–$3400 (marked in red)
Major Resistance: $3436 (recent top)
📈 Probable Scenario:
If price holds above the breakout level, a move toward the $3390–$3400 resistance area is likely. A break above that could lead to a test of $3436. However, a drop below $3310 would invalidate the bullish setup.
Regards,
Alireza!
Gold: Market analysis and strategy on July 11Gold technical analysis
Daily chart resistance: 3375, support: 3285
Four-hour chart resistance: 3360, support: 3310
One-hour chart resistance: 3345, support: 3324.
For the current market trend, pay attention to the resistance of 3340-3345 on the upper side during the day. This is the high point concentration area that has suppressed the upward trend of gold prices many times in the early stage. If it is treated as a volatile market, sell at highs in the 3340~3345 range. If it breaks through 3345, it may trigger stop-loss buying and continue to rise to the 3355~3360 area.
The key support below is still at 3310, but from the 1-hour chart, the trend is rising in steps, and the short-term support is around 3324. Buy back here. After the Asian market was blocked near the previous high of 3345, it entered a short-term correction, and the long and short saws. It is suitable for fast in and out, and follow up and buy after breaking through 3345.
Buy: 3324near
Buy: 3310near
Buy: 3345near
Sell: 3344near

XAUUSD- Bearish AB=CD pattern at resistance zone!Timeframe:2H|Pattern: AB=CD| Bias: Bearish Reversal!
Gold (XAUUSD) has completed a precise AB=CD pattern aligning perfectly with a strong resistance zone near 3340-3350 the symmetry of the harmonic pattern combined with historical rejection levels gives a strong signal for a potential downside move
Trade setup idea:
Sell entry: 3340-3350
target:1: 3300
target:2: 3260
risk reward: Favorable setup with harmonic confirmation.

XAU / USD Daily ChartHello traders. Here is a daily chart showing the areas I will be watching to see how gold reacts. Wishing everyone a Happy Friday, we are almost halfway through the month, and we are more than half way through the year. Time is moving fast. Hope some of you are holding crypto as the monetary system is flawed, fake and failing. Big G gets a shout out. Let's see how the current 4 hour candle closes, as well as the 1 hour. I will post a lower time frame chart in a few hours when Pre NY volume starts to come in here in the US, which is just under 3 hours from now. Be well and trade the trend. It's Friday, so trade safely.

Gold: Wait for better prices for entriesHello,
Gold is once again forming a bullish flag, a perfect pattern for another bullish cycle. Since end of April 2025, Gold has been correcting after reaching the all time high. We see an opportunity for buys as we come closer to the low of the correction.
The MACD indicator is showing signs of an upcoming bullish crossover further reinforcing the thesis. From a fundamentals point of view Gold price continued to face hurdles since last week after the precious metal edged lower since last week as the US June Nonfarm Payrolls (NFP) report altered the US Federal Reserve (Fed) policy expectations.
Should the prices come further down, Investors may consider entering positions for this asset.
Disclosure: I am part of Trade Nation's Influencer program and receive a monthly fee for using their TradingView charts in my analysis.

7.11 Gold Analysis7.11 Gold Analysis
At present, the long and short forces are in a tug-of-war between three key factors:
1. Expectations of Fed rate cuts (core support)
Latest developments: Fed Governor Waller strongly called for a rate cut in July, but the market expects a rate cut in September with a probability of over 70% (CME data). The chairman of the San Francisco Fed expressed support for two rate cuts this year to ease inflation concerns.
Influence mechanism: Rate cuts will lower real interest rates and the US dollar exchange rate, significantly reducing the cost of holding gold. If subsequent CPI/PPI data are weak or the job market deteriorates, the rally may be triggered in advance.
2. Middle East geopolitical risks (pulse momentum)
Event escalation: The Israeli Defense Minister threatened to strike Iran again, and the risk of obstruction of Red Sea shipping increased.
Risk aversion logic: If the conflict breaks out in substance (such as an attack on oil facilities), it will trigger a safe-haven fund to flow into gold. At the same time, the surge in oil prices may push up global inflation and strengthen the anti-inflation properties of gold.
3. Trump's tariff policy (stagflation catalyst)
Policy impact: 50% tariff on Brazilian goods and imported copper (effective on August 1), triggering global supply chain disturbances.
Double effect: Pushing up the US dollar in the short term will suppress gold prices, but it may aggravate stagflation risks in the medium and long term, providing underlying support for gold.
Key contradiction conclusion:
The expectation of interest rate cuts is the cornerstone of gold's trend rise, and geopolitical and tariff risks provide breakthrough momentum. If the three resonate (such as escalation of conflicts + September interest rate cuts + tariffs push up inflation), gold prices may quickly hit above $3,400.
Technical multi-cycle analysis
Daily level
Pattern structure: Gold has fallen from the April high of $3,500, forming a triangular convergence pattern. After breaking through the previous high resistance of $3,346 and standing firm, it will enter the $3,350-3,374 oscillation box. MACD shows a golden cross signal, and RSI stands firm in the neutral zone of 55, indicating that bulls are accumulating power.
Key watershed:
Upward breakthrough point: $3374 (0.618 Fibonacci retracement level + previous daily high), after stabilization, it will open up the 3400-3420 space.
Downward risk point: $3330 (10-day moving average + triangle upper rail), if it fails, it may drop to 3310-3280 support.
Short cycle (4H/1H)
4-hour chart: The price runs in the rising channel (lower edge 3340/upper edge 3372), and the narrowing of the Bollinger Bands indicates that a breakthrough is imminent. Pay attention to the $3345 moving average support, and maintain the offensive if it holds.
1-hour chart: MACD top divergence repair is completed, and the high point of $3340 breaks through and stabilizes, which will trigger short-term follow-up buying.
Today's key events and trading windows
US June PPI annual rate: If the data is lower than the previous value of 2.2%, it will strengthen the logic of interest rate cuts and push up gold prices;
Federal Reserve Board member Waller's speech: Dovish remarks may become a catalyst for breaking through $3,346;
Israel Security Cabinet Meeting: Any signal of military action will trigger safe-haven buying.
Today's strategy
It is recommended to buy around 3,320, stop loss at 3,300. Target 3,340.
If my analysis can help you, I hope you can cheer me up.

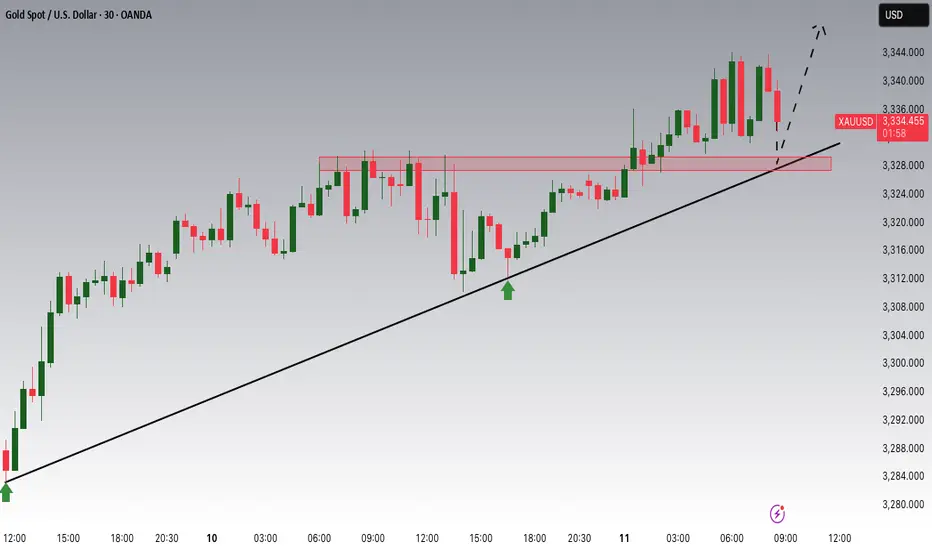
Gold (XAUUSD) Long Setup – 4H ChartTrade Type: Buy (Long)
Entry: Market Buy or Re-entry near 3332–3335
Target: Above 3360 (TP1: 3360, TP2: 3370+, final target near 3380–3400 zone)
Stop Loss: Below 3325 (Recommended: 3322–3324 for margin)
Re-entry Zone: If price pulls back to 3332–3335, look for bullish confirmation for re-entry
Setup Analysis: Favorable risk-reward structure with clear upside potential toward the 3380+ resistance zone
Context:
Strong recovery from previous lows
Bullish momentum building above 3343 resistance
Volume and price structure suggest breakout continuation
Pullback entries offer strategic positioning
Date: July 11, 2025
Shared by: @Pookie_xau

Do you think we are in a long position?According to the chart you can see, I am in a long position up to the $3355 range.

A buy opportunity on gold!Price broke and retested the level of 3311.56 therefore, from the technical perspective, a double button pattern is already formed and the neckline is broke. So, buy opportunity is envisaged.

Gold fluctuates repeatedly, how to seize the opportunityIf the direction is right, you are not afraid of the long journey. Use time to witness your strength, use your strength to win the future, let trust become profit, and use profit to resolve doubts. The market is changing rapidly, and going with the trend is the kingly way. When the trend comes, just do it, don't go against the trend to buy at the bottom, so as not to suffer. Remember not to act on impulse when trading. The market is good for all kinds of dissatisfaction, so you must not hold orders. I believe many people have experienced this. The more you resist, the more panic you will feel, and the floating losses will continue to magnify, making you eat and sleep poorly, and you will miss many opportunities in vain. If you also have these troubles, then you might as well follow my pace and try to see if it can make you suddenly enlightened.
Gold is concerned about the short-term pressure of the 3316 line above, and focuses on the pressure of the 3325 line. If the pressure above the 3325 line is not broken, then the possibility of gold further breaking through the lower space to 3295-3300 in the short term will also increase significantly. Therefore, the main line of gold operation is still based on holding shorts and rebounding shorts. Gold can rebound to the 3316 line and 3325 line before considering participating in short shorts. In terms of operation, we first pay attention to the support of the 3295-3300 line. If the lower support is broken today, the market will reverse to the short side. Otherwise, we will continue to rebound from the bottom and look for opportunities to go long.
From the current trend of gold, pay attention to the support of the 3300-3295 line below, the short-term resistance above pays attention to the vicinity of 3316, and focus on the suppression of the line near 3325. The overall main tone of high-altitude low-multiple cycle participation remains unchanged. In the mid-line position, keep watching and do less, follow orders cautiously, keep the main tone of participating in the trend, and patiently wait for key points to participate.
Gold operation strategy:
1. Go long on gold around 3330-3295, target 3315-3320.
2. Go short on gold around 3315-3325, target 3305-3300.

Expecting Gold bullish Movement The chart illustrates a potential bullish reversal setup for Gold XAU/USD on the 15-minute timeframe Price action has recently tested and respected a key demand zone marked as the Kee point around the 32853 level This area acted as strong support with multiple rejections suggesting buyer interest
Following this, the price has started forming higher lows and higher highs indicating the beginning of a bullish structure The large blue arrow suggests bullish momentum is expected to continue, aiming for upside targets
Key Levels
Kee Point Support Zone 3285 Crucial area where the reversal initiated
Target 1: 3316 First resistance level and a potential take-profit zone
Target 2: 3330 Final bullish target if momentum sustains
Outlook
As long as the price holds above the Kee Point, bullish continuation is favored
Breaking and closing above Target 1 could lead to further gains toward Target 2
A break below the Kee Point would invalidate this bullish scenario
This setup presents a potential buying opportunity with defined upside targets contingent on sustained bullish pressure
