A buy opportunity on gold!Price broke and retested the level of 3311.56 therefore, from the technical perspective, a double button pattern is already formed and the neckline is broke. So, buy opportunity is envisaged.
CFDGOLD trade ideas

Weekly CRT on XauusdBuy the dip bros
The gold will fly
Just find entry and keep buying
Retracement, buy
buy
buy
buy and buy
Don't go to far trying to sell the market
The real direction is up
Confluences for buy:
20 day ipda range sweep of the previous day low
Weekly CRT
CRL was swept
1 hour cisd
Targeting CRH and ATH

Glod 2hours bearish analysis Meta AI: The image shows a computer screen displaying a trading chart for Gold Spot/U.S. Dollar on the TradingView platform. The chart is set to a 2-hour time frame and features a candlestick pattern with red and green bars, indicating price movements.

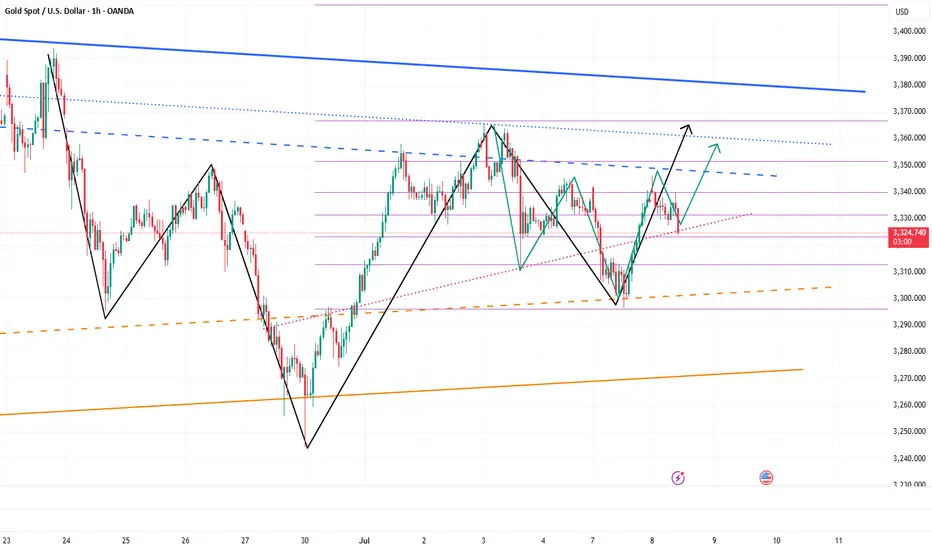
Gold 1hour bulish analysis Meta AI: The image shows a computer screen displaying a trading platform, specifically a chart for Gold Spot / U.S. Dollar on the OANDA platform. The chart is set to a 1-hour time frame and displays the price action of gold over the past two hours.

Gold 1hour bearish analysis The chart is presented in a dark mode interface, with red and green candlesticks indicating price movements over time. Various technical indicators are available, including moving averages, relative strength index (RSI), and Bollinger Bands, although none are currently applied to the chart. A replay feature is also available, enabling users to review historical price action and analyze past market trends. The overall impression suggests that the user is actively monitoring the Gold market, potentially for trading or investment purposes.

Expecting Gold bullish Movement The chart illustrates a potential bullish reversal setup for Gold XAU/USD on the 15-minute timeframe Price action has recently tested and respected a key demand zone marked as the Kee point around the 32853 level This area acted as strong support with multiple rejections suggesting buyer interest
Following this, the price has started forming higher lows and higher highs indicating the beginning of a bullish structure The large blue arrow suggests bullish momentum is expected to continue, aiming for upside targets
Key Levels
Kee Point Support Zone 3285 Crucial area where the reversal initiated
Target 1: 3316 First resistance level and a potential take-profit zone
Target 2: 3330 Final bullish target if momentum sustains
Outlook
As long as the price holds above the Kee Point, bullish continuation is favored
Breaking and closing above Target 1 could lead to further gains toward Target 2
A break below the Kee Point would invalidate this bullish scenario
This setup presents a potential buying opportunity with defined upside targets contingent on sustained bullish pressure

"GOLD Bandit Strategy: Loot Pips Like a Pro!🏆 GOLD HEIST ALERT! 🏆 XAU/USD Bandit Strategy (Swing/Day Trade)
Steal Pips Like a Pro! 💰🔓 Bull vs. Bear Raid Plan
🌟 Greetings, Market Pirates! 🌟
"The trend is your accomplice—time to loot!"
🔮 Thief’s Technical & Fundamental Intel:
XAU/USD (The Gold Vault) is flashing BEARISH signals, but we’re ready to raid both sides! Follow the heist blueprint below 👇
🎯 ENRY POINTS (Where to Strike!)
🏴☠️ LONG RAID (Bullish Thieves):
Break & Grab: Enter above 3450.00 (Pullback Zone)
"Wait for the breakout, then ambush!"
🐻 SHORT RAID (Bearish Bandits):
Sneak Attack 1: Sell below 3300.00
Sneak Attack 2: Sell below 3260.00 (Support Wall Cracked!)
🛑 STOP-LOSS (Escape Routes)
Bullish Trade: SL at 3230.00 (Guard your loot!)
Bearish Trade 1: SL at 3360.00 (Don’t get caught!)
Bearish Trade 2: SL at 3280.00 (Risk = Reward!)
(Adjust SL based on your risk appetite & lot size!)
💰 TAKE-PROFIT (Cash Out & Flee!)
Bullish Thieves: TP at 3270.00 (Or escape early!)
Bearish Bandits (1): TP at 3270.00
Bearish Bandits (2): TP at 3210.00 (Big score!)
⚠️ WARNING: Market Traps Ahead!
News = Danger Zone! 📢 Avoid new trades during high-impact news.
Trailing SL = Your Getaway Car! Lock profits & evade reversals.
📰 FUNDAMENTAL BACKUP (Why This Heist Works)
Bearish momentum fueled by macro trends, COT data, & sentiment.
Stay sharp—markets shift fast!
💥 BOOST THIS HEIST! 💥
Like & Share to strengthen our pirate crew! 🚀 More alerts = More profits!
🚨 Next Heist Coming Soon… Stay Tuned! 🚨

4-Hour Chart Strategy: Sell High, Buy Low Within 3280-3325 RangeBased on the 4-hour analysis 😎, today's short-term resistance above focuses on the hourly top-bottom conversion level around 3318-3324 🚫. If there's an intraday rebound leaning on this zone, first go short to target a pullback ⬇️. The short-term support below is around 3280 🔍. Overall, rely on the 3280-3325 range to maintain the main strategy of "shorting at highs and buying at lows" in cycles ✅. For prices in the middle of the range, always watch more and act less 👀, be cautious of chasing orders 🚫, and wait patiently for key levels to enter positions 🕙
Strategy:
🚀 Buy @3280 - 3285
🚀 TP 3290 - 3295 - 3305
🚀 Sell @3320 - 3315
🚀 TP 3310 - 3305 - 3295
Accurate signals are updated every day 📈 If you encounter any problems during trading, these signals can serve as your reliable guide 🧭 Feel free to refer to them! I sincerely hope they'll be of great help to you 🌟 👇

GOLD MONTHLY CHART LONG TERM/RANGE ROUTE MAPHey Everyone,
We’ve just released our new Monthly Chart idea, which we’ll now be tracking following the successful completion of our previous long term monthly chart idea. That one played out beautifully, and now it’s time to shift focus to the next big setup.
Currently, price is trading above the channel midline, and we’ve also seen an important EMA5 cross and lock above 3099, with a candle body close confirming a long term gap above at 3557.
While this confirms the bullish long term structure, we’re also mindful of the potential for a short term retracement, particularly around the EMA5 detachment zone (highlighted with a circle on the chart). This would offer a healthy dip opportunity, aligning perfectly with our strategy to buy into weakness on the way up.
For the bigger structure to remain intact, we’ll be looking for 3099 to continue holding as key structural support. As long as that level is respected, the long term gap toward 3557 remains firmly in play.
This is a higher timeframe idea that we’ll be building on as structure continues to unfold.
We will continue to use all support structures, across all our multi time frame chart ideas to buy dips also keeping in mind our long term gaps above. Short term we may look bearish but looking at the monthly chart allows us to see the bigger picture and the overall long term Bullish trend.
As always, we will keep you all updated with regular updates throughout the week and how we manage the active ideas and setups. Thank you all for your likes, comments and follows, we really appreciate it!
Mr Gold
GoldViewFX

GOLD (XAUUSD): Time to Recover?!
Gold reached an important rising trend line on a daily.
I see 2 nice intraday bullish reactions to that on a 4H time frame
and a double bottom pattern formation.
Its neckline breakout and a 4H candle close above 3309
will confirm a start of a bullish correctional movement.
Goal will be 3327.
Alternatively, a bearish breakout of the trend line will push
the prices lower.
❤️Please, support my work with like, thank you!❤️
I am part of Trade Nation's Influencer program and receive a monthly fee for using their TradingView charts in my analysis.

Gold is expected to regain bullish momentum and continue to 3360Yesterday, gold rebounded from 3296 and was able to reach around 3345. Although the process was rather painful, we have to admit that gold bulls still have the energy to wrestle with bears, and the gold market is not one-sidedly dominated by bears. As gold gradually tested and confirmed the effectiveness of support during the retracement process and then rebounded effectively, the short-term structure of gold gradually changed and began to favor bulls.
After gold hit bottom and rebounded yesterday, we can clearly see from the short-term structure that gold has successfully constructed a head and shoulders bottom structure in the three areas of 3295-3244-3296 in the short term, thus playing an absolute supporting role in the structure; and in the process of repeated testing of gold, there are signs of constructing a head and shoulders bottom structure in the three areas of 3310-3296-3325 locally again. Under the effect of the structural support resonance of the head and shoulders bottom, gold may not go below 3320 again, and may even regain the bullish trend and continue to the 3345-3355 area.
So I think there is a lot of profit potential in going long on gold. We can go long on gold with the 3330-3320 area as support and look towards the target area: 3340-3350-3360
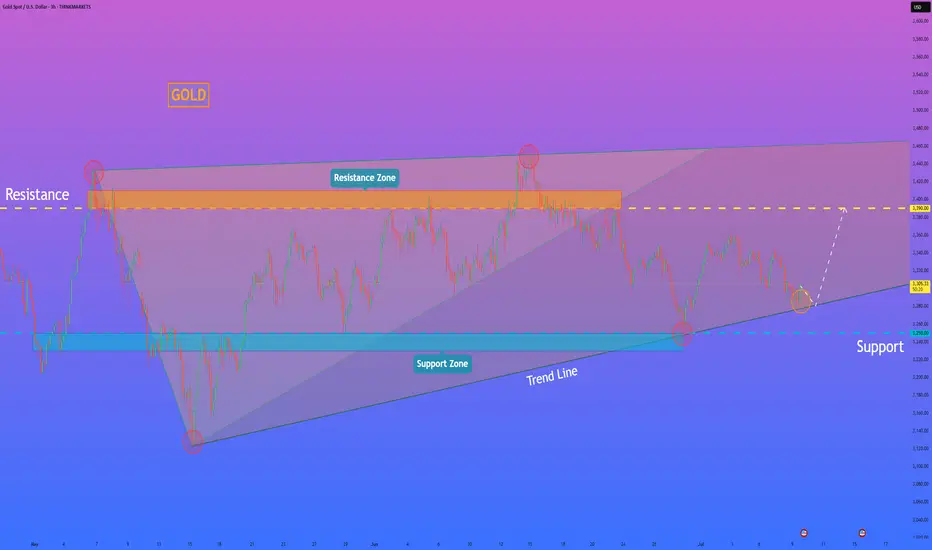
HelenP I. Gold can rebound from trend line and start to move upHi folks today I'm prepared for you Gold analytics. In this chart, we can see that gold has formed a clear wedge pattern, and within it, we can also observe a smaller triangle forming. This structure reflects a narrowing price range and growing tension between buyers and sellers. After testing the upper boundary near the resistance zone at 3390 - 3410 points twice, gold started moving lower and now approaches the trend line again. This level has already held as support multiple times, and each time the price touched it, it showed a rebound with renewed buying interest. Now the price is again trading near this trend line, around the 1300s area, and a small triangle has formed inside the larger wedge. This triangle may act as a base for the next upward movement. I believe that as long as gold respects this trend line and doesn’t break below the 3250 - 3230 support zone, the probability of upward continuation remains strong. My current target is the 3390 resistance level, which aligns with the top boundary of both the wedge and the resistance zone. A breakout above the triangle may give the price enough momentum to approach this area again. That’s why I remain bullish in this situation and expect a bounce from current levels, followed by an upward move toward the resistance. If you like my analytics you may support me with your like/comment.❤️
Disclaimer: As part of ThinkMarkets’ Influencer Program, I am sponsored to share and publish their charts in my analysis.
XAUUSD on swing Gold is currently holding Rangebound 3280-3296 .
Already holding buy positions at 3283-84
What's possible scanarios we have?
(PREFERRED )
▪️if the any M30-H1 candle flips above 3298-3300 then keep your eyes at 3315 then 3325
Additional TIP:
below 3278-3275 then we'll see gold to tap 3255 and buying will be invaild
#XAUUSD

XAU/USD (Gold) Bearish Outlook – H1/H4 Chart AnalysisGold is currently showing signs of weakness within a confirmed downtrend, forming lower highs and lower lows on the short-term charts. The price structure suggests continued bearish momentum as sellers maintain control beneath key resistance levels.
At present, a potential bearish opportunity is observed if price retraces near the 3320 zone, which aligns with a recent supply area and resistance in the ongoing downtrend. From this level, price action could continue its downward move in line with trend dynamics.
Entry Zone: Around 3320
Primary Target: 3300 (near-term support level)
Final Target: 3280 (extended target aligning with previous demand zone)
Invalidation/Stop Loss: Above 3340 (a break above this may invalidate the bearish bias)
🔸Disclaimer; This setup is based on technical structure and market flow, not financial advice. Always confirm with your own analysis and risk management plan.

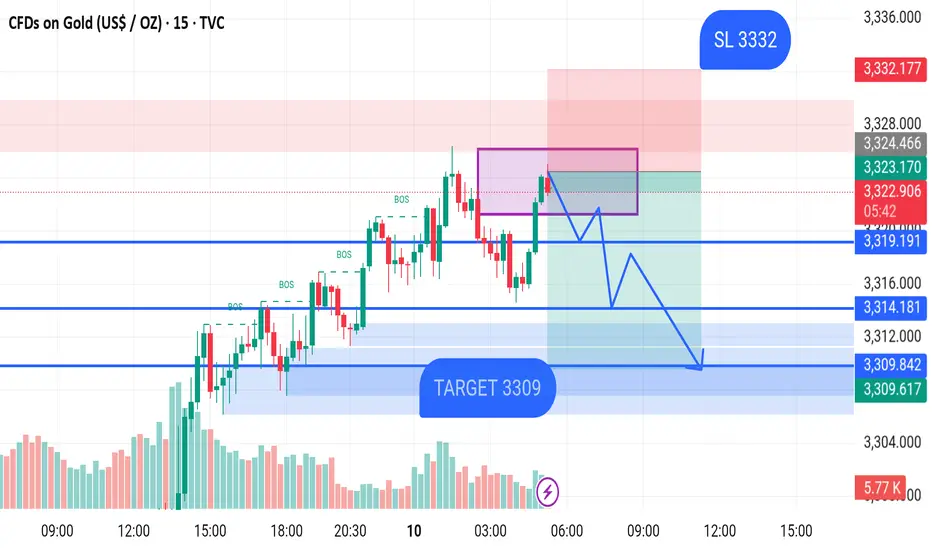
GOLD SELL M15 XAU/USD (Gold) 15-Min Chart Analysis – July 10, 2025
The chart shows that price is currently trading around 3323.98, approaching a key supply zone marked in purple. This area is expected to act as resistance, where price may reverse.
Multiple Break of Structure (BOS) levels have been marked, confirming bullish momentum earlier. However, the chart now suggests a potential bearish reversal from the supply zone.
Trade Idea:
Entry Zone: Near the top of the purple resistance area (~3324)
Stop Loss (SL): 3332
Target: 3309 zone (highlighted in blue), which aligns with the demand zone and previous structure
Key Levels:
Resistance Zone: 3324–3332
Support Zones:
First Support: 3319.19
Second Support: 3314.18
Final Target Zone: 3309.84 – 3309.61
The expected move is a sell from the supply zone down to the 3309 target. Price is projected to form lower highs and lower lows as shown by the blue arrow path.
Report - 9 jully, 2025Macro & Geopolitical Overview
Trump’s Tariff Threats vs Market Optimism
Despite President Trump’s insistence that sweeping tariffs will start August 1 (with no extensions), markets have demonstrated remarkable resilience. Wall Street appears to view these threats as a continuation of negotiation tactics rather than fixed policy.
The S&P 500 is up ~6% YTD, trading close to record highs, underpinned by robust corporate fundamentals and expectations of looser monetary policy.
Banks including Goldman Sachs, Bank of America, JPMorgan, Deutsche Bank, Citigroup, and Barclays have raised their S&P 500 forecasts, projecting additional 6–11% upside over the next 12 months.
Treasury Secretary Scott Bessent claims tariffs could yield $300bn in revenue this year, with $100bn already collected.
Market Read: Consensus suggests that repeated tariff postponements have desensitized investors, with strategists highlighting the continued strength in mega-cap tech and broader earnings momentum as outweighing trade policy risks.
EU Seeks Temporary Trade Deal
The EU is negotiating a provisional deal to maintain tariffs at 10% and avoid full-scale retaliation. German finance officials have warned of potential countermeasures if no fair resolution is reached.
Implications: A temporary truce could reduce volatility in European equities and alleviate pressure on the euro. Eurozone markets already showed optimism, with the Stoxx 600 up 0.3% and DAX and CAC 40 both gaining 0.6%.
Ukraine’s Financing Strains Intensify
The EU is urgently seeking to fill Ukraine’s projected $19bn budget gap for 2025 as ceasefire prospects diminish. Options under discussion include front-loading loans from G7 support packages and leveraging frozen Russian assets.
Trump’s promise to resume defensive arms deliveries provides a partial relief but does not fully address fiscal shortfalls.
EU leadership aims to finalize support plans before winter to ensure operational stability in Ukraine’s defense and civil services.
Strategic View: Ukraine’s funding gap underscores ongoing geopolitical risk in Eastern Europe, which could impact energy markets, defense equities, and the euro.
Port of Rotterdam Defense Preparations
Europe’s largest port is preparing for potential conflict with Russia by designating military cargo spaces and coordinating with Antwerp. This forms part of an EU-wide rearmament and strategic stockpiling effort.
Proposals include stockpiling critical raw materials (copper, lithium, graphite) and essential supplies.
Supports broader EU resilience efforts to reduce dependency on imports from China and Russia.
Implications: Reinforces the structural bullish thesis on critical raw materials and European defense contractors.
Corporate & Sector Updates
Wall Street Earnings Sentiment Turning Positive
Despite tariff noise, optimism around earnings season is rising.
Big banks expect solid Q2 results supported by labor market strength and easing inflation trends.
Analysts highlight that U.S. corporates have maintained guidance despite higher input costs.
Investment Implication: Reinforces overweight positioning in U.S. large caps, especially in tech and industrials with strong balance sheets.
Former UK PM Sunak Joins Goldman Sachs
Rishi Sunak rejoining Goldman Sachs as senior adviser highlights geopolitical expertise premium at major financial institutions.
Expected to advise on economic and geopolitical strategy while maintaining parliamentary role.
His compensation will support charitable projects, minimizing domestic political fallout.
BCG’s Gaza Fallout
BCG’s involvement in controversial Gaza post-war relocation plans has led Save the Children to cut ties after 20 years, severely damaging the firm's reputation.
Implications: Could impact BCG’s client relationships and broader consulting industry reputational risks, especially in ESG-conscious markets.
BP and Shell Return to Libya
BP and Shell have signed MoUs to explore and redevelop major Libyan oil fields, signaling re-engagement despite ongoing political instability.
Libya aims to raise output from 1.3m to 2m b/d.
These moves underscore Western energy majors' renewed focus on fossil fuels amid investor pressure for returns.
Investment View: Supports medium-term oil production growth; bullish for European oil majors despite ESG headwinds.
Asia & EM Updates
China’s Overcapacity and Deflation Concerns
China criticized local firms and governments for excessive price competition (neijuan), which has entrenched factory gate deflation for 33 consecutive months.
Beijing is signaling potential “supply-side reforms” to manage capacity and stabilize prices.
Overcapacity concerns extend to green sectors (solar, EVs), threatening global price dynamics.
Implications: May support global industrial metals prices if successful. However, near-term risks for global trade tensions remain elevated.
Southeast Asia Tariff Wall
Trump threatens 25–40% tariffs on Cambodia, Indonesia, Laos, Malaysia, and Thailand to counter Chinese transshipment practices.
Vietnam accepted a 20% base tariff, rising to 40% for transshipped goods.
Analysts predict higher production costs and consumer prices, potentially slowing ASEAN manufacturing relocation trends.
Strategic View: Increases risk premium on regional supply chains and may provide a tailwind for nearshoring/U.S. manufacturing.
Brics Pushback and De-dollarization Drive
Brics leaders sharply criticized Trump’s new 10% "anti-Brics" tariff threat. The bloc reaffirmed its commitment to reduce USD dependence and reform global financial governance structures.
Market Lens: Accelerated shift toward local currency trade settlements could support alternative reserve currencies and precious metals.
Alternative Assets and Innovation
Tokenized Treasury Funds Surge
Crypto traders and institutions are pivoting to tokenized Treasury and money market funds (assets up 80% YTD to $7.4bn) as an alternative to stablecoins.
Advantages: yield generation, rapid blockchain-based settlement, and new collateral options.
BlackRock, Franklin Templeton, and Janus Henderson products seeing robust inflows.
Implications: Bullish for blockchain infrastructure and tokenization service providers. Early-stage adoption curve but strong growth potential.
Sector Themes
Private Equity (PE): U.S. public universities are increasing PE allocations (targeting up to 30%) despite valuation and exit risks. Signals belief in long-term outperformance vs. muted public equity expectations.
Agriculture & EU Budget: CAP subsidies to farmers remain protected despite budget consolidation, driven by strong lobbying. Confirms ongoing policy support for European agricultural income stability.
Energy Transition & Defense: EU budget and port strategies reflect dual focus on green resilience and military preparedness, providing structural support to both ESG and defense-linked investments.
Markets Summary & Outlook
S&P 500 +6% Near all-time highs, supported by earnings optimism.
Euro Stoxx 600 +0.3% EU trade optimism offsetting geopolitical tensions.
DAX +0.6% Strong industrials rebound; trade negotiations key.
FTSE 100 +0.5% Supported by commodity strength and oil majors.
Dollar Index: +0.2%, moderate safe haven demand.
US 10Y yield: ~4.63%, reflecting ongoing macro uncertainty and strong U.S. data.
Gold: Supported by Brics de-dollarization narrative and geopolitical hedging.

XAU/USD Analysis – Expecting Fibonacci Retracement to 0.618 I’m currently anticipating a short-term retracement in XAU/USD towards the 0.618 Fibonacci level around 3323, followed by a continuation of the bearish move targeting a Fair Value Gap (FVG) around 3272.
📌 Technical Confluence:
The market has recently shown a strong bearish impulse, and the current price action appears to be forming a corrective retracement.
The 0.618 retracement level aligns with a key resistance area around 3323, increasing the probability of a bearish reaction from this zone.
There’s a visible FVG left unfilled near 3272, which may act as a price magnet.
I’m also watching for a liquidity sweep above local highs, followed by bearish confirmation on the lower timeframes (e.g., 5min) to trigger a short entry.
📉 Trade Idea:
Looking for a sell entry near 3323 after confirmation (liquidity grab, bearish structure shift, etc.)
Target: 3272 FVG zone
Stop Loss: Just above recent highs or liquidity zone, depending on intraday structure

Key point layout suggestionsThe current gold market is showing a weak rebound pattern. Although there was a small rebound on Wednesday, if it cannot stand above 3330, the overall trend will still be weak.
From the daily level, the support level is 3300 and the resistance level is 3335. The price is oscillating between the middle and lower tracks of the Bollinger Bands, and there is a possibility of upward or downward breakthrough.
Focus on the H4 cycle trend: if the rebound can stand above 3330, the price may further rise to 3335 US dollars;
Once it stands at 3335, it can be basically confirmed that the callback is over, and the subsequent challenge of 3345 resistance level may be repeated.
It is recommended to adopt a long-on-dip strategy near the support level, focusing on the support strength of the 3310-15 area below; the resistance level of 3335-3340 should be paid attention to above.
In terms of specific operations, if the price rebounds to the 3335-3340 range, short selling can be considered; if it pulls back to the 3310-3315 range, long selling can be considered.

Gold breaks through. Will it continue?After breaking through the position predicted by Quaid on Friday, gold rose strongly and finally maintained the fluctuation range of 3345-3360 that I predicted. Gold bulls are now strong. If there is no major change in the news over the weekend, the price will likely continue to rise after a slight decline at the beginning of next week. I think we can still follow the strategy of Dutou.
The 1-hour moving average of gold continues to diverge with a golden cross and upward bullish arrangement, and the bullish momentum of gold is still there. The current strong support level of gold has also moved up to around 3330. After gold broke through 3330 over the weekend, the price fell back to 3330 and stabilized and rose twice. In the short term, this position has formed a strong support.
There is a high probability that the price will have a small correction at the beginning of next week. We can continue the bullish strategy after the price falls back.
Market transactions should abandon personal preferences. Preconceived subjective consciousness will eventually be taught a lesson by the market. The market is always right. We should follow the fluctuations of the market. Instead of having a head full of random thoughts. There are always traces of market changes, and you need to have the ability to discover them or follow those who have the ability. The market changes rapidly, so pay attention to more timely changes.

Gold: Market analysis and strategy for July 10.Gold technical analysis
Daily chart resistance level 3345, support level 3245
Four-hour chart resistance level 3340, support level 3285
One-hour chart resistance level 3330, support level 3310.
Yesterday, gold bottomed out and rebounded, standing above 3310, breaking the previous downward rhythm. The breakthrough of the previous opening means that gold is likely to continue to rise. The current market is bullish above 3310. You can buy around 3310. The upper resistance is 3340/45 area. The gold price runs in this area. If the top signal appears at a small level, you can sell.
In terms of intraday operations, it is recommended to sell in the 3340-45 range after rising, and buy when it falls back to 3310. It runs in a narrow range and can be scalped.
SELL: 3343 near
BUY: 3310near


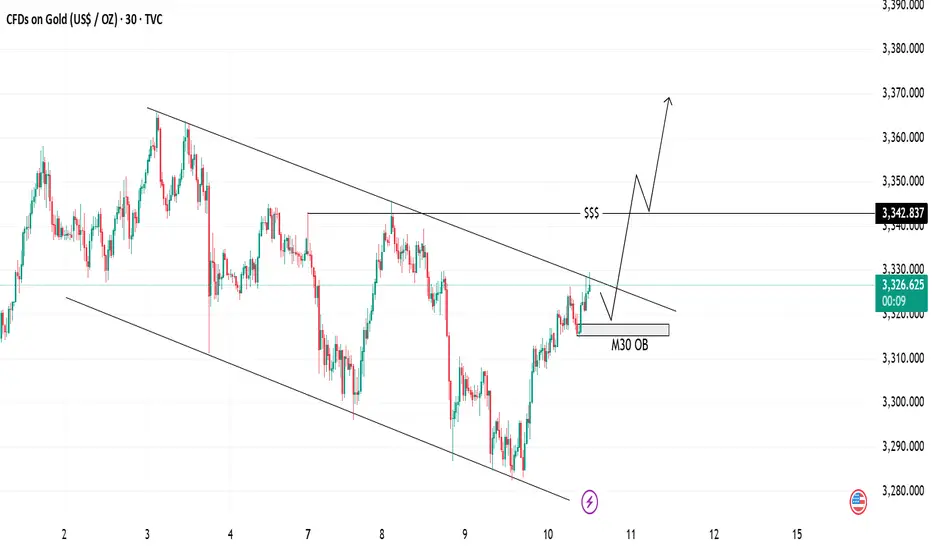
Gold Analysis Bullish Breakout | Trendline & OB Setup📈 Gold Analysis
We are currently seeing price action within a descending channel, testing key support at the M30 OB (Order Block). The price is pushing higher after bouncing off the support level, and the trendlines suggest a potential breakout to the upside.
💡 Key Levels:
Support Zone: 3326
Resistance Zone: 3342
The market is primed for a possible rally, indicated by the upward momentum and price breaking out above the trendline. Watch for confirmation as we approach the liquidity level for further bullish movement.
⚡ Trade Idea: Look for a long entry if price closes above the trendline for a continuation towards the next resistance.
XAUUSD Loses Short-Term Support – Deeper Decline May FollowGold (XAUUSD) is showing clear signs of short-term weakness after losing a key support zone around 3,287 USD – which previously aligned with the rising trendline and the 61.8% Fibonacci retracement level (3,295.20 USD) of the prior downward move.
1. Price Structure and Current Pattern:
Price has formed a descending triangle and just broke below its lower boundary with strong bearish candles.
Consecutive bearish candles with short lower wicks indicate strong selling pressure with little buying interest.
After being rejected at 3,304.25 USD – the most recent swing high – price has dropped toward the 0.0% Fibonacci level at 3,280.57 USD.
2. Fibonacci and Key Price Zones:
The 3,295.20 area (Fibo 0.618) has now become a strong resistance after a failed recovery attempt.
The 3,280 – 3,275 zone is the next target for bears if no strong reversal appears in upcoming sessions.
A break below 3,275.73 may open the path for further downside toward 3,268 – 3,260.
3. Trendlines and Candle Behavior:
The short-term rising trendline (in red) has been broken alongside increasing sell volume.
The upper descending trendline (in light blue) remains intact, confirming that the overall structure is still bearish.
Suggested Trading Strategy:
Sell on rallies: Prefer short entries around 3,290 – 3,293, with a stop loss above 3,296.
Short-term target: Look for potential take-profit zones at 3,275 – 3,268.
Avoid bottom fishing unless there’s a strong bullish reversal signal such as an engulfing or hammer candle backed by volume.
Conclusion:
Gold is under visible downside pressure below key technical resistance. If the price fails to hold above 3,280, the downtrend could extend further. Traders should remain cautious of weak pullbacks and look to enter in line with the dominant bearish trend.
