Gold #gold god currency
Doesn't restore to earthly realm default i.e safe heaven (haven)🌠
RALLY & correction
🪽Trade wars
✒️ Tariffs threat's stocks
🪽Geopolitics war's i.e rising lion
✒️ Loose confidence fiat & bond
🪽 Inflation concern i.eFed talk
🪽 central banks buying gold i.e french bank
✒️ Institution money invested in gold
Technical analysis
☄️
H/H $3500
L/L $2828
#intergalactic
💌Trend line Support
$3285
$3245
$3120 @gold_pullback
$2958
$2828
Rally I $2536
Rally base $2958
Rally II. $2958 to $3500
🔗Swings
A trend is over if recent swing is beyond/below previous swing
Bullish continuation patterns
🌻$3360 swing high
🌻$3245 swing low
🍁 #Bullish flag 🏁support $3285
🌻$3450 swing high
🌻$3245 swing low
🦸 bullish falling 🌠 wedge
CFDGOLD trade ideas

GOLD SELL SETUPAfter a strong bullish move, price approached a key resistance zone near the 3325–3330 level, which coincides with a potential supply zone created by previous price rejection. The market structure showed signs of slowing momentum, with multiple wicks to the upside and smaller-bodied candles near resistance, indicating possible exhaustion of buying pressure.

Waiting for the Perfect Entry: XAUUSD Market Structure Breakdown🔍 Taking a look at XAUUSD today: it’s clearly in a downtrend 📉 on the 4H chart, with consecutive lower highs and lower lows 🔽.
📌 My bias is bearish, and I’m patiently waiting for price action to set up for an entry 🎯.
If we get a break of market structure 🧱, followed by a retest and failure of the current range high 🚫, that could present an opportunity 👀 — not financial advice ⚠️.

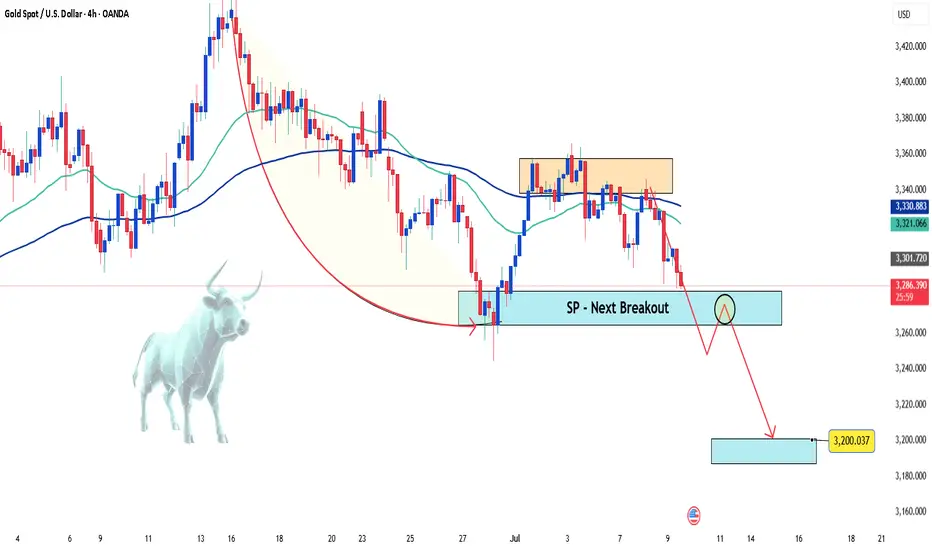
First Drop to 3307–3289, Then Buy for the Next UptrendOur system has identified a strong short signal across short-term, medium-term, and long-term timeframes as of July 3, 2025, with confidence levels above 89%. All durations are aligned, indicating a synchronized momentum shift.
Entry Point : 3354.43
Short-Term TP : 3334.30
Medium-Term TP : 3320.89
Long-Term TP : 3307.47~ 3289
📉 Based on the current market structure and signal convergence, TeconLab expects XAUUSD to drop into the 3307–3289 range, where a potential reversal zone is likely to form.
🛡️ Safest Entry for Buy: The 3289 level is considered the most favorable area for entering long positions after the expected correction completes.
📈 After reaching this zone, our system anticipates a new uptrend to begin, offering a fresh opportunity for upside movement.
The TP Zigzag path displayed on the chart outlines the projected decline with target steps, preparing for a potential bullish reversal afterward.

GOLD → Correction for confirmation before growthFX:XAUUSD is recovering due to increased demand as a safe-haven asset. After breaking through local trend resistance, an upward channel is beginning to form on the chart.
On Monday, gold tested the 3295-3300 zone (liquidity zone) and, against the backdrop of incoming economic data, is buying back the decline, forming a rather interesting pattern that could lead to continued growth, but there is a but!
Investors are reacting to President Trump's threats to impose tariffs on imports from a dozen countries starting August 1. In addition, the main question is the Fed's interest rate decision. The regulator is likely to leave the rate unchanged due to inflation risks.
Uncertainty surrounding tariffs is supporting interest in gold as a safe-haven asset. The market is awaiting further news and the publication of the Fed minutes on Wednesday.
Resistance levels: 3345, 3357, 3396
Support levels: 3320, 3311, 3295
A correction to support is forming. If the bulls hold their ground within the upward channel and above the key areas of interest, the focus will shift to 3345, a resistance level that could hold the market back from a possible rise. A breakout of this zone would trigger a rise to 3357-3396.
Best regards, R. Linda!

XAU/USD – 4H Elliott Wave AnalysisOANDA:XAUUSD
We are currently in an upward correction on the 4H chart, developing within an ABC structure from Wave 1 into Wave 2.
✅ Wave A has already been completed.
🔁 Wave B is most likely in place – though I've also marked an alternate yellow B if the white one fails.
⚡️ We’ve seen the first impulsive push up, which I label as a smaller Wave 1 within B.
🔄 Now expecting an ABC pullback into the smaller Wave 2.
📐 The Fibonacci retracement zone (white box) marks the key area for this correction.
🎯 Blue lines inside the zone are my targets for Wave 2.
If the structure holds, we should see a clean 1-2-3-4-5 move in Wave B toward Wave C – completing the higher-degree Wave 2. After that, I expect bearish momentum to take over again.

Gold (XAUUSD) Trade Setup – Valid Until July 10, 2025This 15-minute chart shows a clean technical breakout from a falling channel. Here's how to interpret and potentially trade this move:
🧠 Context: What Just Happened
Price was locked inside a descending channel (blue) for multiple sessions.
A breakout occurred above the channel, indicating a potential short-term bullish reversal.
The bounce aligns with recent tariff-related headlines easing off and short-covering momentum building.
I trade these support and resistance lines daily on micro gold futures.
What these lines represent:
Golden Line: Heavy Support or Resistance depending on the price direction towards the lines for major reversal or $10-$15 swings.
Silver Lines: Consolidation areas or mid way support and resistance for a scalping few touches.
Bronze dotted lines: Low volume days support and resistance for a quick $5 up or down.
Also, I can see a directional setup. Here is a hypothetical scenario that could play out:
📌 Key Zones to Watch
🔼 Resistance $3,342 Next major target / sell zone
🟧 Resistance $3,319 Current breakout level retest
⚪ Support $3,307–$3,316 Minor consolidation area
🔻 Support $3,295–$3,289 Strong demand / invalidation
🚨 Bear Pivot $3,272 Break below = bearish return
🧭 Trading Playbook
Bullish Bias (Preferred Scenario)
✅ Break and hold above $3,319 = potential move to $3,342
🎯 Target: $3,340–$3,342
🔒 SL below: $3,307
Optional re-entry on retest of $3,316 zone
Bearish Reversal (If Bulls Fail)
⚠️ If price fails $3,319 and breaks back below $3,307, sellers may reclaim control
📉 Look for short setups toward $3,295 and even $3,272
SL above: $3,319
📌 Key Tip
Watch for volume confirmation and 5m candle closes at each level. Don’t chase — let price come to your levels.
⏳ Validity
This setup remains valid through July 10, or until $3,342 target is hit or $3,272 is broken.
This is not financial advice; it's for educational purposes only.

Gold Loses Its Shine – Short-Term Sentiment Turns BearishHello everyone, great to see you again for today’s market chat!
The factors that once made gold appealing — inflation fears, economic uncertainty, and the flight to safety — are gradually fading. As confidence grows that the Fed will maintain high interest rates for an extended period, capital is steadily moving away from gold and into more stable, yield-generating assets.
Across the financial community, there’s growing consensus: gold is no longer a top investment priority. The U.S. dollar is gaining strength, Treasury yields are rising, and gold’s support structure is weakening. While investors await the Fed’s next move, many are staying on the sidelines — or even leaning toward a bearish outlook. Notably, the rebound in the DXY is also playing a key role in adding pressure.
Gold is currently lacking momentum, lacking support, and most of all — lacking conviction. At this stage, the trend is no longer a debate, but a widely accepted short-term reality.
What about you — where do you think gold is headed next?
GOLD 1H CHART ROUTE MAP UPDATE & TRADING PLAN FOR THE WEEKHey Everyone,
Please see our updated 1h chart levels and targets for the coming week.
We are seeing price play between two weighted levels with a gap above at 3358 and a gap below at 3330. We will need to see ema5 cross and lock on either weighted level to determine the next range.
We will see levels tested side by side until one of the weighted levels break and lock to confirm direction for the next range.
We will keep the above in mind when taking buys from dips. Our updated levels and weighted levels will allow us to track the movement down and then catch bounces up.
We will continue to buy dips using our support levels taking 20 to 40 pips. As stated before each of our level structures give 20 to 40 pip bounces, which is enough for a nice entry and exit. If you back test the levels we shared every week for the past 24 months, you can see how effectively they were used to trade with or against short/mid term swings and trends.
The swing range give bigger bounces then our weighted levels that's the difference between weighted levels and swing ranges.
BULLISH TARGET
3358
EMA5 CROSS AND LOCK ABOVE 3358 WILL OPEN THE FOLLOWING BULLISH TARGETS
3389
EMA5 CROSS AND LOCK ABOVE 3389 WILL OPEN THE FOLLOWING BULLISH TARGET
3416
EMA5 CROSS AND LOCK ABOVE 3416 WILL OPEN THE FOLLOWING BULLISH TARGET
3439
BEARISH TARGETS
3330
EMA5 CROSS AND LOCK BELOW 3330 WILL OPEN THE FOLLOWING BEARISH TARGET
3306
EMA5 CROSS AND LOCK BELOW 3306 WILL OPEN THE SWING RANGE
3283
3254
As always, we will keep you all updated with regular updates throughout the week and how we manage the active ideas and setups. Thank you all for your likes, comments and follows, we really appreciate it!
Mr Gold
GoldViewFX

XAU / USD 4 Hour ChartHello traders. We had a nice push up, and I have marked the area(s) for potential scalp sell / buy trades. NY open is in 1.15 hours from this writing. If I can catch the move either up or down with the NY volume, there is a good scalp trade set up. Big G gets my thanks. Be well and trade the trend.

XAUUSD BREAKOUT TRADE (READ CAPTION)hi trader's. what do you think about gold
current price: 3318
gold is breakout bullish trade line gold retest down side. then gold taking support and jump upside
support zone: 3314,3295
resistance zone :3345,3365
stop loss: 3282 market low

XAUUSDSELL Plan XAUUSD
GOLD rejecting from 4h resistance zone book partial profits risk free once yuo got 1:1
Best of luck

Continue to try to find the top of the band to short goldGold maintained a slow and volatile rise structure during the day. The highest has reached 3348, and it is only a step away from 3350. Will gold continue its upward momentum as usual?
In fact, it was beyond my expectation that gold could break through 3345 in the short term. According to my original expectation, the intraday high of gold was almost around 3345. Although the rebound of gold exceeded expectations, it is currently located near the resistance of 3348-3350, so I will definitely not give priority to chasing gold at high levels in short-term transactions.
Moreover, gold is currently in the resistance area of 3348-3350. The volatility of gold has converged, and the upward momentum has declined. As gold continues to rebound and faces the key resistance area again, the bulls are relatively more cautious. In this context, this resistance area may act as a catalyst, and the bears will react, leading the decline in gold. However, as gold rebounds and the support below gradually stabilizes, we can appropriately reduce the expectation of gold's decline and adjust the decline target to the 3330-3320 area.
So for short-term trading, I will still short gold based on the resistance area, trying to find a swing top in the 3340-3350 area, and look at the target area of 3330-3320.

Gold price rises as expected, is 3400 far behind?
💡Message Strategy
Trump announced on Friday that he would impose a 35% comprehensive tariff on Canadian imports, which will take effect on August 1, which caused a market shock. As Canada's largest trading partner, the United States accounts for 76% of Canada's exports in 2024. This move will undoubtedly have a profound impact on the global supply chain and trade pattern.
In addition, Trump's tariff policies on copper and Brazil have further exacerbated market uncertainty, pushing gold prices to break through key technical resistance levels and move towards the $3,400 mark.
The Fed's policy moves also have an important impact on market sentiment. The minutes of the June meeting released on Wednesday showed that the Fed's internal concerns about tariffs potentially pushing up inflation are growing. The minutes pointed out that "most participants emphasized that tariffs could have a more lasting impact on inflation."
Despite this, the Fed reiterated that it would remain on the sidelines and wait for further clarity on inflation and economic activity. At present, according to the market forecast of the CME FedWatch tool, the probability of a 25 basis point rate cut in September has risen to 62.9%, reflecting investors' expectations that the Fed may ease early.
📊Technical aspects
Yesterday’s strategic recommendations mentioned that the effective support level for gold was in the 3280-3285 range. Today, gold fell back to the 3280 level, stabilized, and began to rise, perfectly reaching the target.
From a technical perspective, gold has shown significant upward momentum this week. The daily chart shows that the price of gold has successfully broken through the symmetrical triangle resistance and touched the 20-day simple moving average (SMA) of $3,339.97.
This breakthrough marks a strengthening of the short-term technical pattern, showing that bulls have the upper hand. The relative strength index (RSI) has rebounded to around 55 on the daily chart and is trending upward, indicating that there is slight bullish momentum in the market.
However, in the short term, the upside of gold may be limited by the 23.6% Fibonacci retracement level ($3,370). If this level can be effectively broken, the psychological level of $3,400 and the June high of $3,452 will become the next target.
💰Strategy Package
Long Position:3335-3340,SL:3320,Target: 3370-3400

XAUUSD Bullish Structure Intact: Eyes on the All-Time HighGood day, traders. Taking a look at the Gold (XAUUSD) daily chart, we see a very clean and persistent bullish structure that has been developing since the start of the year. The primary driver of this analysis is the well-defined ascending trendline that has served as foundational support for the entire uptrend.
The Bullish Thesis:
Price action has consistently printed higher lows, bouncing cleanly off the ascending trendline multiple times. Each test of this support has been met with strong buying pressure, propelling the price to new highs. This pattern establishes a clear path of least resistance to the upside.
Currently, the price is challenging the immediate resistance zone around the 3,365 level. A decisive daily close above this area would be the first signal that the next leg up is underway.
First Target: A break of current resistance opens the door to test the Next Resistance at approximately 3,450. This level aligns with the previous significant high from early June.
Ultimate Target: The main prize for the bulls is the All-Time High sitting just above at 3,500. This is a major psychological and technical level. A break and hold above this zone would signal a new phase of price discovery.
The Bearish Invalidation:
For this bullish outlook to be invalidated, we would need to see a convincing break and daily close below the primary ascending trendline. Such a move would indicate a significant shift in market structure. Should this occur, key support zones to watch on the downside are:
The horizontal support area around 3,150.
The major structural support zone around 3,000.
Conclusion:
The technical picture for Gold remains firmly bullish. The structure is clear, and the trend is your friend. As long as the price continues to respect the ascending trendline support, the bias is to look for buying opportunities on dips or breakouts. The immediate focus is on clearing the 3,365 resistance to unlock the path towards the 3,450 and 3,500 targets.
Disclaimer:
The information provided in this chart is for educational and informational purposes only and should not be considered as investment advice. Trading and investing involve substantial risk and are not suitable for every investor. You should carefully consider your financial situation and consult with a financial advisor before making any investment decisions. The creator of this chart does not guarantee any specific outcome or profit and is not responsible for any losses incurred as a result of using this information. Past performance is not indicative of future results. Use this information at your own risk. This chart has been created for my own improvement in Trading and Investment Analysis. Please do your own analysis before any investments.

GOLD On July 9, 2025, the FOMC Meeting Minutes from the June 17-18 session were released, providing insights into Federal Reserve policymakers' views on monetary policy, inflation, and economic risks.
Key Highlights from the FOMC Minutes:
The FOMC unanimously voted to hold the federal funds rate at 4.25%–4.5% .
There was a notable split among members regarding the impact of tariffs on inflation:
Some saw tariffs causing only a one-time price increase with no lasting inflation effect.
Most feared tariffs could lead to more persistent inflationary pressures
The committee acknowledged elevated uncertainty around tariff policy and its timing, size, and duration of inflation effects.
Labor market conditions were viewed as solid but with some softening expected due to policy uncertainty and tariffs.
The committee remains cautious about the trade-offs between inflation and employment goals, favoring a gradual approach to future rate cuts.
Only a narrow minority of policymakers supported an immediate rate cut with most preferring to wait for clearer economic signals.
Market Reaction and Price Action
Gold Price Action:
Gold prices reacted to the minutes with modest volatility, as persistent inflation concerns support gold’s safe-haven appeal.
Gold remains near elevated levels around $3,250 to $3,316 per ounce, consolidating after recent gains.
The cautious Fed stance and tariff uncertainty underpin demand for gold as a hedge against inflation and geopolitical risks.
Summary Table
Event Details
FOMC Rate Decision Held at 4.25%–4.5%
Inflation Views Split on tariff impact; risk of persistent inflation
Rate Cut Support Narrow support for immediate cut in July
Overall Outlook
The Fed minutes reinforce a cautious, data-dependent approach to monetary policy, with inflation risks balanced against growth concerns.
Gold benefits from ongoing inflation worries and geopolitical uncertainty, maintaining strong support.
#GOLD

Gold is bullish trade (READ CAPTION) Hi trader
Current price is 3357
Gold resistance zone is 3365_3370 market reject this zone then market giving Retrecment down side 3345 and 3330 or market breakout 3365 and h4 closing above 3365 then gold continue bullish trade
Please follow me and like comments

Gold Market Rejects 3330 – Bullish Sweep Targets 3356Gold market forms a new stance as 3330's fail to hold significant supply. This rejection triggers a bullish sweep, with price now poised to target 3356 for the next leg of movement. Watch for continuation signals as momentum builds.follow for more insights , comment and boost idea
The rebound is under pressure and the retracement is furtherFrom the 4-hour analysis, the support below today is around 3309-16.
The short-term bullish strong dividing line is around 3295-3301. The overall bullish rhythm of high-altitude and low-multiple continues to remain unchanged.
Before the daily level falls below the 3300 mark, any retracement is a long opportunity, and short positions against the trend should be cautious.


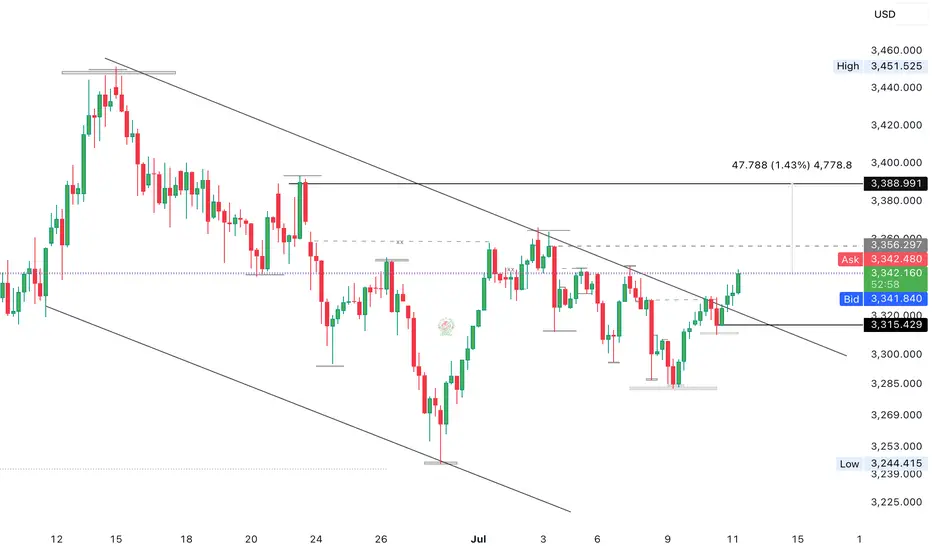
Elliott Wave Analysis – XAUUSD July 11, 2025
🔍 Momentum:
D1 timeframe: Momentum is currently rising, suggesting that the bullish trend is likely to continue for the next few days.
H4 timeframe: Momentum is also bullish, indicating that the uptrend is likely to dominate today.
🌀 Elliott Wave Pattern:
On the H4 chart, price action is in the final stage of a contracting triangle correction.
Price is now approaching the upper boundary of the triangle. With both D1 and H4 momentum in alignment, the probability of a breakout to the upside is high.
If this breakout occurs, we can expect a move toward the 3393 area, which is a key level to confirm whether the corrective phase has truly ended.
🎯 Price Targets:
Current area (3330–3332): A potential opportunity for a scalp BUY, supported by bullish momentum on H4.
Next support zone: 3315–3317 – a solid area for a mid-term BUY entry if there’s a pullback.
⚠️ If price breaks below 3279, the current wave count becomes invalid and a new analysis will be provided.
✅ Trade Plan:
🔹 SCALP BUY
Entry: 3332 – 3330
SL: 3327
TP1: 3363
TP2: 3390
🔹 MID-TERM BUY ZONE
Entry: 3317 – 3315
SL: 3307
TP1: 3342
TP2: 3363
TP3: 3390

XAUUSD SCALP TRADEentry based on 5m tf, so wait for the entry and take it, must use sl, you can take 1st entry at cmp, 3348.5 2nd at mentioned and set the target and forget.

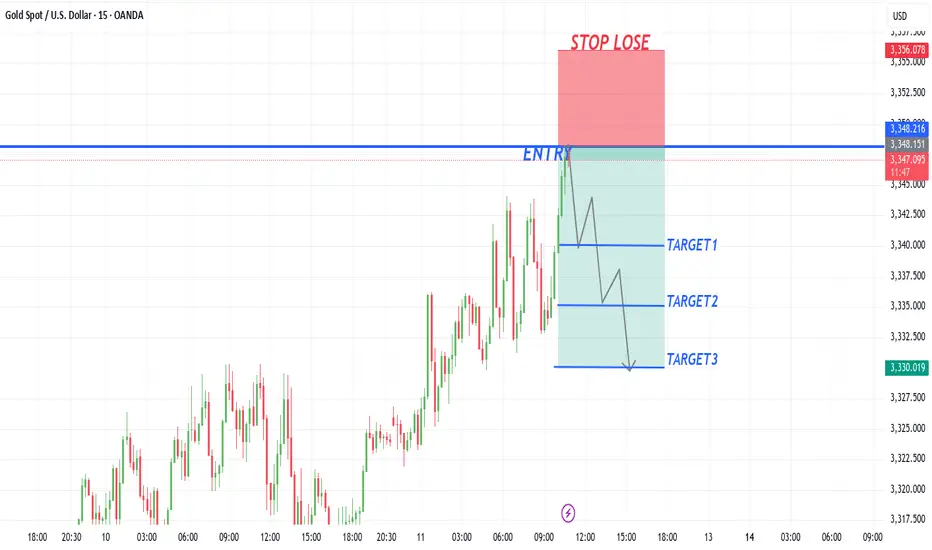
XAUUSD NEW LOOKXauusd sell from 3348
take profit1 3340
take profit2 3335
take profit3 3330
Stop lose 3356
Trade at your own risk