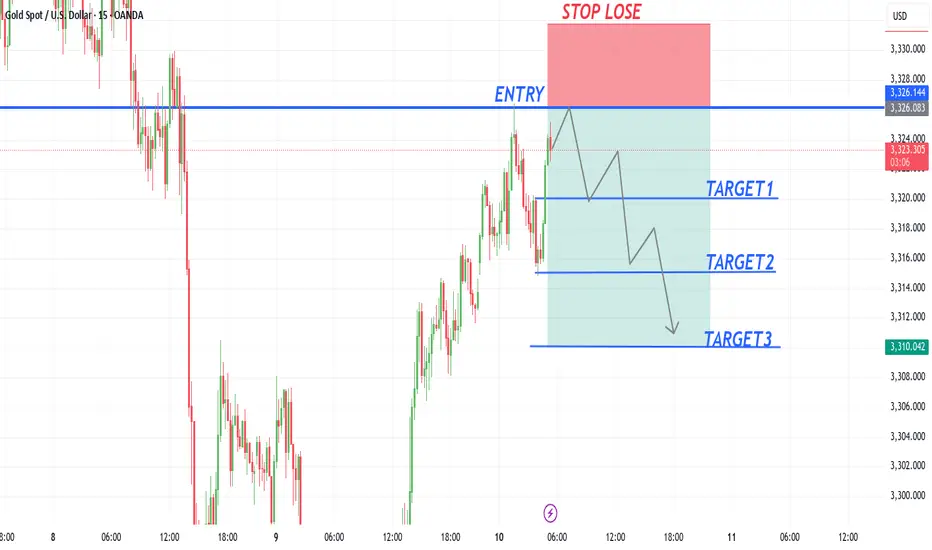
XAUUSD NEW OUTLOOK gold sell from 3326
Target1 3320
Target2 3315
Target3 3310
Stop lose 3332
TRADE AT YOUR OWN RISK
CFDGOLD trade ideas
Gold scalp 10-07Buyers pressure to bring gold to 3350 and above, 3343 next resistance, buys from 3323-3325, SL 3319

Xausd techinical analysis.This chart shows the Gold Spot vs. U.S. Dollar (XAU/USD) on the 1-hour timeframe, with current price action around 3,311.195.
Key Observations:
1. Descending Trendline (blue):
Shows recent bearish structure with lower highs.
Price is now testing this trendline from below.
2. Support and Resistance Zones (purple boxes):
Support: Around 3,303 – 3,306 (recent consolidation area).
Resistance: Around 3,327 – 3,332 (previous high and zone of interest).
3. Breakout Setup:
Blue arrow indicates a possible bullish breakout scenario.
The price is projected to break above the descending trendline and move toward the upper resistance zone (~3,330+).
4. Volume/Events Icon:
Icons suggest potential news events or volatility (such as U.S. data or FOMC-related impact), possibly increasing breakout chances.
Implication:
This is a bullish scenario suggesting:
A breakout of the descending trendline.
Retest of the breakout level.
Continuation toward the resistance zone (~3,330).
Strategy:
If trading this:
Entry: On confirmation of breakout and retest above 3,310–3,312.
Target: 3,327–3,332.
Stop Loss: Below the recent support ~3,300.
Would you like help building a trade plan or checking the fundamentals behind this move?

Wave idea, after 5 complete. ABC, 1 now 2. The M1 Abrams (/ˈeɪbrəmz/) is a third-generation American main battle tank designed by Chrysler Defense (now General Dynamics Land Systems) and named for General Creighton Abrams. Conceived for modern armored ground warfare, it is one of the heaviest tanks in service at nearly 73.6 short tons (66.8 metric tons).

Gold delivering excellent Scalp opportunitiesGold has tested #3,330.80 Resistance and got rejected many times as I firstly Bought Gold from #3,322.80 towards #3,330.80 Resistance zone in extension. Later on, I have added Selling order on #3,327.80 to the downside and closed it on #3,320.80. I have engaged Buying order on #3,318.80 Support once again and added more Buying orders on #3,321.80 / closed all before #3,327.80 and ultimately Sold again on #3,327.80 towards #3,318.80. Excellent Scalping opportunities throughout yesterday's session.
Technical analysis: Since the #3,318.80 breakout point was not compromised, the Price-action Naturally spiked to the #3,327.80 - #3,330.80 Resistance zone mentioned on the previous commentary. Based on the #5-session Higher High’s sequence, this zone is the new local High’s (very possible that Price-action is pricing a Top here, temporary or not) and as both the Hourly 4 chart and Daily chart are Neutral to a very great extent and does not look so good for Buyers (Gold is already critically Overbought within #3,340's, I should Naturally expect a correction within #1 - #3 session horizon. The Technical answer is the Hourly 1 chart’s Support near #3,327.80, which has been always touched after every Higher High’s rejection and holding as flood gate towards #3,322.80 and #3,318.80 wall of Support zones. Gold is kept Higher on pure Fundamental gradient and weak DX (on a parabolic downtrend) but this state has to end sooner or later and Gold should continue it’s Bearish trend and connect with the fair Technical Price around #3,300.80 mark or less. The turmoil with the Inflation in U.S. causing Investors turn to capital from riskier assets for protection (safe-havens in High demand such as Gold), thus causing Gold to gain value. Regardless, DX is the strongest correlation driving Gold at the moment. Fundamentally though Gold is Bullish and cannot overcome such patterns as it is overreacting to every DX and Bond Yields movements.
My position: I am currently Buying #3,332.80 Bottom (third Scalp this morning all closed on #3,335.80) and holding last one until #3,340.80 ideally and with that regardless what happens on U.S. opening, I will call it for the session and comfortably take early weekend break since I am Highly satisfied with my returns. Enjoy the Profits and have a great weekend!

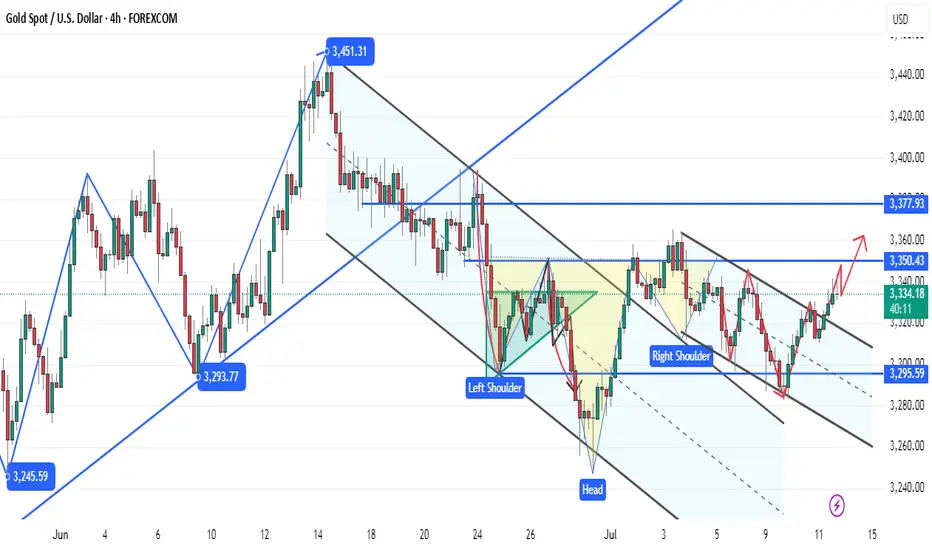
The gold bull-bear game intensifiesThe gold bull-bear game intensifies: a breakthrough opportunity is hidden in the short-term shock
The gold market experienced violent fluctuations this week, and the core contradiction came from contradictory employment signals:
ADP cooling: The number of private sector jobs in the United States unexpectedly decreased in June, which once strengthened the expectation of a rate cut in September and pushed the gold price up
Non-farm counterattack: The subsequent non-farm employment announced exceeded expectations (206,000), which quickly extinguished the enthusiasm for rate cuts and gold prices gave up gains
Central bank support: Global central banks continue to buy gold (China increased its gold reserves in June), building a safety cushion for long-term prices
The essence of the "data fight" reflects that the resilience of the US economy remains, but cracks have appeared. The Federal Reserve dares neither cut interest rates too early (inflation risk) nor over-tighten (loosening of the employment market). This swing state will prolong the volatility cycle of gold, but every sharp drop is an opportunity for central banks and long-term investors to enter the market.
Technical aspect: Breakthrough signal of the four-hour chart
Current market characteristics:
Key position: 3344-3346 area has become the watershed between long and short positions. After three unsuccessful tests, the probability of this breakthrough has increased
Morphological structure: Breakthrough of the downward trend line of the four-hour chart + MACD golden cross, long arrangement of hourly moving average
Volume coordination: After yesterday's retracement to 3330 support, the volume rebounded, showing strong low-level support
Operation strategy:
Bull defense line: 3330-3325 (if broken, it will turn into shock)
Upward target:
▶ The first target is 3360 (previous high psychological position)
▶ The second target is 3380 (Fibonacci extension position)
▶ Ultimate target 3400 (option barrier)
Specific plan:
Conservatives:
Light long position at 3333-3335 (stop loss 3323)
After breaking through 3347, add more positions (stop loss 3335)
Radicals:
Batch layout above the current price of 3340, with 3325 as the ultimate defense
Risk warning:
⚠️ Beware of the volatility caused by Powell's speech on Friday night
⚠️ If 3320 is lost, beware of a deep correction to the 3300 mark
Currently, gold is in the "accumulation breakthrough" stage, with a bullish technical side but requiring fundamentals to cooperate. It is recommended to use the "small stop loss breakthrough" strategy, and it is better to miss it than to go against the trend. If it can stand firm at 3350 this week, it will no longer be a fantasy to look at 3400 in the third quarter.
GOLD UPDATE – Key Supply Zone Reached📊 GOLD UPDATE – Key Supply Zone Reached
Price is currently reacting from the 3340–3341 supply zone. If this level fails to hold, next target will be the upper zone at 3350–3358.
🟥 Active Supply Zone: 3340–3341
🎯 Next Supply Zone Above: 3350–3358
🟩 Demand Support Below: 3310–3313
This is a crucial area — watch for rejection or clean breakout for directional bias.

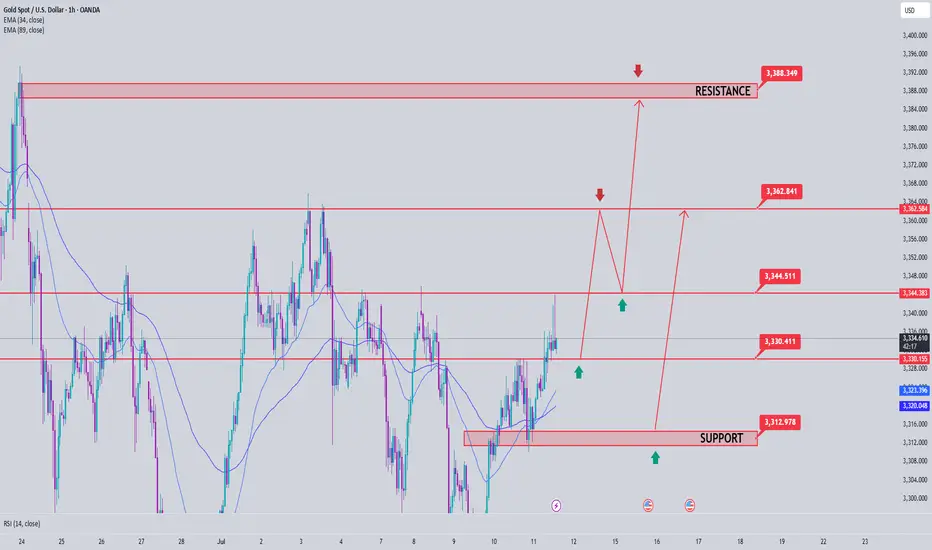
Gold Price Analysis July 11Gold price today continues to maintain a strong upward momentum after breaking the previous support trendline (gold wire). Currently, SELL orders should only be considered as short-term response transactions, with priority given to monitoring to join the main trend.
✅ Trend: Up has been confirmed, the nearest target is towards the 3390 area today.
🔑 Key Levels:
Support: 3330 – 3314
Resistance: 3345 – 3362 – 3388
🎯 Trading strategy:
SELL activation: Watch the 3345 area, only SELL when there is a price rejection signal with a confirmation of a decrease.
Potential SELL area: 3362 – 3387 (strong resistance).
BUY Activation: Look for buying opportunities at support 3330 – 3314 if there is a clear bullish reversal signal.
XAUUSD LONG/BUY 1:6RReason for buy
1. Break of structure
2. Corrective structure in play (Running flat)
3. Order block at 3299 levels (POI)
4. Impulsive wave up expected to complete the structure (Expanding flat)
Entry: 3299 (POI)
STOPLOSS: 3272
TAKE PROFIT:
1. 3372
2. 3408
3. 3460
4. 3500
Always use a STOPLOSS

Gold Market Mitigates 3280 – Eyes on 3330 PullbackAfter sustaining its bearish sentiment, the gold market mitigates the 3280 zone, creating room for a potential pullback to 3330. Current price action suggests a shift in structure could be forming, anticipating a bullish correction in the short term.follow for more insights , comment and boost idea

Gold price surge, today will have a decline✏️ OANDA:XAUUSD The recovery of the D1 candle and the closing candle above 3313 means that the market's downtrend has almost been broken.
The reaction at the current trendline 3284 is still very strong. The price is strongly supported by the buyers, causing gold to return to trading in a wide range.
The 3328 zone will be important in the near future. If it does not break, there will be a decline to the Gap price zone this morning. Trading according to the top-bottom method is suitable for the current market.
Support: 3312-3295-3279
Resistance: 3328-3339-3349-3363
Sell trigger: rejection from 3328–3,340 resistance block
Target: 3295 Support zone, followed by 3279 lower zone
Leave your comments on the idea. I am happy to read your views.

Gold Price Analysis July 10🔹 XAUUSD Analysis – D1
Yesterday's D1 candle showed a strong recovery, closing above 3313, thereby significantly weakening the previous downtrend structure. Currently, the price is reacting very strongly at the trendline around 3284. Buying pressure is clearly appearing, pushing gold back to trading in a wide range.
In the short term, the 3328 area will play an important resistance role. If the price cannot break this area, the possibility of a correction down to the Gap price area this morning is quite high. The peak-bottom trading method is still giving suitable signals in the current market context.
🔹 Important zones:
Support: 3312 – 3295 – 3279
Resistance: 3328 – 3339 – 3349 – 3363
💡 Strategy:
Confirm the trading signal when the price clearly rejects the resistance zones to ensure the highest winning rate.

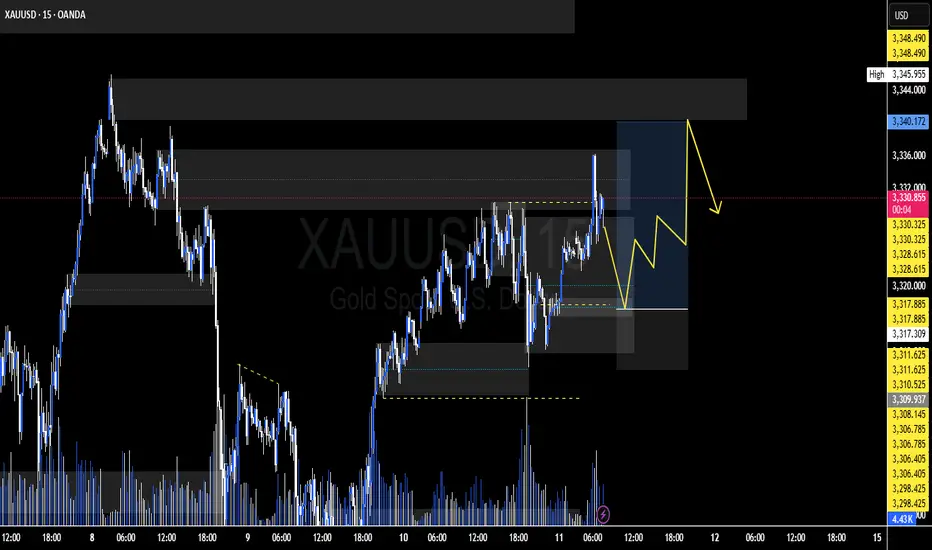
Gold – July 11 | H4 & M15 Aligned, Higher Highs in Sight🟡 Gold – Higher Highs in Sight | July 11 Analysis
As outlined in our July 10 analysis
( Gold – H4 OB Held, BoS Confirmed ),
price retested the 3313–3310.5 POI and continued upward in alignment with the broader bullish structure.
Gold is now trading around 3330–3335 , and both H4 and M15 remain in clear uptrends — forming a consistent sequence of higher highs and higher lows .
This post is intended purely for educational and structural observation —
not as trading advice or encouragement to enter trades.
Please use your own strategy, confirmation methods, and risk assessment before taking any action.
🔄 Structure Alignment
✅ H4: Bullish continuation
✅ M15: Trend aligned, forming HH–HL structure
🟢 Bias: Long-only setups (based on structure)
🔍 Key Supply & POI Zones
📌 3345–3346:
→ Strong supply zone
→ If price breaks above, we expect a new higher high
📍 If retracement occurs before breaking 3346:
→ Watch 3319.5–3321.5 (M15 POI)
→ Valid only if respected with M1 confirmation (ChoCh + BoS)
🎯 Trade Plan (Educational Observation)
🛑 No shorts — structure does not support counter-trading
🕒 Monitor: For price to revisit the 3319.5–3321.5 zone
✅ If respected + M1 confirms → structure favors long
🎯 Target: Move above 3346 , continuing the bullish sequence
🧠 Final Thoughts
Price structure remains in strong alignment — but the key is confirmation, not prediction.
Wait, observe, and only act within your own defined process.
📖 Trade the structure, not the emotion.
When the trend aligns, hesitation costs more than waiting.
📘 Shared by @ChartIsMirror

XAUUSD (GOLD) – 1H Analysis – Smart Money ConceptPrice is currently reacting around the 1H bearish order block (OB) within the supply zone near $3,300 – $3,320. We expect a short-term bullish retracement into this premium zone before a potential bearish continuation toward our Point of Interest (POI) at the green demand zone ($3,245 – $3,260).
📌 Two scenarios in play:
Sell from current supply zone ($3,300–$3,320) → First TP near $3,265 → Final TP at $3,250.
If price breaks above, next entry is at higher supply zone ($3,340–$3,360) for a deeper sell.
⚠️ Watch for price reaction around the POI (Demand Zone) for potential bullish setup later in the week.
🧠 Smart Money Concept (SMC) in play:
Supply zone respect
BOS/CHOCH confirmed
POI (Demand) targeted
FVG/Imbalance below being filled
📅 NFP & CPI events this week – expect increased volatility.

GOLD (XAUUSD): Time to Recover?!
Gold reached an important rising trend line on a daily.
I see 2 nice intraday bullish reactions to that on a 4H time frame
and a double bottom pattern formation.
Its neckline breakout and a 4H candle close above 3309
will confirm a start of a bullish correctional movement.
Goal will be 3327.
Alternatively, a bearish breakout of the trend line will push
the prices lower.
❤️Please, support my work with like, thank you!❤️
I am part of Trade Nation's Influencer program and receive a monthly fee for using their TradingView charts in my analysis.

XAU / USD 30 Minute ChartHello traders. My last chart for the day / night. I have marked my potential area of interest for scalp buy / sell trade set ups. I am just waiting until tomorrow to see how the overnight sessions play out. Big G gets a shout out. Be well and trade the trend. Dont' get caught range trading, wait for a break and retest. Thank you so much if you enjoy the posts / analysis'.

XAUUSD Possible MoveBuyers and Sellers remained in fight yesterday and finally buyers took the charge and today the gold has taken previous day high which was on 3330. It now can go to take the swing high which is residing on 3345. Or it may touch supply zone retraces back previous S&R level.

Gold price drops to 3250Today's daily line is in the negative, rebounding in the morning, and the high point yesterday morning was 3310, and the bearish point is also at this point. It is higher than the 382 line of yesterday's decline and rebound, 3307. After the morning rebound, the current decline formed a morning downward trend. The watershed is 3308-10, today's short stop loss position. The market fell in the morning, and the strength of the rebound should not be strong. The top and bottom conversion position is 3297-98. The European session broke the bottom, and the US session continued to fall. The next double bottom support is around 3275. If the rebound is in place, it is still bearish, and the decline continues. 3258-60 line.

Gold Under Pressure as Dollar Strengthens – Watch Below 3297FX:XAUUSD – Technical & Fundamental Outlook
Gold prices declined on Monday, pressured by a stronger U.S. dollar following President Trump’s announcement of a potential 10% tariff on BRICS-aligned countries. The news supported the dollar and weakened demand for gold as a safe-haven asset.
Although uncertainty remains around U.S. trade negotiations ahead of the July 9 tariff deadline, signals of possible extensions and staggered implementation have further reduced short-term haven flows into gold.
Technical View:
Gold remains under bearish pressure while trading below 3320.
As long as the price stays under this level, we expect sideways consolidation between 3297 and 3320 until a breakout occurs.
A 1H close below 3297 would confirm bearish continuation, targeting 3281 and 3255.
A break above 3320 would invalidate the bearish outlook and shift momentum toward 3342.
Pivot: 3297
Support Levels: 3281 / 3255 / 3239
Resistance Levels: 3314 / 3320 / 3342
Previous idea: Click Here...


Gold is in the Bearish DirectionHello Traders
In This Chart GOLD HOURLY Forex Forecast By FOREX PLANET
today Gold analysis 👆
🟢This Chart includes_ (GOLD market update)
🟢What is The Next Opportunity on GOLD Market
🟢how to Enter to the Valid Entry With Assurance Profit
This CHART is For Trader's that Want to Improve Their Technical Analysis Skills and Their Trading By Understanding How To Analyze The Market Using Multiple Timeframes and Understanding The Bigger Picture on the Charts
