CFDGOLD trade ideas

Gold Finds Supports – Is the Rebound About to Begin?Gold ( OANDA:XAUUSD ) declined to the Support zone($3,312-$3,290) and Support lines as I expected in the previous idea .
Gold is currently trading in the Support zone($3,312-$3,290) and near a set of support lines .
In terms of Elliott Wave theory , it seems that Gold has completed the Zigzag Correction(ABC/5-3-5 ) and we should wait for the next 5 impulse waves . One of the confirmation signs of the end of these corrective waves could be the break of the resistance line .
I expect Gold to trend higher in the coming hours and rise to at least $3,343 AFTER breaking the Resistance line .
Second Target: $3,364
Note: Stop Loss (SL) = $3,287
Gold Analyze (XAUUSD), 1-hour time frame.
Be sure to follow the updated ideas.
Do not forget to put a Stop loss for your positions (For every position you want to open).
Please follow your strategy; this is just my idea, and I will gladly see your ideas in this post.
Please do not forget the ✅ ' like ' ✅ button 🙏😊 & Share it with your friends; thanks, and Trade safe.

XAU / USD 30 Minute ChartHello traders. My last chart for the day / night. I have marked my potential area of interest for scalp buy / sell trade set ups. I am just waiting until tomorrow to see how the overnight sessions play out. Big G gets a shout out. Be well and trade the trend. Dont' get caught range trading, wait for a break and retest. Thank you so much if you enjoy the posts / analysis'.

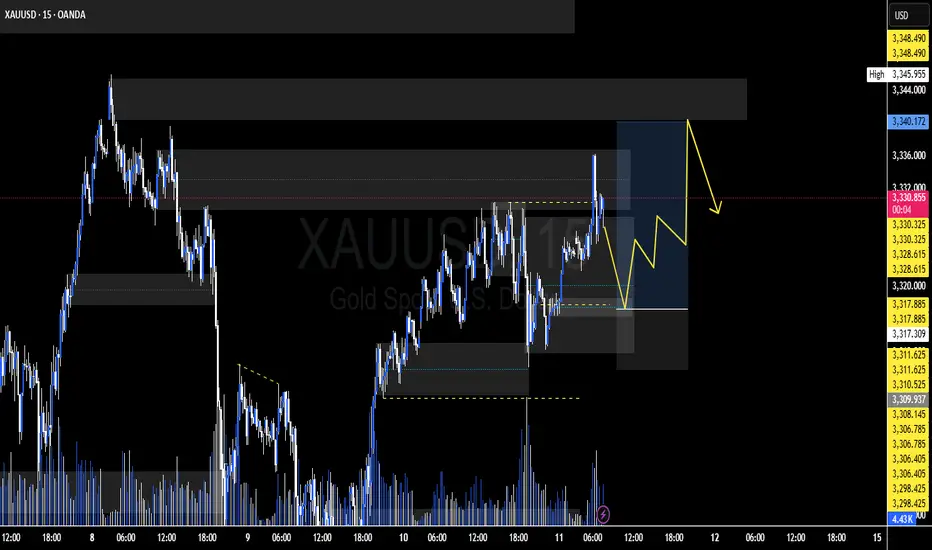
XAUUSD Possible MoveBuyers and Sellers remained in fight yesterday and finally buyers took the charge and today the gold has taken previous day high which was on 3330. It now can go to take the swing high which is residing on 3345. Or it may touch supply zone retraces back previous S&R level.

Gold’s Trap Above QML: Bearish Play UnfoldingHello Guys!
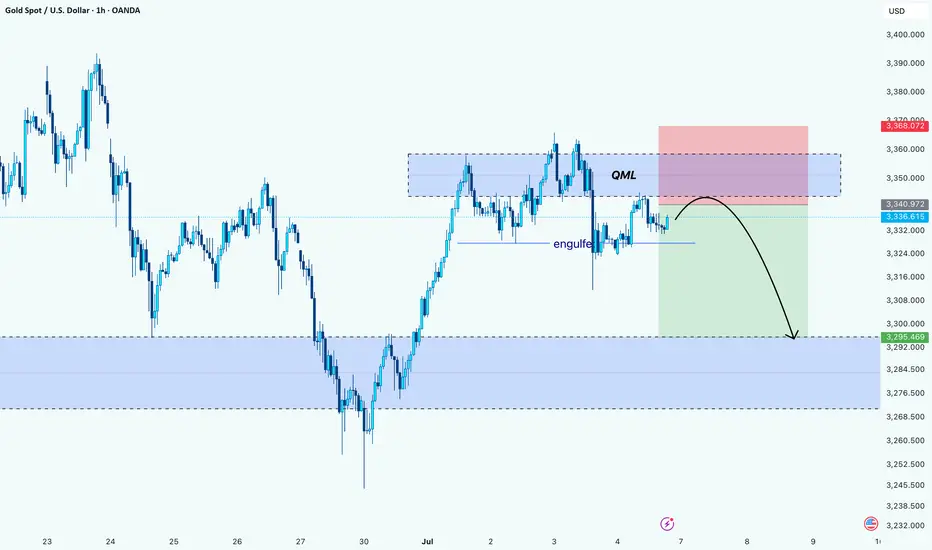
Gold appears to be forming a textbook Quasimodo reversal setup after printing a lower high into a key supply zone. Price aggressively tapped into the QML area (around 3,350–3,360), where sellers previously stepped in, and we’re now seeing signs of rejection.
The engulf zone marked earlier confirms bearish intent. It broke structure and flipped momentum. Price is currently retesting below that engulf level, likely as a last attempt to grab liquidity before heading down.
The projected move suggests a drop toward the next significant demand zone around 3,295–3,285, where the price previously found a strong bullish reaction.
Bias: Bearish below QML
Target: 3,295 zone
Invalidation: Above 3,368 (high of supply zone)
Focus on the Fed meeting minutesFrom a technical perspective, the trend of gold is obviously weak. In the morning trading yesterday, the price of gold failed to continue the previous day's rise, and the rebound high kept moving down. After breaking the key support level during the US trading session, it accelerated downward, and the daily line closed with a big negative line, and the short-selling force had the upper hand. Today's closing situation is crucial. If it continues to close with a negative line, the short-term downward trend may be established. The minutes of the Federal Reserve meeting will also bring new variables to the gold market. The policy direction may further affect the trend of gold prices. At present, the upper resistance is 3303-3308, and the lower support is 3284-3278. It is recommended to do more on the callback.
Operation strategy: It is recommended to do more on the callback of 3280-3275, with a target of 3295-3307 and a stop loss of 3370.

Gold is in the Bearish DirectionHello Traders
In This Chart GOLD HOURLY Forex Forecast By FOREX PLANET
today Gold analysis 👆
🟢This Chart includes_ (GOLD market update)
🟢What is The Next Opportunity on GOLD Market
🟢how to Enter to the Valid Entry With Assurance Profit
This CHART is For Trader's that Want to Improve Their Technical Analysis Skills and Their Trading By Understanding How To Analyze The Market Using Multiple Timeframes and Understanding The Bigger Picture on the Charts

Gold Intraday Trading Plan 7/7/2025As expected yesterday, gold attempted to break 3330 for a few times but failed to do so. After retreat to 3310, it went up again. Right now it is testing the channel top. I will monitor the price closely at this level and the 4hrly close. If it close above 3330, I will buy towards 3365. If it close below 3317, I will sell towards 3270.

Golden Trap: Bulls Exhausted, Bears Ready to StrikeToday, the gold market is in a stalemate between long and short positions, with the market fluctuating sideways for a long time and maintaining an overall volatile trend. Although the rebound of gold has won a respite for the bulls, the rebound of gold during the day is not enough to completely reverse the decline. I think that before the 3325-3335 area is stabilized, the bears still have spare power to dominate the market!
According to the current structure, although gold rebounded again after touching 3310 during the retracement, it has retreated many times during the rebound. The candle chart is interspersed with obvious negative candle charts, indicating that the rebound strength is weak. In the short term, it is under pressure in the 3330-3340 area, and it is difficult to break through in a short time.
So I think the role of the gold rebound may be to trap more buyers, so we try not to chase gold after the rebound. The area near 3310 is not a key support in the short term. 3305-3300 is the current key support area. Once the bears regain control of the situation, gold may test the 3305-3300 area again. Once it falls below the reformed area, it may test 3280 again, or even refresh the recent low to around 3270.
So the downward potential of gold is not over yet. We can still look for opportunities to short gold in the 3325-3335 area and look at the target 3305-3295 area.
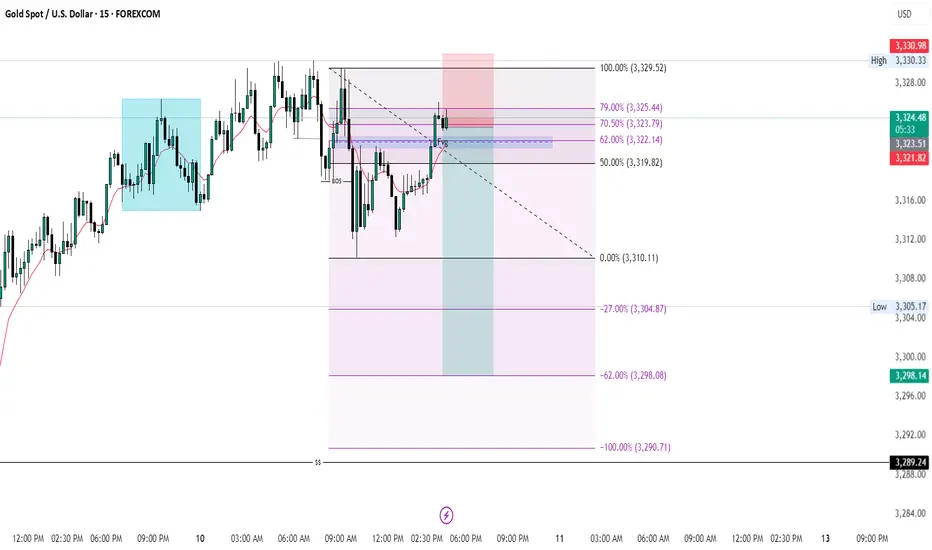
XAUUSD SELLWe had a market structure shift (MSS) followed by a break of structure (BOS), then a second BOS that triggered a retracement into the Fibonacci Optimal Trade Entry (OTE) level, forming a swing high — an ideal setup to go short.
XAUUSD Trading Strategy – July 8, 2025Gold (XAUUSD) is trading around 3,331 USD as global markets react to a series of critical economic data releases. The recent rally has brought prices back to a key resistance zone, but selling pressure remains strong due to the following factors:
- The Dollar Index (DXY) TVC:DXY holds steady near 97, its highest level in five weeks. A strong USD continues to weigh on gold, a non-yielding asset.
- U.S. 10-year Treasury yields remain stable at 4.35%, reinforcing expectations that the Federal Reserve will maintain higher interest rates for longer to tame inflation.
- Robust U.S. labor market data and June’s Core PCE figures staying above the Fed’s 2% target further reduce the likelihood of a rate cut in Q3 or Q4.
- Geopolitical tensions remain muted, with no significant escalations in the Russia–Ukraine conflict or Middle East unrest, weakening gold’s safe-haven appeal.
➡ Collectively, these factors suggest that gold’s recent rebound could be a technical pullback within a broader downtrend, unless a new catalyst drives a breakout.
1. XAUUSD Technical Analysis – Daily Chart (D1)
Price is currently testing the 3,331 – 3,340 USD resistance zone, which includes:
A previous supply zone that has rejected multiple rallies.
- Fibonacci retracement 0.5–0.618 from the recent high at 3,405 USD.
- A key Change of Character (CHoCH) area, where trend reversals have previously occurred.
- EMA20 and EMA50 remain aligned downward, confirming the dominant bearish trend.
- RSI hovers around 50 with signs of mild bearish divergence, reflecting weakening bullish momentum.
➡ The current price action fits a classic “sell on rally” setup, with repeated rejections at technical resistance zones.
2. Key Price Levels to Watch
Technical Significance
- 3,340 – 3,331 Confluence resistance (Fibo 0.5–0.618 + supply + CHoCH)
- 3,310 – 3,300 Nearest support – role reversal zone
- 3,275 – 3,260 Short-term target support – June’s low
- 3,223 – 3,205 Strong medium-term support – April’s low + extended Fibo
3. Suggested XAUUSD OANDA:XAUUSD Trading Strategy
Primary Strategy: SELL if price rejects 3,340 – 3,345
Entry: 3,340 – 3,345
Stop Loss: 3,356
Take Profit 1: 3,335
Take Profit 2: 3,330
Take Profit 3: 3,325
Ps : Gold is trading at a critical price zone. If XAUUSD fails to break above the 3,340 USD resistance, there’s a high probability of a pullback toward the lower support levels. Selling at resistance and targeting support remains the preferred approach in the current macro environment, which continues to favor bearish momentum.
This strategy will be updated regularly – save it and follow to avoid missing upcoming opportunities.
Analysis by @Henrybillion

Gold Trade plan 07/07/2025Dear Trader,
✅ Symbol: Gold vs. US Dollar (XAUUSD)
✅ Timeframe: 4H
✅ Date: July 7, 2025
✅ Technical Overview:
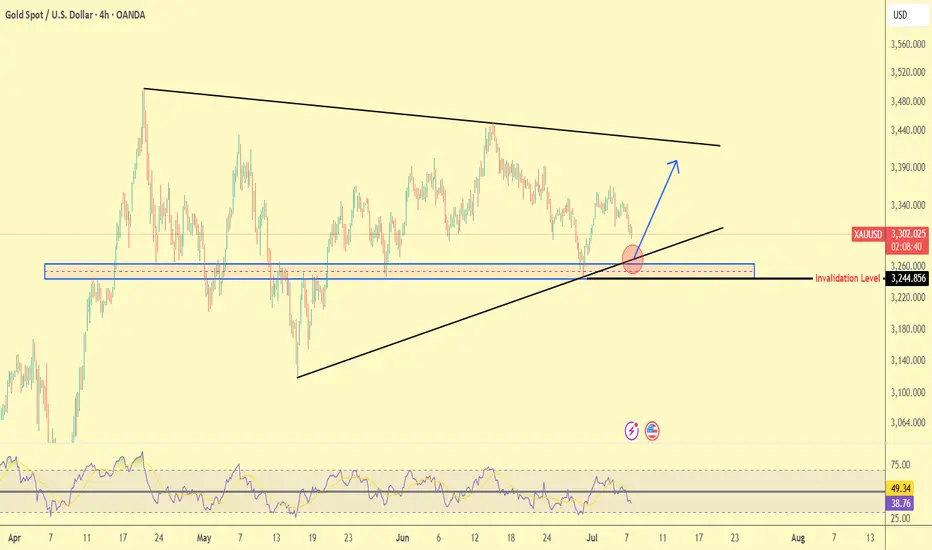
🔹 Price is forming a Symmetrical Triangle pattern.
🔹 A key support zone lies between $3245–3260, marked by the blue area.
🔹 Price has bounced from this zone and the ascending trendline (black), as shown by the red circle.
🔹 Main scenario: A potential bullish bounce toward the upper triangle resistance or even breakout (blue arrow).
🔻 Invalidation Level: $3,244.85
If this level breaks to the downside, the bullish setup will be invalidated, with possible targets at $3200 and $3100.
📉 RSI is currently between 38 and 49, not oversold yet, but near dynamic support.
✍️ Conclusion:
Holding above the current support area could trigger an upward move.
A break below $3245 would likely lead to further downside.
The current price area offers a favorable risk-reward for bullish positions.
Regards,
Alireza!
Gold Trade Plan 10/07/2025Dear Traders,
Technical Analysis of XAUUSD (Gold vs USD) – July 10, 2025
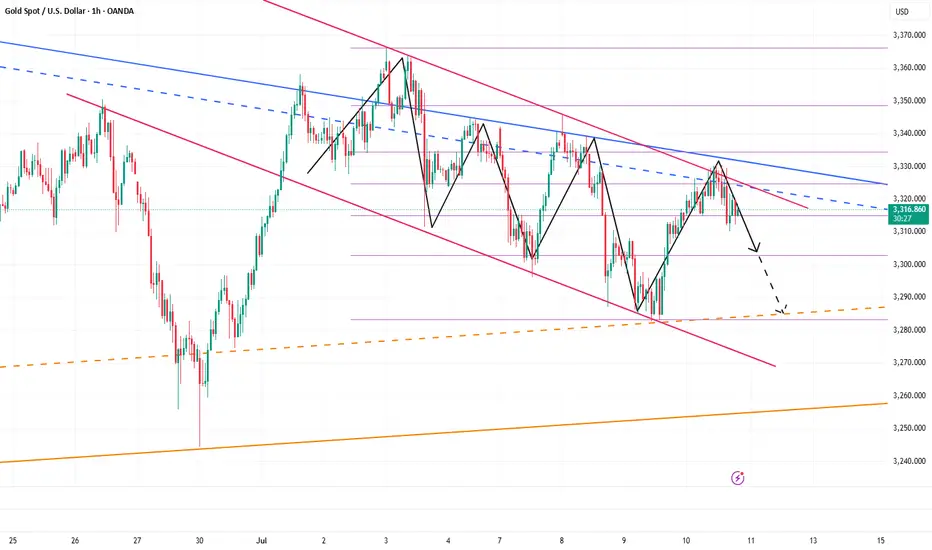
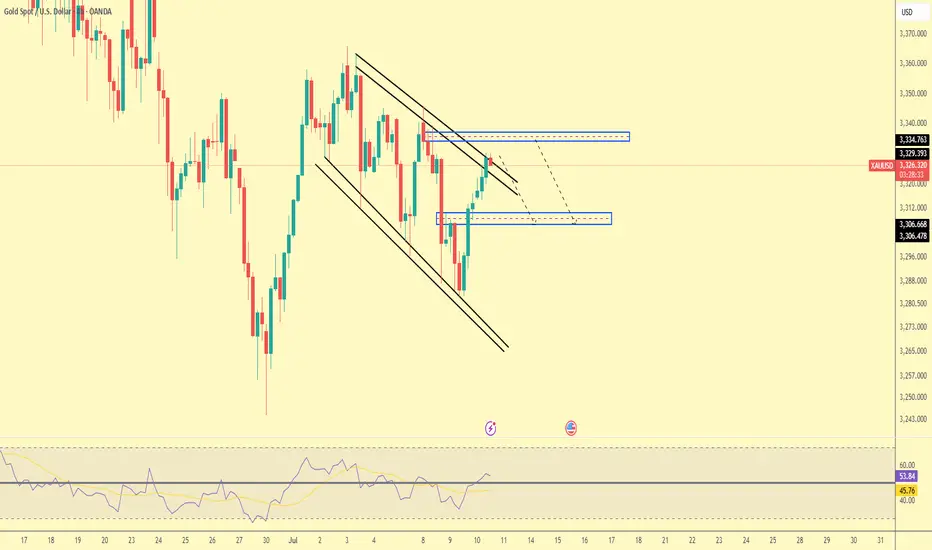
Price has recently broken out of a falling channel (black lines) and is now testing a key resistance zone (marked in blue):
Resistance Zone: 3329 to 3334 – price is reacting to this area, and it might reverse downward.
Support Zone: 3306 – if price declines, this is a potential target.
📉 Possible Scenario:
If price gets rejected from 3329–3334, it may head back down toward the 3306 support zone.
If price breaks and holds above 3334, the bullish trend could continue.
📊 The RSI is around 54, in neutral territory. No major divergence is seen, but the move out of oversold territory suggests growing buyer strength.
Regards,
Alireza!
XAUUSD Elliot waves update: What to expect?Bullish bias is still on. Price made impulsive wave 1 of lower degree and now we should expect price to continue up to test the upper trend line. There is also a possibility that the 4th wave is still in play and a possible triangle is about to be finished, however, this does not change our current bias to the upside. I am expecting price to drop to test the extreme order flow before continuing. To take advantage of the bullish move one need to find the entry around this extreme order flow marked with a rectangle. "Trade responsibly, this is not financial advice"

XAUUSD ShortMarket Structure
• Price has formed a clear lower high structure following the peak near 3360–3365.
• Subsequent highs (highlighted in blue circles) show consistent failure to break previous highs, indicating bearish momentum.
• The price is currently reacting from a well-defined supply zone (red box near 3325–3330), where selling pressure previously emerged.
Key Resistance Zones
• 3325–3330: This supply zone has held strong multiple times. Price failed to break above this area during the latest retest.
• 3340–3345: Previous support turned resistance, also aligns with a prior lower high.
• 3360–3365: Major resistance and recent swing high (bearish market invalidation point).
Support Zones to Target
• 3305.475: Minor support; price could consolidate here before further drop.
• 3280–3285: Key demand zone where price previously bounced.
• 3263.855: Major support level and likely final target in the short term if bearish move continues.
Confluences Supporting a Sell
• Series of lower highs (bearish structure).
• Strong supply zone rejection.
• Bearish engulfing candles around resistance.
• Clean liquidity sweep above prior highs followed by sharp rejections.
• Arrow on chart suggesting bearish projection.
Risk Consideration
• A break and strong close above 3335 would invalidate this bearish setup.
• Watch out for possible whipsaw behavior around 3305 zone before continuation.

Gold bottomed out and rebounded to fluctuateGold, the price opened at 3342 in the morning and then fell back. The article emphasizes the bearish structure of the 4H chart, and the bearish trend continued to 3311-3295 in the afternoon; the actual price fell to 3296 and then rebounded in the evening, and the 4H chart closed at 22:00 and turned into a big positive, and it will rebound and fluctuate at night;
Short-term support 3306-3300, strong support 3296; short-term resistance 3322-3326, strong resistance 3330-3340;

XAUUSDIf the closing price of gold today is higher than 3310, then gold will have the motivation to hit 3330 again on Friday.
Otherwise, once it continues to fall below 3310 and 3300, gold will reach around 3280 in the future.
Be patient and wait for the right entry position.
Repeated cycle, timing is keyMarket fluctuations are oscillating about 70% of the time, and only about 30% of the time are unilateral upward or downward, so accumulating small victories into big victories is the magic weapon for long-term success. What we need to do is to plan our positions well, and make this investment with a plan, direction, and guidance. A good trader will make your investment journey smoother. How to operate in a volatile market? The ancients said: Do not do good things because they are small, and do not do evil things because they are small. If we move it to financial management, it can be understood as: Don't be too greedy, enter the market in batches. When entering the market and covering positions, the position should be small. Although the profit is less, accumulating small victories into big victories is the key to success. The investment philosophy is composed of the investor's psychology, philosophy, motivation, and technical level. It mainly includes: stability, patience, independent thinking, discipline, trend, etc.
Judging from the current trend of gold, in the 4H cycle, it has touched 3330 many times under pressure, and the K-line has continuously closed with upper shadows, which is quite similar to yesterday's rhythm. So we must first look at the strength of the decline. The support below is at 3314 and 3306. In terms of operation, it should be treated as mainly long and auxiliary short. The upper pressure still focuses on the gains and losses of 3330.

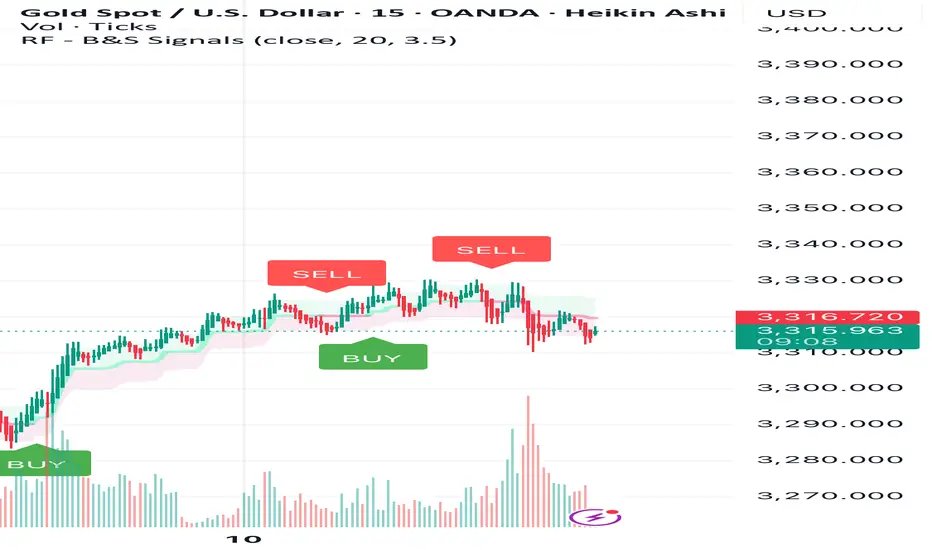
Gold Sideway DownGold Sideway down in TF M15 Because it did not break above the previous high price.

XAUUSD - Intraday SMC Bearish Setup | 15m ChartGold is currently reacting to a visible 15m supply zone after a bullish retracement. Price failed to break above the short-term supply (highlighted in red), showing signs of potential short-term reversal.
🔍 Key SMC Insights:
Supply Zone at 3318.47 – 3320 area is holding firm, with price showing clear rejection and lower highs forming.
Internal CHoCH already confirmed — suggesting short-term bearish order flow is active.
Liquidity Grab and rejection around the supply confirms smart money may be offloading positions.
Imbalance Below near 3303.96, with further inefficiency down to 3272.64.
📍Trade Idea:
Sell Entry: After a retest or failure to break above the 3318.47 zone.
Target 1: 3303.96 (near-term support and minor liquidity)
Target 2: 3272.64 (major liquidity zone + possible demand area)
Invalidation: Bullish break and close above 3320 would shift intraday bias.
⚠️ Monitor lower timeframes (1m–5m) for confirmation before executing trades. This setup aligns with the 4H bearish structure, enhancing confluence.

Short gold ,the downside potential is far from over.After we waited patiently for a long time, the gold bears finally showed signs of strength and began to fall as expected. Why do I insist on being optimistic about the gold retracement and wait patiently for it to retrace? !
In fact, it is very simple. Gold started to rebound from around 3283 and touched around 3330, which only recovered 50% of the decline. When facing the 50% retracement level, the bulls were unable to do so and could not stand above 3335, and could not even stabilize above 3330. The bulls' willingness was obviously insufficient. Then it can be determined that the gold rebound is only a technical repair of the sharp drop, and it cannot be completely regarded as a reversal of the trend. Then after a certain degree of repair, the gold bears will counterattack again.
Moreover, from the perspective of market psychology, the recent gold bull and bear markets have been discontinuous, and Trump often stirs up the gold market, making it difficult for the market to stand unilaterally on the bull side. Therefore, before gold stabilizes in the 3330-3340 area, there is limited room for rebound in the short term. Once gold falls below the 3310-3305 area again during the retracement, gold may test the area around 3280 again, or even around 3270.
So the above is why I insist on shorting gold, and I have shorted gold at 3320-3330 as planned, and patiently hold the position to see its performance in the 3310-3305 area, which is also the target area of our short-term short position.

Lingrid | GOLD Breakout of Trend Continuation PatternThe price perfectly fulfilled my last idea . FX:XAUUSD is forming a bullish base just above the upward trendline and key support near 3,310, showing signs of price compression within a flag continuation pattern. After the recent pullback, the market is holding structure and coiling for a potential breakout toward the 3,365 resistance. If price rebounds from the confluence zone, it would signal bullish continuation with upside momentum building.
📈 Key Levels
Buy zone: 3,305–3,310 support confluence
Buy trigger: break and close above 3,340 minor structure
Target: 3,365–3,370 resistance zone
Sell invalidation: break below 3,290
💡 Risks
Breakdown below the flag may turn structure bearish
Weak volume on breakout could result in fakeout
Resistance at 3,365 may reject price on first test
If this idea resonates with you or you have your own opinion, traders, hit the comments. I’m excited to read your thoughts!
