7/9: Focus on Selling Gold on ReboundsGood evening, everyone!
Apologies for the late update today—I had some matters to attend to. I hope your trades are going smoothly.
Yesterday, gold found support around 3284 and continued to rebound during today’s session, reaching as high as 3330. The key resistance at 3321 has now been broken and is currently acting as a short-term support level. However, based on the current price structure, this level is likely to be retested multiple times, and some consolidation may follow.
The next major resistance lies between 3337 and 3343. In the absence of strong bullish momentum, the preferred short-term strategy remains selling on rebounds, especially near resistance zones.
⚠️ Additionally, the U.S. Initial Jobless Claims data will be released during the New York session tonight, which may cause increased volatility and potentially whipsaw price action. Be cautious with position sizing, and avoid emotional trades or chasing price action during news releases. Patience and discipline will be key.
CFDGOLD trade ideas

$XAUUSD / Gold - Thursday July 10th OutlookYesterday’s price action gave us a clean 200 pip run from the break and retest of 3308, and today we’ve already caught 140 pips using yesterday’s high (3317.17) as intraday support.
But now we’re sitting at a critical inflection point.
📍 Key levels:
Safe Buys: Only looking to buy above Tuesday’s high of 3345.74, which gives room for a clean 200-pip move up toward last Thursday’s high.
Bearish Scenario: If we fail to break that high and instead break yesterday’s high of 3316.65, we may see a sharp 340 pip drop back down to 3282.83.
⚠️ Caution: The 4H bearish trendline from mid-June is still intact, and we're currently testing it. Wait for clear confirmation either way. Higher timeframes remain bullish, so we’re playing both scenarios carefully.

Gold - Sell before longer term buyLooking at gold we are a matter of a few pips away from entry. looking to play gold down till our larger 4H area of demand seeing as we have had a CHoCH to the upside.
There for i will be looking to take my sell position down to 3283.5 at a bare minimum as it was the previous structure level in which we turned around.
Lets see if we get tagged in. If not i will jump down to the lower TF and see if we can get a confirmation that price is going to turn from here.
Gold bottomed out and rebounded to fluctuateGold, the price opened at 3342 in the morning and then fell back. The article emphasizes the bearish structure of the 4H chart, and the bearish trend continued to 3311-3295 in the afternoon; the actual price fell to 3296 and then rebounded in the evening, and the 4H chart closed at 22:00 and turned into a big positive, and it will rebound and fluctuate at night;
Short-term support 3306-3300, strong support 3296; short-term resistance 3322-3326, strong resistance 3330-3340;

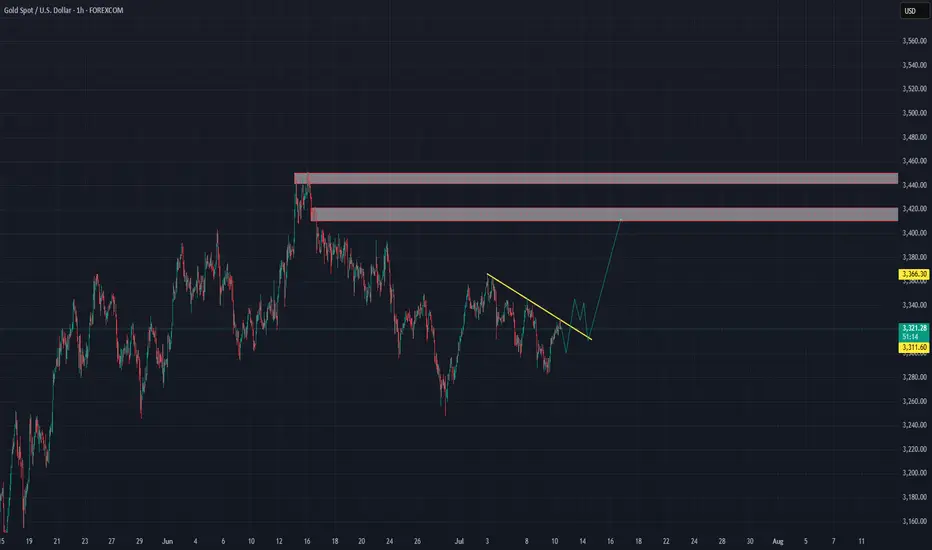
GOLD (XAUUSD): Important Decision Ahead
As I predicted, Gold went up from a trend line yesterday.
The price is now testing another trend line - a falling resistance
of a bullish flag pattern.
The next reliable bullish signal that you can look for is its
bullish breakout and a daily candle close above that.
A bullish move is going to follow then.
❤️Please, support my work with like, thank you!❤️
I am part of Trade Nation's Influencer program and receive a monthly fee for using their TradingView charts in my analysis.

GOLD Is Very Bearish! Short!
Here is our detailed technical review for GOLD.
Time Frame: 2h
Current Trend: Bearish
Sentiment: Overbought (based on 7-period RSI)
Forecast: Bearish
The market is approaching a significant resistance area 3,320.51.
Due to the fact that we see a positive bearish reaction from the underlined area, I strongly believe that sellers will manage to push the price all the way down to 3,298.54 level.
P.S
Please, note that an oversold/overbought condition can last for a long time, and therefore being oversold/overbought doesn't mean a price rally will come soon, or at all.
Disclosure: I am part of Trade Nation's Influencer program and receive a monthly fee for using their TradingView charts in my analysis.
Like and subscribe and comment my ideas if you enjoy them!

XAUUSD Trade Setup – 1H ChartGold is currently at a key decision point, testing a supply zone and descending trendline resistance within a falling channel. Two scenarios are in play:
(Bearish)
Price gets rejected from the current supply zone (3,325–3,330) and resumes the downtrend, targeting 3,275 and possibly lower.
This aligns with the trendline resistance and previous swing rejection.
(Bullish Breakout)
If price breaks and holds above the descending trendline and clears the 3,331 zone, we may see a rally toward the 3,360–3,365 supply zone and beyond.
A breakout retest would confirm continuation.
This is a flexible setup with both long and short potential depending on the reaction at the current zone.
Your comments and opinions are welcome
#XAUUSD #Gold #PriceAction #TradeSetup #ForexIdeas #TechnicalAnalysis

Gold 1H analysisFX:XAUUSD
From what I see, this bullish flag is likely to form and the price will move to higher base.
Don’t be too optimistic, gold may change its face at any time!Gold continued to rebound to around 3320, and it seems to have completely stood above 3300. The bulls are recovering. Should we chase gold in a big way? In fact, due to the disruption of news such as the Federal Reserve's interest rate decision and tariffs, the gold market has clearly shown the characteristics of frequent switching between long and short positions and discontinuity between long and short positions. Therefore, even if gold rebounds to a certain extent, it is difficult for the market to stand unilaterally on the bull side.
In the short term, gold began to retreat from around 3366, reaching a minimum of around 3283, with a retracement of $83; and currently it has only rebounded from the low of 3283 to around 3320, and the rebound is even less than 50%. Gold bulls are not as strong as imagined; although gold continues to rebound, before regaining the 3325-3335 area, it can only be regarded as a technical repair of the sharp drop, and cannot be completely regarded as a reversal of the trend. So after the rebound of gold, gold bears may counterattack strongly at any time.
Therefore, in short-term trading, after gold rebounds, you can consider shorting gold with the 3325-3335 area as resistance, and the first entry area worth paying attention to is 3320-3330.

Gold Holds Above $3,300 Amid Trade Policy UncertaintyMacro approach:
- Gold traded defensively this week, consolidating above the $3,300 level amid shifting risk sentiment and anticipation of significant trade policy developments. The yellow metal's performance was pressured by a firmer US dollar and easing geopolitical tensions, as optimism around potential trade deals and tariff suspensions reduced safe-haven demand.
- Market drivers included resilient US economic data, the Fed's cautious stance on rate cuts, and ongoing trade negotiations. The 9 Jul deadline for suspended US tariffs and President Trump's threats of new levies on BRICS countries kept investors on edge, while the release of FOMC minutes and strong NFP further dampened expectations for imminent Fed easing. Despite these headwinds, underlying concerns over US fiscal deficits and global policy uncertainty supported Gold's longer-term appeal.
- Gold may remain volatile as markets await clarity on US trade policy and the 15 July US CPI release. Both could influence Fed rate expectations and risk appetite. Any escalation in trade tensions or disappointing economic data could revive safe-haven flows into Gold.
Technical approach:
- XAUUSD consolidated within a tight range of 3285-3560, just lightly above the ascending channel's lower bound. The price is at EMA21, indicating that a bullish momentum is still intact. The market is waiting for an apparent breakout to determine the trend.
- If XAUUSD breaks above 3560, the price may retest the following resistance at 3430.
- On the contrary, closing below support at 3285 may allow Gold to retest the following support at 3165.
Analysis by: Dat Tong, Senior Financial Markets Strategist at Exness

Gold bullish setup "Gold Buy Setup: Price is bouncing off key support at ,3333/3335 with a potential bullish reversal in play. Buying opportunity on the horizon
Gold buy level 3333/35
First target 🎯. 3338
Second target🎯 3342
Third target 🎯 3347
Guys leave comment what you think about this setup

Gold (XAUUSD) Analysis : Bullish Structure Setup + Target🧠 Gold (XAUUSD) Technical Analysis
Gold has recently been trading within a clearly defined descending channel, which has governed price action over the past several sessions. This structure is characterized by a series of lower highs and lower lows, forming well-established channel resistance and channel support levels. However, recent bullish pressure has led price to aggressively test the upper boundary of this channel, signaling the potential for a structural breakout.
We are now at a technical inflection point, where a successful breakout and retest could mark the beginning of a significant trend reversal and short-to-medium term bullish move.
🔍 Key Technical Levels & Zones
🔷 Channel Resistance (~3,325)
The price is currently testing the descending trendline acting as channel resistance.
This area has previously rejected price several times, increasing its significance.
A confirmed break and close above this level may shift the market bias from bearish to bullish.
🔷 Central Zone – Dual Demand (~3,325–3,330)
This horizontal zone intersects with the channel resistance and aligns with two previous demand zones, now acting as a key decision area.
The market must validate this zone as new support before any sustained upward movement can occur.
🔷 Next Reversal Zone – Target (~3,370)
The next major area of interest lies around 3,370, a zone identified by previous swing highs and visible liquidity pools.
This level is likely to act as a magnet for price if bullish structure is confirmed.
📈 Price Structure Outlook
The potential breakout is supported by a strong bullish impulse off the channel support, followed by a series of higher lows suggesting growing bullish momentum. The projected movement scenario is as follows:
Break above the channel resistance
Retest and confirm the central zone as support
Continuation toward the 3,370 reversal zone
This would complete a classic break–retest–continuation pattern.
✅ Trade Considerations (Not Financial Advice)
Entry Type Entry Condition Target Stop Loss
Aggressive Break & 2H close above 3,330 3,370 Below 3,320
Conservative Retest & bullish confirmation above 3,325 3,370 Below 3,310
Risk Management:
Use position sizing aligned with your risk tolerance (max 1–2% per trade).
Monitor volume closely during breakout and retest for confirmation.
⚠️ Invalidation Scenario
If price fails to break above the channel and is rejected strongly, especially with a bearish engulfing or long upper wick, the downside could resume. In such a case, price may revisit the channel midline or even the lower boundary around 3,290.
📝 Summary
Gold is at a critical juncture, testing long-standing channel resistance.
A break above and successful retest of the 3,325–3,330 zone could lead to a rally toward 3,370.
This setup reflects a potential shift in structure from bearish to bullish on the 2H timeframe.

Will gold continue to rise if it accelerates its decline?Technically, we need to focus on the key support of 3260 and the strong resistance range of 3320 above. The hourly chart shows that the short-term moving average diverges downward, and the K-line is under pressure, showing short-term fatigue, suggesting that there is still a need for a correction. The current long-short watershed is at the 3390 mark. If the gold price cannot effectively break through and stand above 3315, the short-term rebound can be regarded as a good opportunity to enter a short position. The 4-hour chart shows that the gold price has received support after touching 3287 and slowly repaired the decline, but it is still in a volatile pattern in the near future. Although the 3287 support is effective, the oscillation range has not been broken. The future direction needs to pay attention to the actual defense strength of the 3260 support level and the direction of the range break. The operation suggestion on Wednesday is to rebound high as the dominant strategy. The upper resistance area focuses on the 3315-3320 range, where short positions can be arranged. The downward targets are 3270 and the key support level 3260. If 3260 is effectively broken, it may open up a larger downward space.

GOLD for a further bullish momentum.GOLD internal structure to bullish after a confirmation of the breaking of the supply zone to confirm the increase in the buyers overcoming the sellers

DeGRAM | GOLD forming head and shoulders📊 Technical Analysis
● A double rejection at 3 358—confluence of the May-July descending trend-line and the long-term channel roof—has carved successive lower highs; the break of the inner up-trend (circled) shifts structure bearish.
● Price is now slipping out of a contracting pennant; sustained trade beneath 3 246 (pattern base / April pivot) exposes the mid-channel magnet at 3 202, with the outer rail projecting 3 121.
💡 Fundamental Analysis
● Surprise rise in NY Fed 1-yr inflation expectations and Daly’s “no urgency to cut” remarks lifted 2-yr real yields and the DXY, while ETFs saw a fifth straight day of outflows, signalling fading bullion demand.
✨ Summary
Sell 3 300–3 320; break below 3 246 targets 3 202 → 3 121. Short view void on a 4 h close above 3 358.
-------------------
Share your opinion in the comments and support the idea with a like. Thanks for your support!

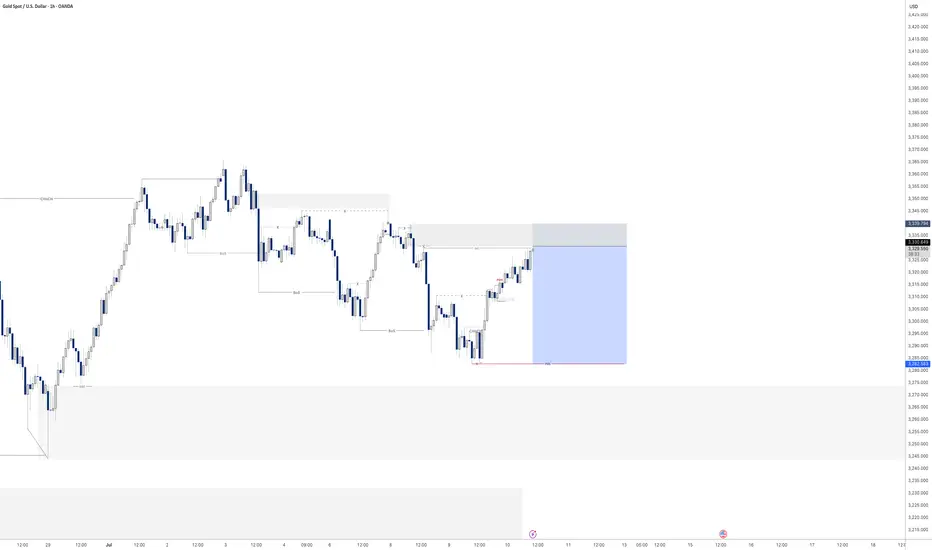
Tuesday Outlook on Gold (XAU/USD)
After Monday’s move into the 4H Fair Value Gap and rejection near the trendline and Asia High, I’m expecting a corrective move to start Tuesday.
I’m currently watching two possible downside targets:
🔸 Scenario 1: A short-term drop into the upper part of the 4H FVG (around 3320–3310) – this zone could act as intraday demand and cause a quick bounce.
🔸 Scenario 2: A deeper retracement toward the unfilled imbalance around 3290–3280, lining up with the London Low and completing the 4H FVG.
This would be a more significant liquidity sweep before a potential bullish reaction.
From both zones, I’ll be looking for price action to confirm a possible long setup back toward the trendline and above.
Let’s see how Tuesday plays out.
