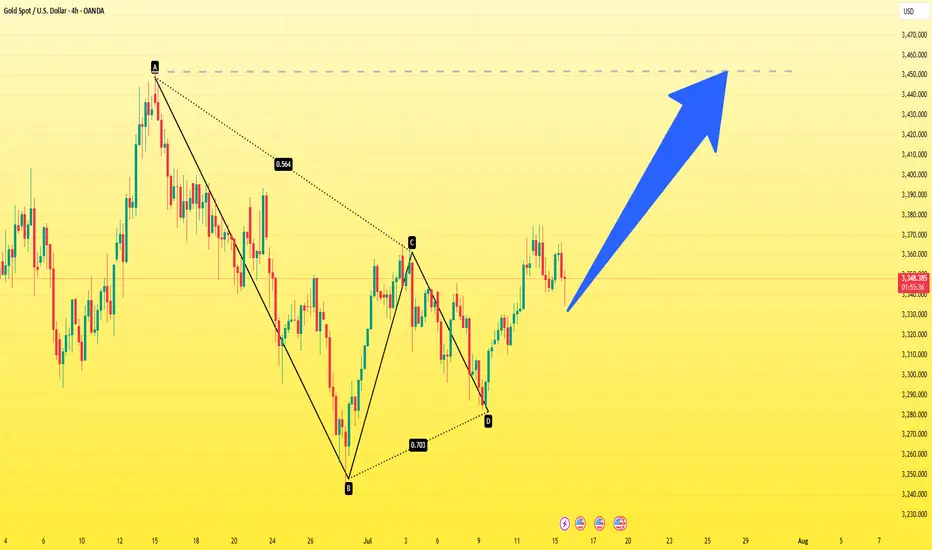
Gold is set to rise to a new all-time high!Gold has successfully broken above its descending trendline, signaling a potential shift in market structure and growing bullish momentum.
A pullback toward the broken trendline is now likely, as price may retest the breakout zone.
Once the pullback is completed, we anticipate a bullish continuation and a move toward higher levels.
As long as price holds above the identified support zone, the bullish outlook remains valid.
Will gold resume its rally after the pullback?
CFDGOLD trade ideas

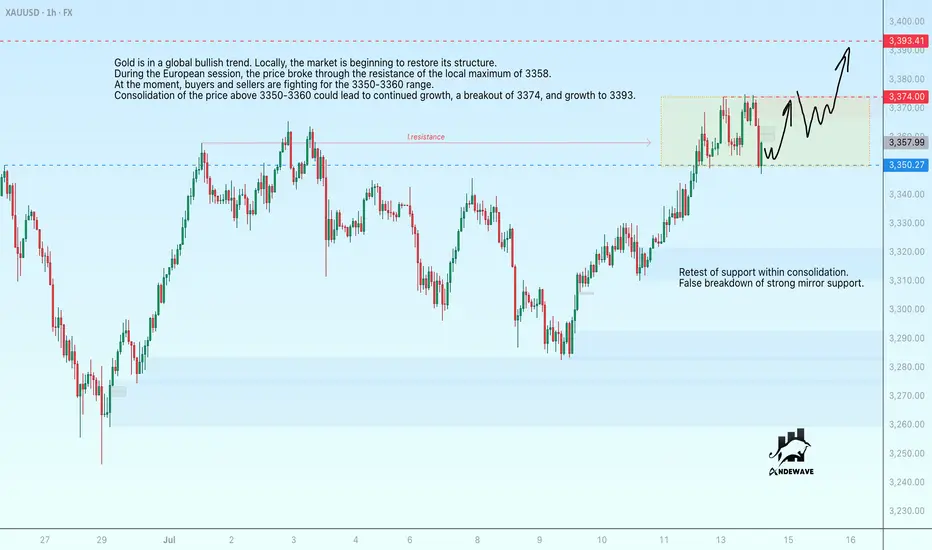
Gold looks set to rise to 3390Gold is in a global bullish trend. Locally, the market is beginning to restore its structure.
During the European session, the price broke through the resistance of the local maximum of 3358.
At the moment, buyers and sellers are fighting for the 3350-3360 range. Consolidation of the price above 3350-3360 could lead to continued growth, a breakout of 3374, and growth to 3393.
Scenario: Consolidation of prices above 3350–3353 could trigger growth to 3375. Further, a slight correction may form from resistance before a retest to break through the level and grow to 3393.
XAU/USD : Gold at a Turning Point – Rejection or Breakout Ahead?By analyzing the TVC:GOLD (XAUUSD) chart on the 4-hour timeframe, we can see that price climbed to $3330 today, entering a key supply zone, which triggered a pullback down to $3310. Gold is now trading around $3317, and I’m watching several potential setups closely.
Scenario 1:
If gold stabilizes below $3320, we could see a bearish move toward $3296.
Scenario 2:
If price breaks above the $3333 resistance, it may enter the next supply zone between $3341 and $3351, which could trigger a strong rejection—potentially offering a 100 to 400 pip move.
Now let’s break down the key levels to watch:
Supply zones: $3320, $3333, $3342, $3358
Demand zones: $3303, $3296, $3289, $3278
Monitor how price reacts to each of these zones — they may provide excellent opportunities.

sideways in weekend downtrend⭐️GOLDEN INFORMATION:
Gold prices (XAU/USD) struggle to extend Thursday’s recovery from the $3,309 region—a one-week low—consolidating within a tight range during Friday’s Asian session. The US Dollar (USD) continues to retreat from its peak since June 23, pressured by dovish signals from Federal Reserve (Fed) Governor Christopher Waller.
Additionally, growing concerns over US President Donald Trump’s unpredictable trade policies and their potential consequences for global growth are keeping investors cautious, supporting demand for the safe-haven metal. These factors collectively help limit deeper losses in Gold, though the metal lacks clear bullish momentum for now.
⭐️Personal comments NOVA:
Gold price is moving sideways, accumulating in the downtrend line, not much fluctuation in weekend news
⭐️SET UP GOLD PRICE:
🔥SELL GOLD zone: 3381- 3379 SL 3386
TP1: $3370
TP2: $3360
TP3: $3350
🔥BUY GOLD zone: $3293-$3295 SL $3288
TP1: $3308
TP2: $3318
TP3: $3330
⭐️Technical analysis:
Based on technical indicators EMA 34, EMA89 and support resistance areas to set up a reasonable SELL order.
⭐️NOTE:
Note: Nova wishes traders to manage their capital well
- take the number of lots that match your capital
- Takeprofit equal to 4-6% of capital account
- Stoplose equal to 2-3% of capital account

GOLD DISTRIBUTION TYPEHello folks. its been a while I am posting. Been dealing with this idea last week.
wait for a rally to 3344, if it breaks above 3351 then we still waiting below our main Entry 3280-3289 zone. less stoploss below the friday low.
Trade it swing if we see monday rally. then wait our entry.
Goodluck and have fun trading,
If trading is a lifestyle this is it.
this is your lifestyle.
waiting here is boring.
thats why we need to be more patience.
xiaaaaooo.

GOLD's narrowing range, tariffs, Trump's political dramaOANDA:XAUUSD is still trading in a narrowing range, affected by the tariff game and the political drama that Trump is building. Currently, the price of gold is trading around 3,339 USD/oz, equivalent to a small decrease of about 7 dollars on the day.
Tariff Game
On July 16, US President Donald Trump announced that he would send letters to more than 150 countries, with tariffs expected to be 10% or 15%, to promote trade. He said these countries are not major US partners and will be treated equally, but left open the possibility of negotiating exemptions. The tariffs are similar to those proposed in April but were postponed due to concerns about market volatility. The resumption of the tariffs continues to destabilize financial markets and surprised partners such as the European Union, as they hoped to reach an early agreement with the US.
Political Play
Also on July 16, global financial markets were shaken by rumors that President Trump intended to fire Federal Reserve Chairman Jerome Powell. Many major news agencies such as the New York Times, Bloomberg and Reuters reported that Trump had prepared a letter of dismissal and consulted with Republican lawmakers, receiving positive feedback. Removing Powell before his term was believed to undermine confidence in the US financial system and the safe haven status of the USD. Trump later denied the plan, saying it was unlikely to happen unless there was serious wrongdoing. Markets reacted strongly: the USD fell and then recovered after Trump's statement, while gold lost most of its previous gains by the end of the session.
The gold market in particular, and the financial economy in general, are being affected by the activities of Trump, the creator of the global trade war, and the plays of Trump and the FED leading the market. Therefore, the basic formula in the current market context is best to follow Trump, and make sure not to miss any of Trump's status lines.
Technical outlook analysis of OANDA:XAUUSD
On the daily chart, the technical structure has not changed with the trend not yet clear and the price action clinging to the EMA21.
The technical conditions do not favor an uptrend or a downtrend, typically the RSI moves around the 50 level, indicating a hesitant market sentiment.
On the upside, gold needs to achieve the condition of breaking above the 0.236% Fibonacci retracement level of the price point of 3,371 USD then the target level will be around 3,400 USD in the short term, more than 3,430 USD.
Meanwhile, on the downside, gold needs to break below the 0.382% Fibonacci retracement, which would confirm a loss of the $3,300 level, then target around $3,246 in the short term, more than the 0.50% Fibonacci retracement.
Intraday, the sideways trend of gold price accumulation will be noticed by the following technical positions.
Support: $3,310 – $3,300 – $3,292
Resistance: $3,350 – $3,371 – $3,400
SELL XAUUSD PRICE 3381 - 3379⚡️
↠↠ Stop Loss 3385
→Take Profit 1 3373
↨
→Take Profit 2 3387
BUY XAUUSD PRICE 3309 - 3311⚡️
↠↠ Stop Loss 3305
→Take Profit 1 3317
↨
→Take Profit 2 3323
downtrend, back to 3300 gold price⭐️GOLDEN INFORMATION:
Gold prices (XAU/USD) inch higher in early Asian trading on Wednesday, recovering part of Tuesday’s sharp decline to multi-day lows, though follow-through buying remains limited. Lingering uncertainty surrounding US President Donald Trump’s trade tariffs, combined with expectations that the Federal Reserve (Fed) will maintain elevated interest rates, continues to dampen risk appetite. This weaker market mood is providing modest support to the safe-haven metal.
Meanwhile, the US Dollar (USD) eases slightly after Tuesday’s surge to its highest level since late June, which is helping gold stabilize. However, persistent speculation that the Fed may delay rate cuts, following a slight uptick in US inflation, continues to bolster the greenback and could cap further gains in gold. Traders remain cautious and await today’s US Producer Price Index (PPI) release for clearer direction.
⭐️Personal comments NOVA:
Selling pressure, break 3340 downtrend line continues. Economic news is helping DXY recover
⭐️SET UP GOLD PRICE:
🔥SELL GOLD zone: 3381- 3383 SL 3388
TP1: $3370
TP2: $3360
TP3: $3350
🔥BUY GOLD zone: $3306-$3304 SL $3299
TP1: $3318
TP2: $3330
TP3: $3343
⭐️Technical analysis:
Based on technical indicators EMA 34, EMA89 and support resistance areas to set up a reasonable SELL order.
⭐️NOTE:
Note: Nova wishes traders to manage their capital well
- take the number of lots that match your capital
- Takeprofit equal to 4-6% of capital account
- Stoplose equal to 2-3% of capital account

XAUUSDIt seems that gold will continue its downward movement to the 3336 range after touching the 3366 price range.

Gold returns to 3500Refer to my previous trading idea. Gold retreated as expected. We almost caught the highest point of the day and shorted gold near 3365, and successfully hit TP: 3346, which enabled us to successfully profit 190pips in short-term trading, with a profit of nearly $10K, which is a good result in short-term trading.
Currently, the lowest point of gold in the retracement process has reached around 3335, which has fully released the short energy and vented the bearish sentiment in the market. All the bad news is out, which means good news! Although gold fell from 3375 to 3335, the retracement was as high as $40, but the rising structure has not been completely destroyed. The previous W-shaped double bottom support structure and the resonance effect of the inverted head and shoulder support structure still exist. As long as gold stays above 3325, gold bulls still have the potential to attack.
Moreover, after this round of retracement, the bearish sentiment of gold was vented, and the liquidity was greatly increased, attracting more buyers to actively enter the market. Gold may start a retaliatory rebound, and even touch 3375 again or even break through and continue to the 3380-3390 area.
So for short-term trading, I think we can try to go long on gold in the 3335-3325 area appropriately, first looking forward to gold regaining lost ground: 3350-3360 area, followed by 3380-3390 area.
I am a trader with 10 years of experience. I started from nothing and burned my account overnight. If you are a novice or your account is being burned, please contact me. I will give you free professional advice.
Gold Price Analysis July 17XAUUSD Analysis Today
The price has cleared the liquidity to the 3377 zone, then returned to trading within the triangle. The market is currently waiting for new momentum to determine the next trend.
✅ BUY Scenario
If the 3322-3323 zone continues to hold and there is a bearish rejection signal and confirmation of buying power, gold is expected to continue its uptrend towards the 3373 - 3400 zone.
❌ SELL Scenario
If the price breaks the 3321 support with clear selling pressure, it can extend the decline to 3285.
🔑 Key Level Today
Support: 3321 - 3323
Resistance: 3373 - 3400
💡 Strategy:
Watch the price reaction at the important support zone to decide the next action.
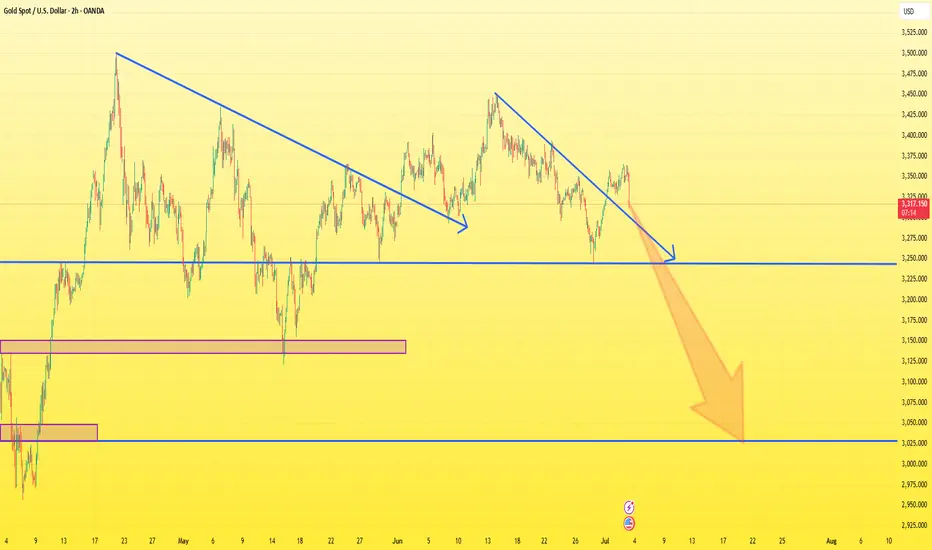
Gold will crash1. What happened yesterday
As expected, Gold started to rise after finding support at 3250. The move up played out perfectly, reaching the resistance area highlighted in yesterday’s analysis — around 3320–3340.
________________________________________
2. The key question today
Is this just a correction in a bearish trend, or the start of reversal?
________________________________________
3. Why I remain bearish
• On the weekly chart, structure still leans bearish
• On lower time frames, the bounce looks corrective — not impulsive
• No breakout above 3360 yet, which would be needed to shift the bias
• A move back below 3320 would likely trigger renewed selling
• If that happens, 3250 could be tested again quickly
We need to respect the bounce — but not overreact to it.
________________________________________
4. Trading plan
My bias remains bearish as long as price stays under 3360.
However, if we get a daily close above 3360, I’ll pause and re-evaluate the short bias. The market would then be signaling a potential trend shift.
________________________________________
5. Final thoughts 🚀
This is a key moment for gold. We’re at resistance zone but not broken above yet.
Until proven otherwise, the trend remains down — and rallies into 3340 zone should be considered selling opportunities.
Comments If you are new here, or your account is getting burned, please contact me. I will help you.
DeGRAM | GOLD above the resistance level📊 Technical Analysis
● Bulls defended the channel base at 3 333, snapping the intraday falling wedge and reclaiming the broken trend-line; successive higher-lows since 17 Jul signal fresh upside momentum.
● A clean H1 close over the former pivot 3 355 flips the wedge crest into support and activates the measured-move target at the upper horizontal barrier 3 366, with the March swing cap 3 389 next.
💡 Fundamental Analysis
● Softer US jobless-claims trend and Fed speakers’ hints that “policy is restrictive enough” cooled two-year real yields, while PBoC’s June data showed net gold purchases for a fourth month—both underpinning spot demand.
✨ Summary
Long 3 345-3 355; hold above 3 355 targets 3 366 → 3 389. Bias void on an H1 close beneath 3 333.
-------------------
Share your opinion in the comments and support the idea with a like. Thanks for your support!

DeGRAM | GOLD held the trend line📊 Technical Analysis
● Bulls defended the channel‐base 3 280 zone, breaking the six-week falling wedge and reclaiming 3 312; structure flips to higher-highs within the rising channel.
● A close above the wedge lip at 3 355 should unlock the grey range ceiling where the May trend-cap and 3 430 – 3 450 intersect. Pull-backs into 3 300-3 312 are expected to attract bids while the wedge retest holds.
💡 Fundamental Analysis
● US headline-CPI cooled for a second month, knocking 2-yr real yields to one-month lows and trimming Fed-cut timing, while PBoC data show June net gold purchases resuming—both reviving spot demand.
✨ Summary
Long 3 300-3 320; breakout >3 355 eyes 3 430 → 3 450. Invalidate on an H4 close below 3 280.
-------------------
Share your opinion in the comments and support the idea with a like. Thanks for your support!

Gold continues to be weak, but be careful about operations📣Gold prices fell 2% last Friday, hitting a near one-month low. Optimistic trade-related agreements boosted risk appetite and weakened the attractiveness of gold as a safe-haven asset. This week, the market will usher in a group meeting of major central bank governors around the world (Fed Chairman Powell, European Central Bank President Lagarde, Bank of England Governor Bailey, Bank of Japan Governor Kazuo Ueda, and Bank of Korea Governor Lee Chang-yong). The market will also usher in non-agricultural data. In addition, Powell's remarks on whether to resign may ignite the market this week. Gold prices may fluctuate more around the lower track of the Bollinger Band at $3,270/ounce this week.
Technical analysis:
Last Friday, the K-line had a lower shadow, and the Bollinger Band did not diverge. It is not easy to go short directly in operation, but wait for the rebound to confirm 3295 and the key resistance of ma5 to be short.
💰 Operation strategy: Rebound to 3280-3283 to go short, target 3270-3265, stop loss 3288-3290
If you are a beginner, I suggest you first understand what trading is.

GOLD FULL UPDATE – July 15, 2025 | Post-CPI TrapPost-CPI Flip Zone Battle
Hello dear traders 💛
Today has been one of those heavy CPI days — full of volatility, sweeps, and doubt. But if we read it structurally and stop chasing candles, everything makes sense. Let’s break it all down step by step, clearly and human-like.
Current Price: 3330
Bias: Short-term bearish, reactive bounce underway
Focus Zone: 3319–3320 liquidity sweep + key decision structure unfolding
🔹 Macro Context:
CPI came in slightly hot year-over-year (2.7% vs 2.6%) while monthly stayed in-line at 0.3%. That gave the dollar a short-lived boost, and gold reacted exactly how institutions love to play it — sweeping liquidity under 3320, then pausing. Not falling, not flying. Just... thinking.
That reaction matters. Why? Because it shows us indecision. It tells us that gold isn’t ready to break down fully yet, and every aggressive move today was part of a calculated shakeout.
🔹 Daily Structure:
Gold is still stuck below the premium supply zone of 3356–3380. Every attempt to rally there for the past few weeks has failed — including today.
The discount demand area between 3280–3240 is still intact and untouched. So what does this mean?
We are in a macro-range, and price is simply rotating between key structural edges.
🔹 H4 View:
The rejection from CPI at 3355–3365 created a micro CHoCH, signaling the bullish leg is now broken.
After the 3345 fail, price dropped to 3320 — but it hasn’t tapped the full H4 demand at 3310–3300.
H4 EMAs are tilting down, showing pressure. This isn’t a breakout. It’s a correction inside a larger range.
🔸 Key H4 Supply Zones:
3345–3355: liquidity reaction during CPI
3365–3375: untested OB + remaining buy-side liquidity
🔸 Key H4 Demand Zones:
3310–3300: mitigation zone from the CHoCH
3282–3270: deep discount and bullish continuation zone if current fails
Structure-wise: We are in a correction, not a clean uptrend. That’s why every bullish attempt fails unless confirmed.
🔹 H1 Real Structure
This is where things got tricky today.
Price formed a bullish BOS back on July 14, when we first pushed into 3370. That was the start of the bullish leg.
But today, we revisited the origin of that BOS, right near 3320. This is a sensitive zone.
If it holds → it’s still a retracement.
If it breaks → we lose the bullish structure and shift full bearish.
So far, price touched 3320, bounced weakly, but has not printed a bullish BOS again.
🔸 H1 Zones of Interest:
Supply above:
3340–3345: micro reaction zone
3355–3365: CPI origin rejection
3370–3375: final inducement
Demand below:
3310–3300: current flip test
3282–3270: if this breaks, bias flips bearish
Right now, we are between zones. Price is undecided. RSI is oversold, yes — but that alone is never a reason to buy. We need structure. We need BOS.
🔻 So… What’s the Truth Right Now?
✅ If 3310–3300 holds and price builds BOS on M15 → a clean long opportunity develops
❌ If 3310 breaks, and we lose 3300, structure fully shifts and opens downside to 3280–3270
On the upside:
Only look for rejections from 3355–3365 and 3370–3375
Anything inside 3325–3340 is noise. No structure, no clean RR.
Final Thoughts:
Today’s move was not random. It was a classic CPI trap: induce longs early, trap shorts late, and leave everyone confused in the middle.
But we don’t trade confusion — we wait for structure to align with the zone.
If M15 or H1 prints a BOS from demand, that’s your green light.
If price collapses under 3300, flip your bias. The chart already told you it wants lower.
No predictions. Just real reaction.
—
📣 If you like clear and simple plans, please like, comment, and follow.
Stay focused. Structure always wins.
📢 Disclosure: This analysis was created using TradingView charts through my Trade Nation broker integration. As part of Trade Nation’s partner program, I may receive compensation for educational content shared using their tools.
— With clarity,
GoldFxMinds

GOLD Price Continue to GrowXAUUSD has formed a bullish pattern after successfully testing and holding the strong support zone at 3310, which marked a key demand level. The recent bounce from this level confirms strong buyer interest despite temporary USD strength.
Demand for gold has sharply increased, often seen as a hedge during uncertain economic periods—even with a temporarily stronger dollar. The current price action reflects a bullish continuation pattern, suggesting potential for further upside. targeting will be 3360 3378 / 3400
You may find more details in the chart Ps Support with like and comments for better analysis.
I am Part of Trade Nations Influencer program and receive a monthly fee for using their Trading view charts charts in my analysis.

XAUUSD Bearish Structure Breakdown – Targeting 3310 ZoneXAUUSD is currently respecting the key resistance zone near 3340 and forming consistent lower highs, signaling a bearish momentum. After breaking the support area around 3325–3320, we expect price to continue its downward trajectory. If the support fails to hold, the next major target lies at the 3310 zone. This setup aligns with market structure and order flow, suggesting a high-probability sell opportunity on any pullback toward resistance.
Keep an eye on price action near the support zone for confirmation.
Bias: Bearish | Timeframe: 1H

Short term long is possible from the support Opening a short tem long with Gold. Opened @3325 with tight SL expecting another rebound around 3319

GOLD ROUTE MAP UPDATEHey Everyone,
Great finish to the week!!!
After completing our Bearish targets throughout the week, we got the swing perfectly, like we analysed and was waiting for our Bullish target to be complete.
- We got the Bullish target at 3358 HIT perfectly completing this range!!
BULLISH TARGET
3358 - DONE
BEARISH TARGETS
3330 - DONE
EMA5 CROSS AND LOCK BELOW 3330 WILL OPEN THE FOLLOWING BEARISH TARGET
3306 - DONE
EMA5 CROSS AND LOCK BELOW 3306 WILL OPEN THE SWING RANGE
3283 - DONE
We will now come back Sunday with a full multi timeframe analysis to prepare for next week’s setups, including updated views on the higher timeframes, EMA alignments, and structure expectations going forward.
Thanks again for all your likes, comments, and follows.
Wishing you all a fantastic weekend!!
Mr Gold
GoldViewFX

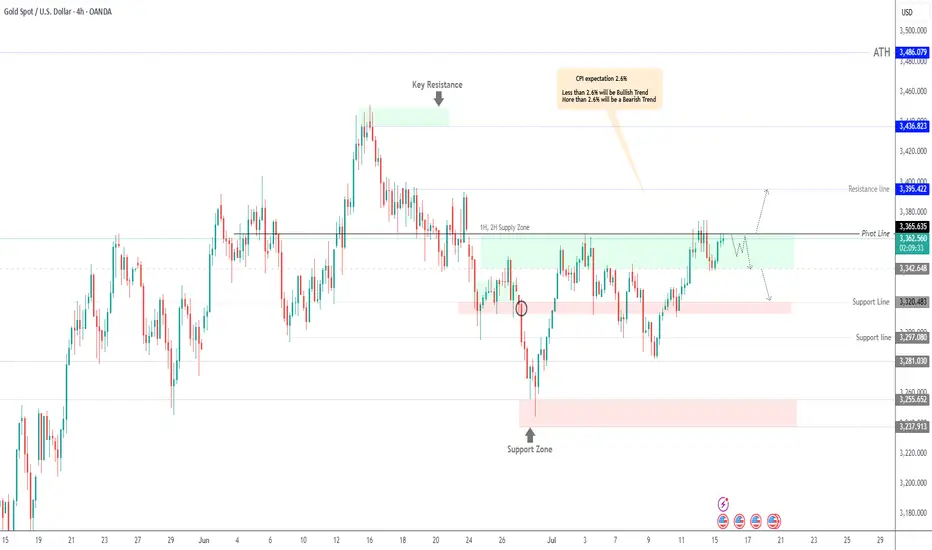
GOLD Under Pressure – CPI to Drive the Next MoveGOLD Outlook – Bearish Below 3365, CPI in Focus
Gold is showing bearish momentum while trading below 3365, with a likely move toward 3342.
However, if the price closes a 1H or 4H candle above 3365, it may shift to a bullish trend targeting 3395.
CPI data will be the key factor in determining the next move.
The market expects a print of 2.6%, which would signal no Fed rate cuts this year due to rising tariff pressures.
That said, we expect a 2.7% release, which would likely support a bearish trend for gold.
But if the release is less than 2.6% that will support the bullish trend.
Pivot Line: 3365
Support: 3342 – 3320
Resistance: 3375 – 3395
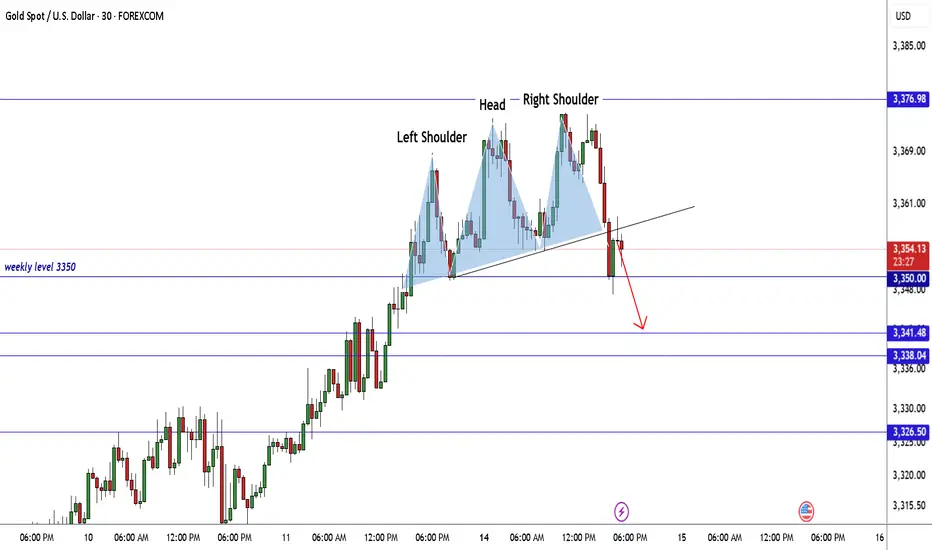
GOLD Made H&S Reversal Pattern , Scalping Short Setup Valid !Here is my GOLD 30 Mins Chart and if we checked the chart we will see that the price created a very good reversal pattern on 30 mins T.F , Head & shoulders reversal pattern and also it`s already confirmed by closure below neckline so the short is very clear now and we can targeting 100 to 150 pips , 3350.00 is a very good support also so we can see a price bounce from it to upside .
Beware of the market's trap of luring more investors, short 3335Regarding recent trading strategies, I believe you have also seen my trading win rate. I often inform the future trend of gold several hours or even days in advance, because my many years of trading experience have made me an excellent poisonous wolf in the trading market. Now I see a lot of bullish voices in the market, but my wolf’s sense of smell has discovered danger signals. In the short term, I think that without the influence of news, the market needs to digest the overbought momentum of the bulls. From the 4H chart, the middle track of the Bollinger Band is at 3332, which is very close to the strong support of 3330 given by us during the day. Therefore, I think that at least within 4 hours, gold will fall back to test the support below 3340-3330, or even 3320. Since most people want to follow the crowd, let them go. They will only fall into the trap set by the market. Let's prove with facts whether following the wolf pack will make you hungry or well fed.
OANDA:XAUUSD

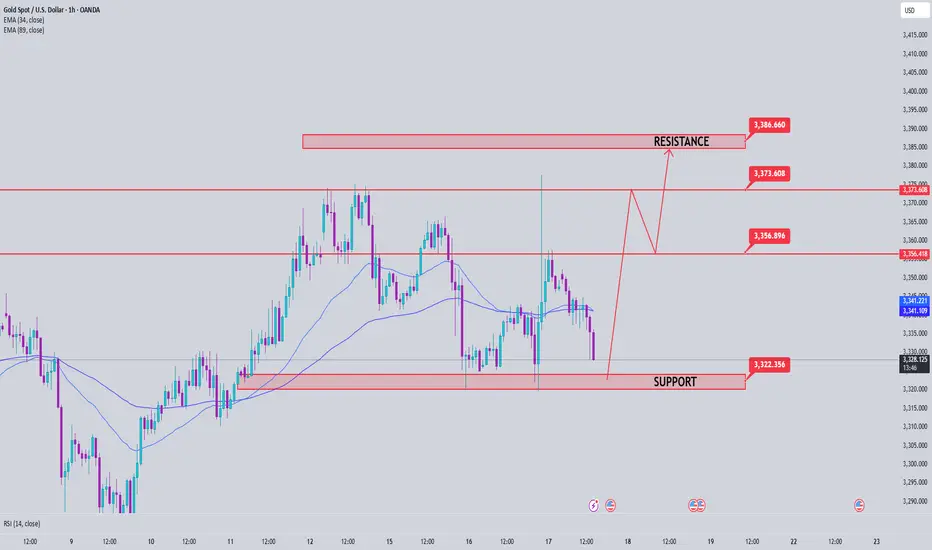
Gold Eyes 3,386 with No Reversal in SignsGold Eyes 3,386 with No Reversal in Signs
Gold continues its upward trajectory, with potential extension toward the $3,386 level.
In my view, the primary catalyst behind this rally is market manipulation.
Additionally, recent comments from former President Trump regarding tariffs, and remarks from Chair Powell on interest rate policy, have further fueled bullish sentiment.
You may watch the analysis for further details!
Thank you!
