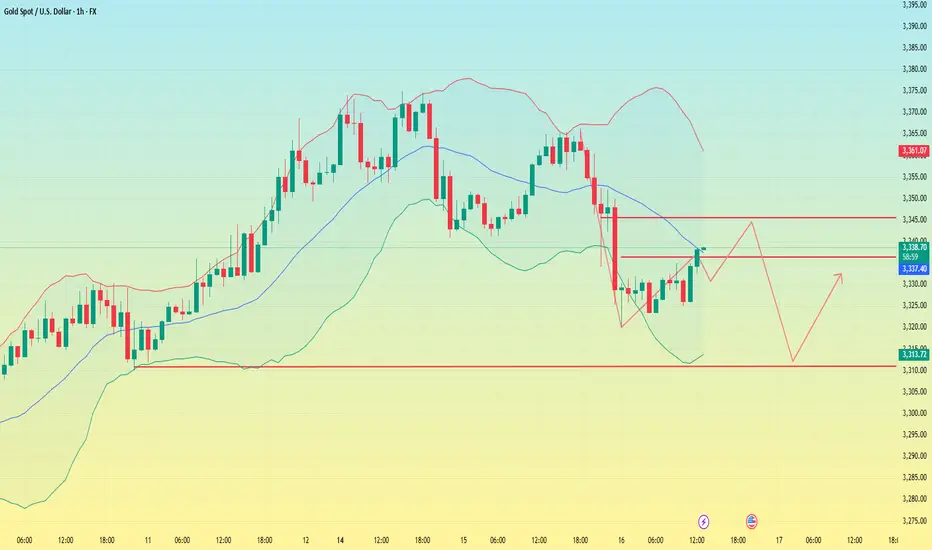
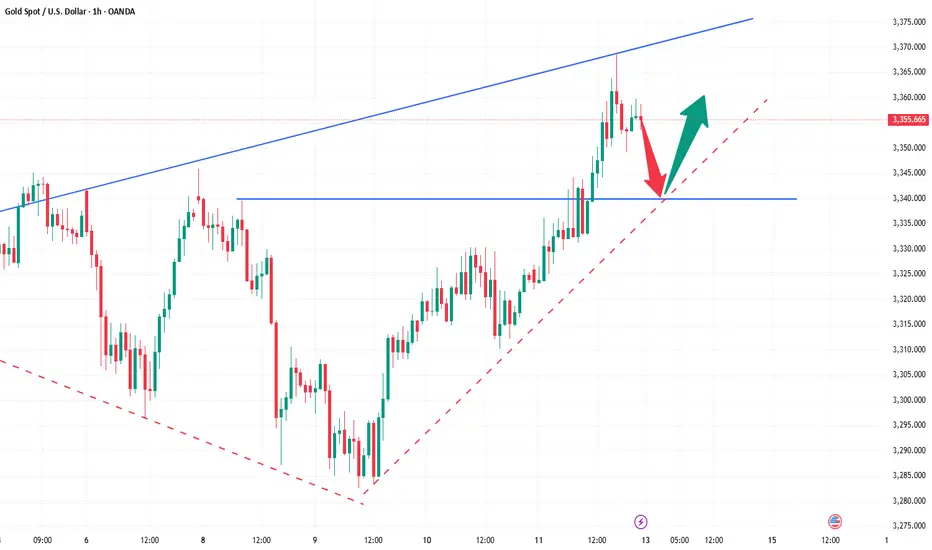
GOLD Price Continue to GrowXAUUSD has formed a bullish pattern after successfully testing and holding the strong support zone at 3310, which marked a key demand level. The recent bounce from this level confirms strong buyer interest despite temporary USD strength.
Demand for gold has sharply increased, often seen as a hedge during uncertain economic periods—even with a temporarily stronger dollar. The current price action reflects a bullish continuation pattern, suggesting potential for further upside. targeting will be 3360 3378 / 3400
You may find more details in the chart Ps Support with like and comments for better analysis.
I am Part of Trade Nations Influencer program and receive a monthly fee for using their Trading view charts charts in my analysis.
CFDGOLD trade ideas

XAUUSD: Market analysis and strategy for July 17.Gold technical analysis
Daily chart resistance: 3382, support below 3300
Four-hour chart resistance: 3375, support below 3320
One-hour chart resistance: 3352, support below 3320.
Trump's remarks in the NY market on Wednesday ignited the market. First, it was reported that Powell would be fired, and then it was reported that Trump denied the news. Gold quickly rose to 3375 and then quickly fell back. Under the impact of the news, the price fluctuated very quickly, jumping up and down quickly.
From the current market trend, the day before yesterday, it fell to 3319 and stopped falling and rebounded. Yesterday, it tested 3319 again and quickly pulled up. Yesterday, the price hit the high point of this week near 3375 again and fell back quickly. There is support below and resistance above. If it approaches the 3320 support for the third time today, it is likely to fall below, and then trigger a long stop loss, and it may fall rapidly at that time.
If it falls below 3319, it will look at the 3280~3300 range.
SELL:3319 SL:3324
SELL:3352 SL:3357

Learn the 3 TYPES of MARKET ANALYSIS in Gold Forex Trading
In the today's post, we will discuss 3 types of analysis of a financial market.
🛠1 - Technical Analysis
Technical analysis focuses on p rice action, key levels, technical indicators and technical tools for the assessment of a market sentiment.
Pure technician thoroughly believes that the price chart reflects all the news, all the actions of big and small players. With a proper application of technical strategies, technical analysts make predictions and identify trading opportunities.
In the example above, the trader applies price action patterns, candlestick analysis, key levels and 2 technical indicators to make a prediction that the market will drop to a key horizontal support from a solid horizontal resistance.
📰2 - Fundamental Analysis
Fundamental analysts assess the key factors and related data that drive the value of an asset.
These factors are diverse: it can be geopolitical events, macro and micro economic news, financial statements, etc.
Fundamental traders usually make trading decision and forecasts, relying on fundamental data alone and completely neglecting a chart analysis.
Price action on Gold on a daily time frame could be easily predicted, applying a fundamental analysis.
A bearish trend was driven by FED Interest Rates tightening program,
while a strong bullish rally initiated after escalation of Israeli-Palestinian conflict.
📊🔬 3 - Combination of Technical and Fundamental Analysis
Such traders combine the principles of both Technical and Fundamental approaches.
When they are looking for trading opportunities, they analyze the price chart and make predictions accordingly.
Then, they analyze the current related fundamentals and compare the technical and fundamental biases.
If the outlooks match , one opens a trading position.
In the example above, Gold reached a solid horizontal daily support.
Testing the underlined structure, the price formed a falling wedge pattern and a double bottom, breaking both a horizontal neckline and a resistance of the wedge.
These were 2 significant bullish technical confirmation.
At the same time, the escalation of Israeli-Palestinian conflict left a very bullish fundamental confirmation.
It is an endless debate which method is better.
Each has its own pros and cons.
I strongly believe that one can make money mastering any of those.
Just choose the method that you prefer, study it, practice and one day you will make it.
❤️Please, support my work with like, thank you!❤️
I am part of Trade Nation's Influencer program and receive a monthly fee for using their TradingView charts in my analysis.

FORECAST for XAUUSDI have a hunch price will drive down to sweep LQ. below and provide bullish opportunity in from the OB identified below.

SWING TRADE OPPORTUNITY 〉LONGAs illustrated, I try to visualize what the next bullish impulse could look like if price holds 3300 as a key psychological and algorithmic price level.
Illustrated are the potential buy areas (a current one and an extended one in case a pullback occurs to manipulate lower levels in the next 24-48 hours).
This projection, if valid, could hold from now until next week, so it can be considered a swing trade to hold at least the next week and into the following one).
--
After this post, I will upload another analysis on the Daily timeframe projecting the longer term move, so make sure to go in my profile to check it out.
GOOD LUCK

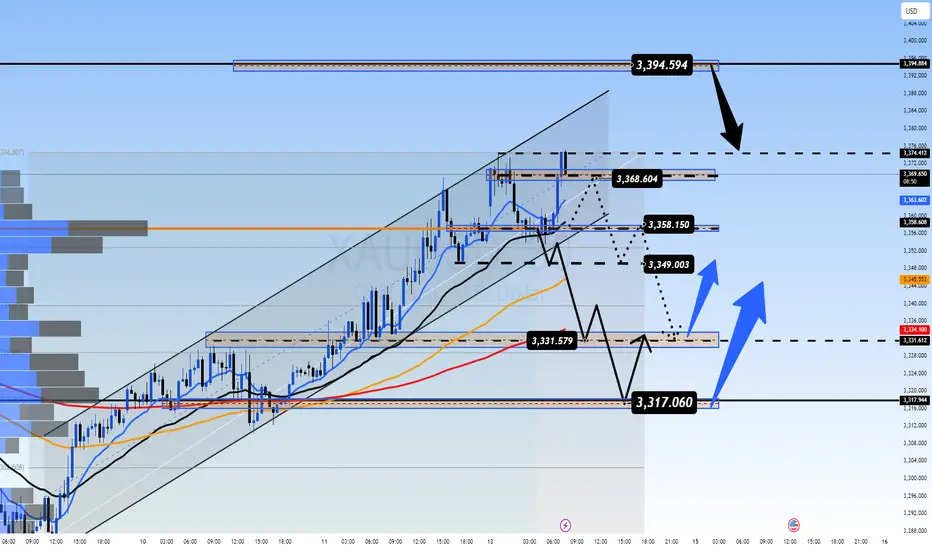
Early Week Pullback Ahead of Key Economic ReleasesGold Outlook – 14 July | Early Week Pullback Ahead of Key Economic Releases
🌍 Market Sentiment & Macro Overview
Gold has started the week with a sharp retracement after filling prior liquidity gaps (FVG) from the past two weeks.
This early weakness signals a risk-off tone as traders adopt a cautious stance ahead of a heavy macroeconomic calendar and geopolitical trade discussions.
This week’s high-impact events include:
📌 US CPI (Inflation Data)
📌 US PPI (Producer Prices)
📌 Unemployment Claims
📌 Retail Sales Figures
These data points will likely set the tone for price action through the second half of the week, with potential for sharp moves in gold.
📉 Technical Snapshot – M30 Chart Structure
Price swept minor liquidity above recent highs
Pulled back by more than $15 from the short-term top
Currently trading below the intraday VPOC (~3358), suggesting short-term bearish momentum
If the selling pressure holds, we may see a move toward:
⚠️ 333x zone — initial liquidity pool
❗ 332x zone — deeper liquidity grab before any bullish reversal
🧭 Trading Plan – Key Zones and Setup
📥 Buy Setup: 3331 – 3329 (Zone of Interest)
Stop Loss: 3325
Target Levels:
TP1: 3335
TP2: 3340
TP3: 3344
TP4: 3350
TP5: 3360 – 3370
✅ A highly reactive zone — ideal for intraday long setups if price sweeps into this area and shows bullish confirmation (e.g., volume spike or rejection wick).
📤 Sell Setup: 3393 – 3395 (Resistance Re-Test)
Stop Loss: 3399
Target Levels:
TP1: 3390
TP2: 3386
TP3: 3382
TP4: 3378
TP5: 3374 – 3370 – 3360
📉 Potential scalp zone if price retests resistance with signs of exhaustion. Monitor closely for bearish structure confirmation.
📊 Key Support & Resistance Levels
Resistance Zones:
3358
3368
3374
3394
Support Zones:
3349
3340
3331
3318
These zones remain relevant for both momentum trades and reversion setups.
⚠️ Strategy Considerations
At the time of writing, gold is trading indecisively around the M30 VPOC. No clear breakout has occurred yet.
⏳ Wait for volume confirmation during the London session
🚫 Avoid impulsive entries based on emotions or FOMO
✅ Stick to your risk parameters and let price come to your level
🧠 Summary & Bias
Gold is experiencing an early-week technical correction after recent strength.
The market is in "wait-and-see" mode, with macro drivers likely to dictate direction from mid-week onwards.
📍 Watch the 3331–3329 zone closely — it remains the most attractive level for long setups.
📍 The 3393–3395 zone is a key area to fade strength if price struggles at resistance.
Patience and precision are key this week. Let the market reveal its intention, and trade accordingly.
Gold gaps up and open higher,beware of going long at high levelsBros, the Asian session opened higher in the morning. Currently, gold is falling back to the SMA1O moving average. We will continue to be bullish after it falls back and stabilizes. At present, it has broken through the key resistance level of 3360. The daily line has shown a strong pattern of three consecutive positives. The gold price remains in the rising channel, and the bullish trend is obvious. As the gold price moves up, the short-term moving average moves up with it. At present, 3355-3345 constitutes an important support in the short term, and 3375-3385 above constitutes a short-term resistance area. Whether it can stand firmly above 3360 this week is the key.
Severe overbought in the short term, there are trading risks for long positions at high levels. Short-term operation suggestions for the Asian and European sessions: consider shorting when it touches 3365-3375, and stop loss when it breaks 3375. The target focuses on 3355-3345, and the breakout looks at 3330-3320. On the contrary, if it stabilizes at 3355-3345, you can consider going long.
XAUUSD: Market Analysis and Strategy for July 18Gold technical analysis
Daily chart resistance: 3382, support: 3310
Four-hour chart resistance: 3375, support: 3332
One-hour chart resistance: 3365, support: 3345.
From a technical perspective, the price of gold has recently formed a wide range of fluctuations in the range of 3310-3365 US dollars, reflecting the unclear market direction. At present, the short-term moving average of gold is supported at 3332, and other periodic indicators are also in a bullish arrangement. The overall decline at the hourly level is limited, and the bulls still have the momentum to rebound.
3310 on the daily chart constitutes a key support. If it falls below, it may fall to the July low of 3287-3282. On the upside, if the resistance level of 3366 US dollars is effectively broken, it may trigger short stop losses and push the gold price back to the 3400 US dollar mark. Pay attention to the resistance of 3366-3377 above and the support of 3345/3332 below
BUY: 3345near
SELL: 3365near

High Probability Short for Asia: Major Profit at 3318 Description:
Gold remains under pressure below multiple descending trendlines and is consolidating above key support. With volatility high, there’s a strong chance of a breakdown during the Asia session.
Trade Plan:
Wait for a retest of the 3,340–3,355 resistance zone (yellow box).
Watch for a bearish rejection (such as a strong wick, bearish engulfing, or high selling volume) at this zone—do not short blindly.
Enter short after confirmed rejection.
Trade Management:
Take a big part of your profit at 3,318 (first blue support line).
Once 3,318 is hit, immediately move your stop-loss to breakeven (your entry) for the remaining position.
Let the rest run toward the next targets: 3,301 and 3,299, and possibly as low as 3,247 if the breakdown is strong.
Key Points:
High-probability move is expected during the Asia session.
Trade only on confirmation, not at random levels.
If price reclaims and holds above 3,355, bearish idea is invalid.
Summary:
Look for a confirmed rejection near 3,340–3,355. Take most profit at 3,318, move stop-loss to breakeven, and hold the rest for a potential deeper drop.

Gold is getting ready to rise.Gold has been resting too long and the neutral triangle is no longer valid in terms of time and a contracting triangle seems to be forming.
In any case, there is at least one more bullish wave left for gold.
Good luck
NEoWave Chart

Gold bugs stay ready, breakout aheadGold bugs, don’t lose hope. After weeks of sideways action, gold is showing signs of a strong breakout. We look at charts, key levels, and what could trigger the next big move.

XAUUSD H1 BUYING SETUPScenario:
Gold is showing strong buying momentum 📈. The best entry points are around the H1 FVG (Fair Value Gap) and Order Block (OB) zones. Wait for confirmation signals in either of these areas.
Gold could take off 🚀 from the FVG or OB. Once you see confirmation in any of these zones, take the entry ✅.
Use a small lot size and follow strict risk management rules ⚠️💰.
Stay disciplined and trade smart! 🧠📊

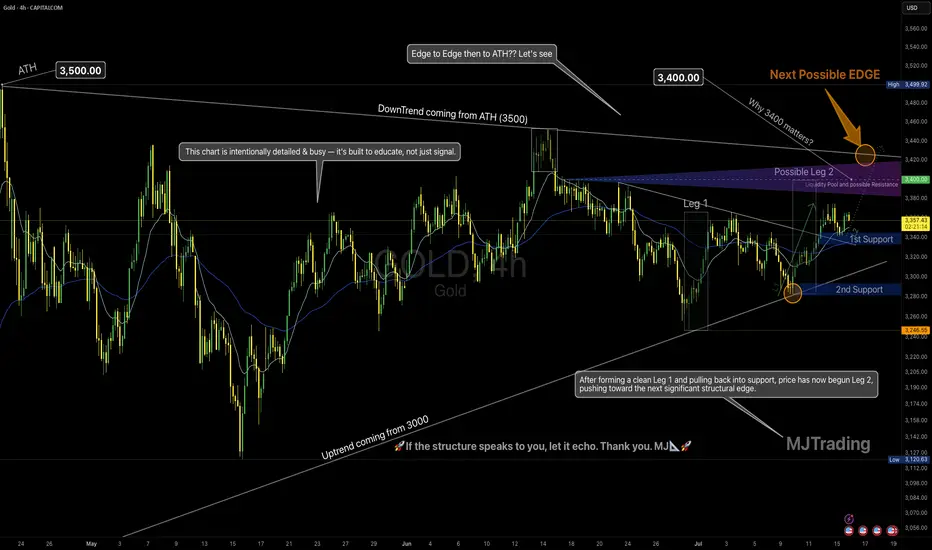
Leg 2 in Progress? | All Eyes on the Possible EDGE around 3400💡 GOLD 4H – MJTrading:
After forming a clean Leg 1 followed by a technical pullback into support, Gold has initiated Leg 2, pushing upward toward the next possible EDGE: 3400.
🟠 Why 3400 Matters
This zone is not just a round number:
It aligns with the long-term downtrend coming from the ATH (3500)
It’s the last reaction high before a deeper correction
There’s likely liquidity resting above — it’s where smart money may make decisions
This is where structure and psychology meet.
And end of 2 possible 2nd leg...
🔄 Possible Scenarios:
🟥 Scenario A – Rejection from the Edge (if could reach):
A reaction from this zone could lead to a pullback toward:
1st Support around 3340-3360
2nd Support near 3250 (also the uptrend line from 3000)
Use these zones to reassess momentum.
🟩 Scenario B – Breakout Above 3400:
A clean break above this structural edge opens the path for:
An “Edge to Edge” move back toward ATH (3500)
Possible higher timeframe trend shift — especially if retest holds
🧠 Our Strategy
We’re long-biased into the edge, not beyond it yet.
Let 3400 show its hand — we stay adaptive, not predictive.
🔍 This chart is intentionally detailed — it's built to educate, not just signal.
Focus on structure, sequence, and behavior — not just levels.
Lets Zoom in around the Breakout area...
And a Zoomout to Daily...
🧭 “If the structure speaks to you, let it echo.”
– MJTrading 🚀
📍#Gold #XAUUSD #TradingView #TechnicalAnalysis #ChartDesigner #MJTrading #MarketStructure #ForexIdeas #Edge
XAU/USD - Potential TargetsDear Friends in Trading,
How I see it,
1) A clean and decisive break above PIVOT area is required for broader upside.
2) If price remains below PIVOT area the potential for more downside is high.
2) Watch 3300- 3290 DEMAND closely.
3) If this demand area is breached - 3270 is next.
I sincerely hope my point of view offers a valued insight.
Thank you for taking the time to study my analysis.

The 3400 mark will be the key for next week!Gold has been up and down this week, and the shock wash has intensified. It bottomed out and rebounded at 3282, and then steadily pulled up. After a slow rise to 3368 on Friday, the retracement was limited, and finally closed at 3355. So can gold be expected to be strong? Is it possible to reach 3400 next week? From the trend point of view, it is too early to say that it will turn strong. 3400 is an insurmountable barrier. Only by breaking through 3400 can we see a stable strong bull. If it is suppressed below 3400, the bulls will not be stable and may fall back at any time. We can only see large range fluctuations. From the overall trend point of view, gold is currently fluctuating widely in the large range of 3250-3400. It is safe to buy below 3300, and it is easy to go up. After all, it is still upward in the long run. Next week, we will focus on the gains and losses of the 3400 mark. It is not recommended to chase the high position directly on Monday. On the one hand, the interruption of the market after the weekend holiday can easily cause discontinuous rise. In addition, after three consecutive positive lines on the daily line, there will either be a negative correction and a fall, or a large positive volume. Combined with the current trend and rhythm of gold, be careful of a high-rise fall, and it is easy to get trapped by chasing long positions at high positions. Don't feel that it will soar as soon as it rises, and the high point of 3500 seems to be within reach; don't feel that it will fall sharply as soon as it falls, and the 3000 mark is not a dream. We should stay away from those who sing long when it rises and sing short when it falls. The direction is not because you see it, so you believe it, but because you believe it, so you see it. There will always be a time when you chase the rise and sell the fall and you will return with nothing.
Moreover, the high point of 3365 has not formed a substantial break and stabilized. On Monday, we still need to focus on the gains and losses of this position, so we need to look at it from two aspects:
1. If it rises directly at the opening, pay attention to the pressure near 3370-3380 and you can go short, and the target is 3350-3340!
2. If the market falls back at the opening, go long around 3340-3330, with the target above the high point of 3360-3368.
XAUUSD trade idea🟣 Current Market Behavior
Price has reached a resistance zone around 3355–3360, previously respected as a supply area.
A rejection candle or price weakness at this level is triggering a short-term bearish outlook.
🔻 Short-Term Bearish Plan
Sell entry zone: 3355–3360
> Target for this sell (TP): 3320
➤ This suggests a possible drop of around 250–300 pips from the current high.
> Reason: The price is expected to make a technical correction after hitting a resistance level.
🔼 Mid-Term Bullish Plan
: After reaching the 3320 support area, the chart expects a bullish reversal or continuation of the uptrend.
> Buy setup target: 3395–3400
➤ This level represents the next potential bullish wave after the correction.
> Reason: The overall pattern remains bullish. The idea assumes this drop is temporary and part of a healthy pullback before the uptrend resumes.
📝 Summary:
Phase 1: Sell from 3355–3360 to 3320 (correction phase)
Phase 2: Buy from 3320 toward 3395–3400 (bullish continuation)
Strategy combines resistance rejection + correction + trend continuation principles.

Gold Price Reversal Setup: Breakout Retest with Bullish Targets.This 1-hour gold (XAU/USD) chart shows a potential bullish setup. Price is currently near support at 3,320.191, with possible reversal signals forming. The chart highlights a previous breakout zone around 3,354.004. If price rebounds, targets are set at TP1 (3,354.004) and TP2 (3,377.426). Key events and technical signals suggest a potential move upward.

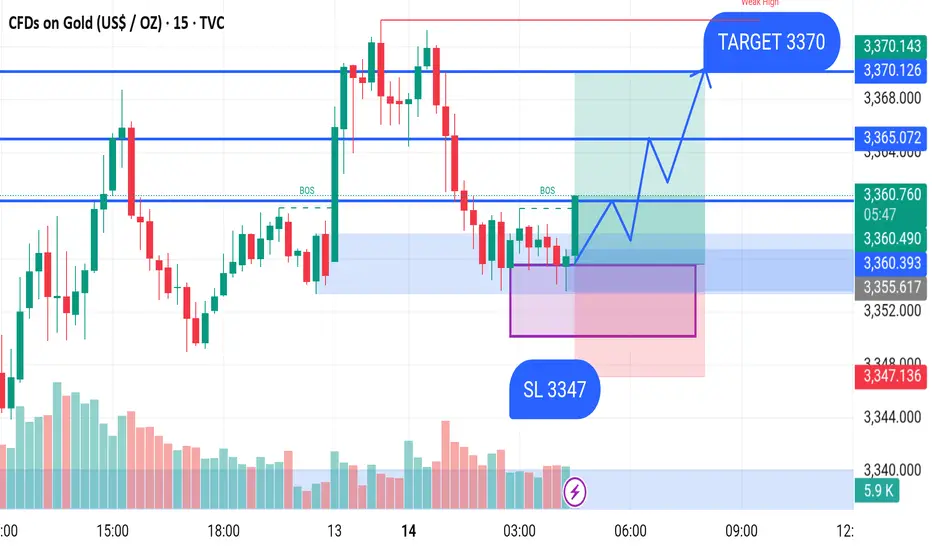
GOLD BUY M15 XAU/USD (Gold) 15-Minute Chart Analysis – July 14, 2025
Price is currently trading around 3358 after showing consolidation within a highlighted demand zone (purple box). A potential bullish move is anticipated from this zone, with the expectation of a reversal to the upside.
Key Levels:
Entry Zone: 3355–3358 (demand/support area)
Stop Loss (SL): 3347 (below the demand zone)
Target: 3370 (resistance level)
Analysis Summary:
Price previously showed a Break of Structure (BOS) to the upside, indicating bullish momentum.
Currently retesting the demand zone, which could act as a strong support.
If the price holds above the support and gains bullish momentum, we may see a move toward the first resistance at 3360, then 3365, and ultimately the target at 3370.
This setup offers a good risk-to-reward ratio, with a tight stop loss and clear bullish targets.
Gold breaks trendline towards 3390, Uptrend resumes✏️ OANDA:XAUUSD The price increase will continue today and will be even stronger. After breaking the trendline, gold has strong support. SELL strategies are only considered to find short-term reaction points waiting for the next trends.
Gold has confirmed the uptrend is back, heading to 3390 today.
📉 Key Levels
Support 3330-3314
Resistance 3345-3362-3388
Sell trigger: rejection from 3345 with bearish confirmation
Sell zone: 3362–3387 (Strong resistance)
BUY trigger: 3330-3314 support with bounce confirmation
Leave your comments on the idea. I am happy to read your views.

XAU / USD 1 Hour ChartHello traders. Looking at the push up from the overnight sessions, I am waiting to see if we push back down or do we start moving up. So for me, I am watching the $3354 area. If we can break and close above that, and with volume and favorable conditions for gold, we could partially fill, or fill the wick to the left marked on the chart. Let's see how things play out. There is no big new today here in the US. Watching the 30 min, the hourly and the 4 hour candles to see if I can get a good entry for scalp buy / sell trades. BIg G gets a shout out. Be well and trade the trend. Happy Friday.

Gold price fluctuates! Gold operation guide!Market news:
In the early Asian session on Thursday (July 17), spot gold fluctuated in a narrow range and is currently trading around $3,341 per ounce. Rumors that Trump plans to fire Federal Reserve Chairman Powell caused violent market fluctuations. The US dollar once plummeted, and then narrowed the decline; while the London gold price gave up most of its gains after soaring. If Powell is fired in advance, it may be unfavorable to the US dollar, because it will shake the outside world's confidence in the US financial system and the safe-haven status of the US dollar.
Trump's repeated statements have caused the international gold price to experience violent fluctuations in a short period of time. The market's concerns about the independence of the Federal Reserve have become an important driving force for the rise in gold prices. However, geopolitical tensions still support gold prices. Israel launched an airstrike on Damascus, Syria on Wednesday, destroying the Ministry of Defense building, which is very close to the Syrian presidential palace. Trump's trade policy has further injected uncertainty into the gold market.
Technical Review:
The news that Trump's big mouth "considered replacing Federal Reserve Chairman Powell" caused violent fluctuations in the financial market. Although the storm subsided after Trump's denial, Wall Street has sounded the alarm. Rumors that Trump will fire Powell caused market volatility, and the US dollar index plunged and closed down 0.36% during the session. Spot gold was on a roller coaster ride, rising sharply from 3320 to 3377 in the late trading, then plunged back to 3336 and then rose again to 3357 before closing sideways around the 3350 mark.Technical daily chart structure alternates between positive and negative cycles to maintain the adjustment of the Bollinger band middle track, the indicator is neutral, the Bollinger band closes, and the RSI indicator is flat. The four-hour chart and hourly chart indicators are neutral. Affected by market news, the gold price alternates between long and short cycles and fluctuates widely, the moving average is glued, the RSI indicator middle axis is flat, and the Bollinger band is flat and closed. Gold maintains a wide range of fluctuations, selling at high prices and buying at low prices.
Today's analysis:
The gold market last night was quite exciting. In the middle of the night, Trump claimed that he would fire Powell. After the news came out, gold soared by more than 50 US dollars in a short period of time, but the market was only controlled by emotions in a short period of time. After all, the chairman of the Federal Reserve is independent, and Trump cannot have the right to fire Powell. Once the emotions passed, although gold fell sharply, it also pushed up the trend of gold prices to a certain extent! At present, after the strong rise of gold in 1 hour, it quickly fell back and closed with a long upper shadow line. The change in gold buying did not successfully stabilize. Then this market is actually a kind of catharsis of the news. The confidence of gold buying in directly rising again is not very sufficient. The gold 1-hour moving average is still in the form of dead cross selling. So gold rebounds or continues to sell.The gold 1-hour pattern excludes the influence of the upper shadow line stimulated by yesterday's news. In fact, the whole rhythm is still fluctuating and falling. The upper shadow time is not long, and it is probably just a temptation to buy. After the ups and downs of gold last night, it rebounded again to the 3360 line or continued to fall under pressure. So gold continued to rebound under pressure and continued to sell at high prices below 3360.
Operation ideas:
Buy short-term gold at 3325-3328, stop loss at 3317, target at 3350-3370;
Sell short-term gold at 3357-3360, stop loss at 3368, target at 3340-3320;
Key points:
First support level: 3330, second support level: 3319, third support level: 3303
First resistance level: 3358, second resistance level: 3370, third resistance level: 3386

Gold fluctuates downward. Can it break through?The CPI data released is in line with expectations, the tariff storm is still continuing, inflation rebounds and the Fed's expectations of interest rate cuts have cooled. Gold rebounded to 3366 and then fell, and is currently fluctuating around 3330.
From the current trend, gold fell strongly and broke through the Bollinger middle rail and the moving average support. The daily line focuses on the Bollinger middle rail under pressure near 3340, and the short-term support is at 3310. At present, a staged top pattern has been formed and the K-line double top is around 3366. The Bollinger moves downward and the price is in a downward channel.
For short-term operations, Quaid believes that the strategy of rebound shorting can still be followed.
Short near 3345, stop loss 3355, profit range 3330-3310
Long near 3310, stop loss 3300, profit range 3330-3345