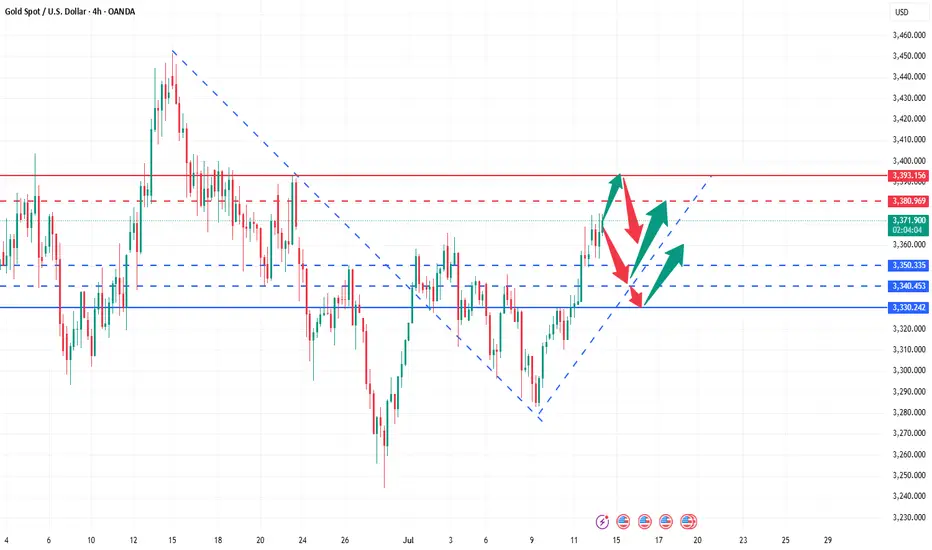
Gold rises strongly, aiming for a new high!Last Friday, gold continued to rise strongly, breaking through 3320 in the Asia-Europe session and accelerating its rise. The European session broke through the 3340 mark continuously. The US session broke through 3369 and then fell back. The daily line closed with a big positive line. It broke through the high for three consecutive days and returned to above 3360. The unilateral bullish pattern was re-established. Today, the gold price jumped high and broke through 3370 and then fluctuated at a high level. Although it rushed up, the strength was limited. It must be adjusted after a short-term retracement before it can continue to rise. Therefore, in terms of operation, we continue to maintain the main idea of retreating and multiplying. Pay attention to the 3340-3345 area for short-term support during the day, and look at the 3330 line for strong support. If it does not break, it will continue to be a good opportunity to buy low and do more. Taking advantage of the trend is still the current main tone. As long as the daily level does not break 3330, the bullish structure will not be destroyed.
🔹Support focus: 3340-3345, key support level 3330
🔹Resistance focus: 3380-3393 area
1️⃣ If the price falls back to 3340-3350, a light long position will be intervened, with the target of 3365-3370. A strong breakthrough can see a new high;
2️⃣ If the price rises to 3380-3393 and is under pressure, a short-term short position adjustment can be tried, with a short-term target of around 3360.
The specific real-time points and position arrangements will be updated at the bottom. Interested friends are advised to pay attention to my strategy tips in a timely manner and seize every opportunity reasonably.
CFDGOLD trade ideas
Learn the 3 TYPES of MARKET ANALYSIS in Gold Forex Trading
In the today's post, we will discuss 3 types of analysis of a financial market.
🛠1 - Technical Analysis
Technical analysis focuses on p rice action, key levels, technical indicators and technical tools for the assessment of a market sentiment.
Pure technician thoroughly believes that the price chart reflects all the news, all the actions of big and small players. With a proper application of technical strategies, technical analysts make predictions and identify trading opportunities.
In the example above, the trader applies price action patterns, candlestick analysis, key levels and 2 technical indicators to make a prediction that the market will drop to a key horizontal support from a solid horizontal resistance.
📰2 - Fundamental Analysis
Fundamental analysts assess the key factors and related data that drive the value of an asset.
These factors are diverse: it can be geopolitical events, macro and micro economic news, financial statements, etc.
Fundamental traders usually make trading decision and forecasts, relying on fundamental data alone and completely neglecting a chart analysis.
Price action on Gold on a daily time frame could be easily predicted, applying a fundamental analysis.
A bearish trend was driven by FED Interest Rates tightening program,
while a strong bullish rally initiated after escalation of Israeli-Palestinian conflict.
📊🔬 3 - Combination of Technical and Fundamental Analysis
Such traders combine the principles of both Technical and Fundamental approaches.
When they are looking for trading opportunities, they analyze the price chart and make predictions accordingly.
Then, they analyze the current related fundamentals and compare the technical and fundamental biases.
If the outlooks match , one opens a trading position.
In the example above, Gold reached a solid horizontal daily support.
Testing the underlined structure, the price formed a falling wedge pattern and a double bottom, breaking both a horizontal neckline and a resistance of the wedge.
These were 2 significant bullish technical confirmation.
At the same time, the escalation of Israeli-Palestinian conflict left a very bullish fundamental confirmation.
It is an endless debate which method is better.
Each has its own pros and cons.
I strongly believe that one can make money mastering any of those.
Just choose the method that you prefer, study it, practice and one day you will make it.
❤️Please, support my work with like, thank you!❤️
I am part of Trade Nation's Influencer program and receive a monthly fee for using their TradingView charts in my analysis.

XAUUSD – M15 Buy Setup⚡️XAUUSD – M15 Buy Setup
We’re back to business at a key decision point! Here’s what makes this a compelling opportunity:
📍Buy Setup on M15:
1️⃣ Price tapped into a strong support zone around 3333 – a level with proven reaction history
2️⃣ Third touch of the descending channel – possible breakout setup / bullish flag on HTF
3️⃣ A strong bullish engulfing candle closed above the previous daily close, showing buyer strength
4️⃣ Supported by the H4 MA zone acting as dynamic demand
🔥 Everything aligns technically for a high-probability bounce – but remember:
Strong setup ≠ guaranteed outcome.
We trade probabilities, not certainties.
🚀 Go for it guys... but manage your risk like a pro!
#XAUUSD #Gold #BuySetup #PriceAction #ChannelBreakout #SmartMoney #ChartDesigner #MJTrading #Forex #TradeIdea

oro Suggested Description for a Long Trade Idea on Gold (GOLD):
Potential Technical Rebound After Sharp Drop – Waiting for Confirmation
Gold (5-minute chart) has broken below the key $3,348 support and is now showing extreme oversold conditions on the Stochastic Oscillator. Although bearish momentum dominates, I’m watching this zone for a possible bounce if price reclaims the $3,348 level with a clear bullish candle.
Conditional Long Setup:
Entry: ~$3,348–$3,350 (after confirmation)
Stop Loss: $3,341 (below the recent low)
Take Profit 1: $3,355
Take Profit 2: $3,362
If the bounce fails and price continues lower, I may consider a short setup toward $3,335. Waiting for clear signals before entering any position.
⚠️ This is not financial advice – just sharing my personal analysis for discussion and learning purposes.

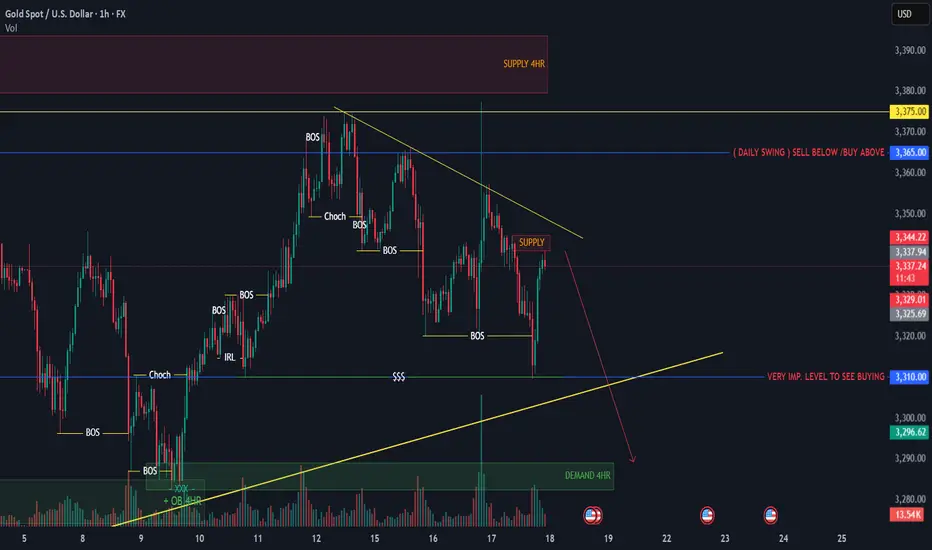
GOLD POSSIBLE SELLPossible Scenarios:
🔻 Bearish Bias (Primary Scenario)
Price is currently reacting from the 30-min supply zone.
Under the descending trendline, maintaining lower highs.
If rejection confirms, we may see a move down toward the 3310 level, and possibly into the 4H Demand Zone.
Price Levels:
Daily Swing Decision Level: 3365 — Sell below / Buy above level.
Current price: 3336.80, just under this swing level, indicating bearish pressure.
Immediate support: 3310, critical for buyer interest.
Lower support: 3296.62, likely the next demand area if 3310 fails.
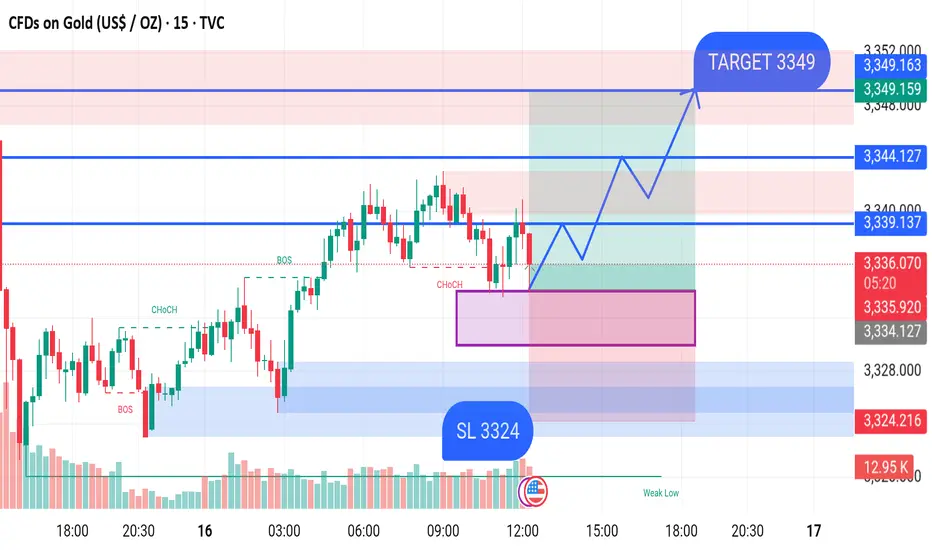
GOLD BUY M15 XAU/USD (Gold) 15-Min Chart Analysis – July 16, 2025
Price is currently consolidating around the 3,335.70 level after showing a Change of Character (CHoCH), indicating a potential shift from bearish to bullish momentum.
Key Observations:
Demand Zone: Marked in purple between 3,334 – 3,330, where buyers may step in.
Stop Loss (SL): Placed at 3,324, just below the demand zone for risk management.
Break of Structure (BOS): Confirmed to the upside, suggesting bullish intent.
Expected Move: A bounce from the demand zone, followed by higher lows and a breakout above the resistance levels.
Important Levels:
Entry Area: Near current price at 3,335
Resistance Levels:
3,339
3,344
Target: 3,349
Stop Loss: 3,324
Bias: Bullish, as long as price holds above the 3,324 support.
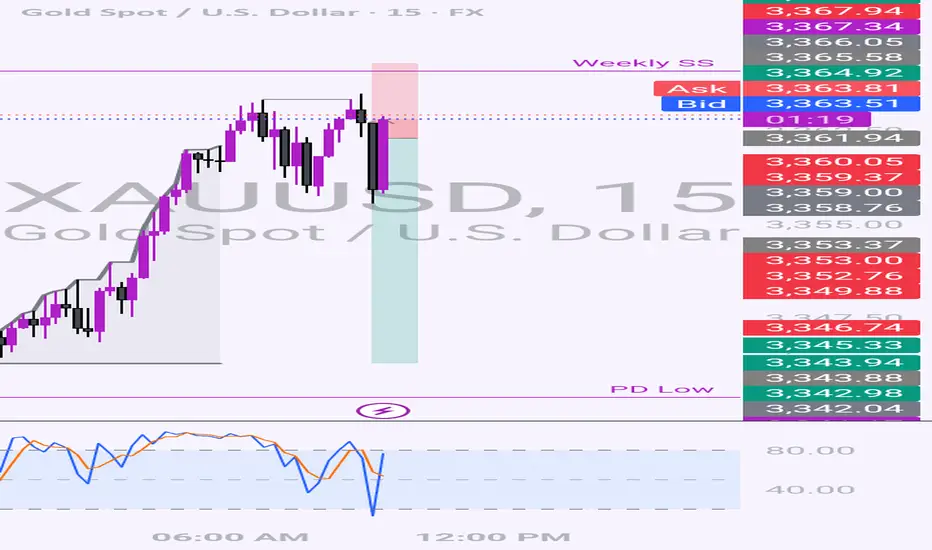
Oolong news stirs up goldDuring the US trading session, the market suddenly had an "oolong" incident. The news that Trump fired Powell caused gold to surge to 3367, but Trump soon denied the plan, the risk aversion sentiment dissipated, and gold fell sharply.
At present, gold has returned to volatility. Given that the risk aversion sentiment failed this time, we need to be vigilant about the subsequent surge and fall.
Given the volatile news, it is better to hold the currency and wait and see, and then look for a good opportunity to operate after the news becomes clear. At present, the upper resistance is 3365-3370, and the lower support is 3326-3317. It is recommended to do more in the future market.

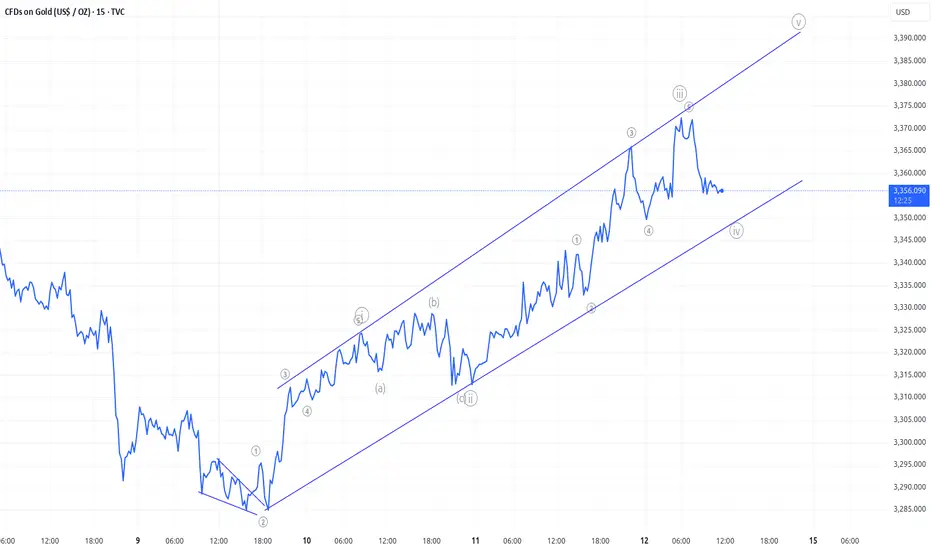
Gold market price trend analysis and operation strategyGold trend analysis:
Gold reached a high of 3366 yesterday, a low of 3320, and closed at around 3325. From the daily chart, the performance of the daily cycle is high and closed negative, and it may not be able to go out of the big rise in the short term. Gold will fall into range fluctuations. The rise of gold in this cycle has not actually been completed. At least it needs to go to the high point of 3400, and then look at the adjustment space within the week, but don’t look too much at the strength of the rise. The general trend is bullish, and we must also beware of the adjustment space that may fall back at any time. Gold tried 3375 several times yesterday and failed to break through, and then fell back for adjustment, indicating that the pressure on 3375 is obvious, that is, gold needs to fall back and correct in the short term. At this time, we are cautious about chasing more and continue to buy more after falling back.
From the 4-hour chart, gold rose and fell yesterday, and the bearish trend did not continue. Gold entered a period of adjustment. From the current K-line, the downward momentum of gold is slowing down, and it tends to rebound in the short term. In the 4-hour chart, the lower track support of the Bollinger Band is near 3320, and the position of the middle track of the Bollinger Band is near 3345, which will form a short-term resistance. From the 1-hour chart, after yesterday's drop to 3320, it was strongly supported again and pulled up to above 3330. The support below is still strong. If the European session rises and breaks through 3350 today, the US session may go to the resistance of 3365-3375. Before breaking through 3350, the current market can only be regarded as a bottom adjustment and correction. Today, we will first focus on the rebound strength. If the upward momentum weakens, pay attention to the support of 3310-3300 below, and wait for the decline to be mainly low-multiple. In the short term, we will first focus on the breakthrough of the shock range. The intraday idea is to fall back to low-multiple. FX:XAUUSD ACTIVTRADES:GOLD OANDA:XAUUSD TVC:GOLD EIGHTCAP:XAUUSD ACTIVTRADES:GOLD
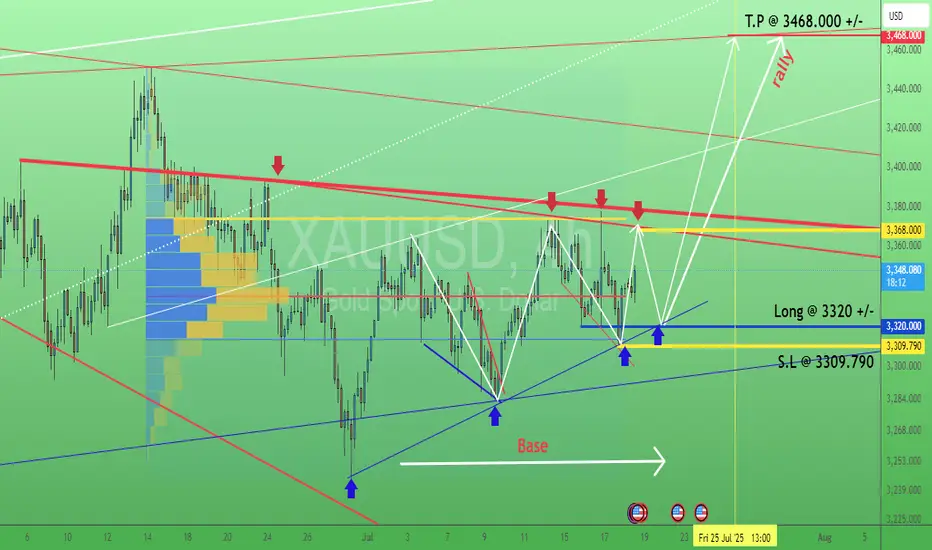
Gold. Swing trading signal. 18/July/25XAUUSD probably still ranging within 3309 - 3368 before breakout to the upside...targeting still around 3460 +/-
XAUUSD PRICE ACTION ANALYSIS 📉 XAUUSD – Gold Price Action Outlook
🕒 Timeframe: 30-Minute Chart
📅 Date: July 15, 2025
---
🔍 Market Structure Analysis:
Gold has shown a clear shift in market structure — forming Lower Highs (LH) and Lower Lows (LL) after a Break of Market Structure (BMS) and Change of Character (CHoCH). This signals a transition from bullish to bearish momentum.
---
📈 Technical Insights:
Price was strongly rejected from a key resistance zone (around 3,375–3,380).
Multiple confirmations of bearish pressure, including structure breaks and EMAs turning down.
A retest of broken support is likely before continuing downward.
Targeting the demand zone near 3,282 as the next level of interest.
---
🎯 Bearish Target Zone: 3,282
A high-probability setup is forming. Price is expected to retrace slightly before pushing lower toward the marked target zone.

XAUUSD 4H bullish setup📈 Gold (XAUUSD) 4H – Breakout Retest Toward 3439.25
Des:
Price has finally broken out of the tight consolidation range and is now trading above key structure. I'm watching for a bullish continuation play with a possible retest into the 3360–3365 zone (demand/OB zone), followed by a push toward the 3439.25 target.
✅ Bullish structure confirmed
🔄 Waiting for pullback entry
🎯 Target: 3439.25
🛡️ Clean invalidation below 3350
Let’s see how this unfolds 🔥

Confluence trading A minor sell setup
potential counter trend sell setup on gold as ,the 4h is currently on a retrace from the bullish trend
use market structure to confirm the setup

XAUUSD 15m Bearish Pullback Setup | Supply Zone Rejection Trade XAUUSD 15-Minute Analysis & Trade Idea
Market is respecting a bearish structure with lower highs and lower lows. Price is currently pulling back toward a supply zone around 3,354.09–3,359.03 after breaking below the True Day Open.
Reasoning:
Bearish market structure
Confluence with True Day Open, session highs/lows, and downward trendlines
Risk-to-reward of approximately 1:2+
Reminder: This is not financial advice. Do your own analysis and risk management.

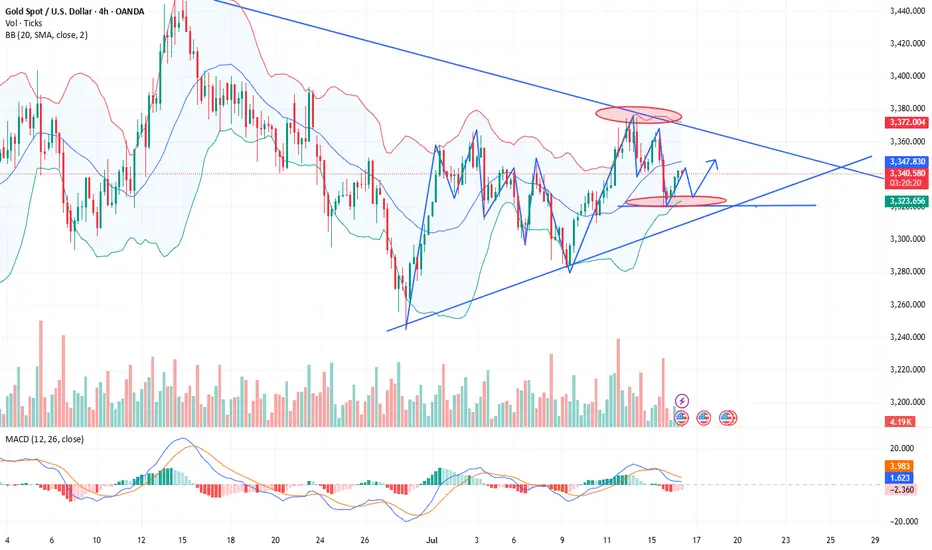
Gold is currently at a critical decision point.Key Technical Insights (Gold)
1) Fibonacci Confluence Zone:
Now gold price action is currently compressed between two overlapping 61.8% Fibonacci retracement levels:
- Swing Low Retracement (61.8%) from the prior downtrend leg
- Swing High Retracement (61.8%) from the recent bullish move
This dual Fibonacci alignment reflects a high tension equilibrium between bullish and bearish forces, a typical precursor to breakout volatility.
2) Chart Pattern – Symmetrical Triangle:
Price is also developing a symmetrical triangle pattern, signaling a period of consolidation and potential energy buildup.
This structure usually leads to a breakout in the direction of the prevailing longer-term trend, which in this case remains bullish.
3) Momentum & Volatility:
RSI is holding in the mid-50s range — confirming market indecision.
Volume is contracting, consistent with the compression phase before expansion.
4) Mid-Term Outlook: Bullish Bias with Caution
Based on current technical conditions and macroeconomic context, the mid-term outlook for gold remains bullish, but requires patience and confirmation.
5) Strategic Levels to Watch:
- Breakout zone: $3,375 – $3,385
- Upside targets (if breakout holds): $3,435 → $3,495 → $3,520
- Bearish invalidation: Break below $3,240 would negate this bullish setup.
Gold is currently at a critical decision point compressed between technical resistance and structural support, forming a triangle at Fibonacci confluence. While the breakout direction is yet to be confirmed, probability favors a bullish resolution in alignment with the macro uptrend.
Traders and investors should remain patient, wait for confirmation, and manage risk accordingly.
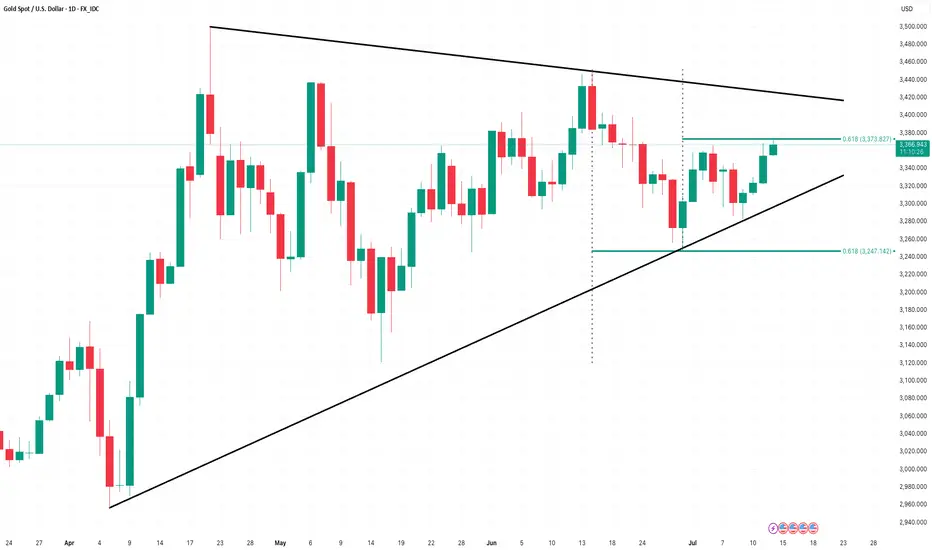
XAUUSD Triangle about to break upwards aggressively.Gold (XAUUSD) has been trading within a Triangle pattern since the April 22 High. It is now above its 1D MA50 (blue trend-line), which has been turned into its Pivot and technically it is about to break upwards as it is running out of space.
As long as the 1D MA100 (green trend-line) holds, the market technically targets the 2.618 Fibonacci extension, which is what the last two Bullish Legs hit, which currently sits at 3770. A 1D RSI break above its own Lower Highs trend-line, could be an early buy signal.
-------------------------------------------------------------------------------
** Please LIKE 👍, FOLLOW ✅, SHARE 🙌 and COMMENT ✍ if you enjoy this idea! Also share your ideas and charts in the comments section below! This is best way to keep it relevant, support us, keep the content here free and allow the idea to reach as many people as possible. **
-------------------------------------------------------------------------------
Disclosure: I am part of Trade Nation's Influencer program and receive a monthly fee for using their TradingView charts in my analysis.
💸💸💸💸💸💸
👇 👇 👇 👇 👇 👇

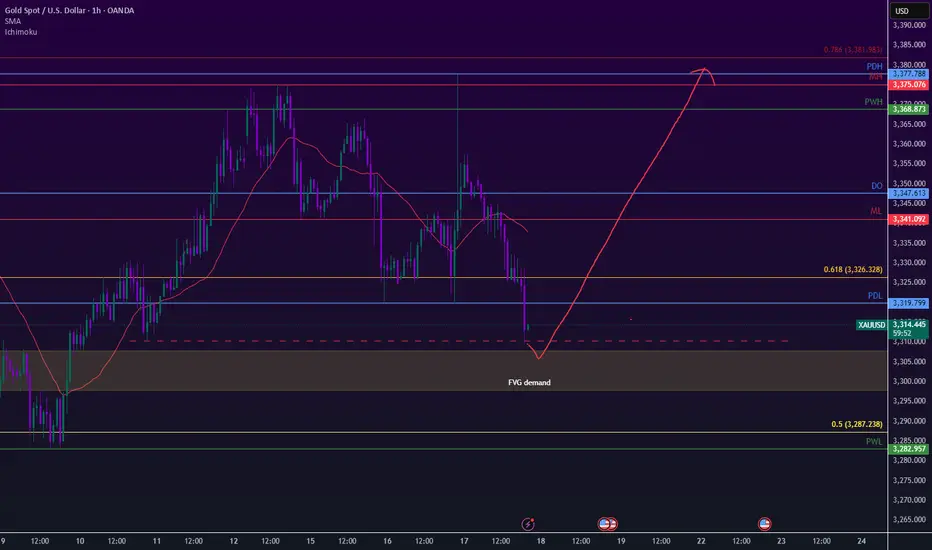
Gold to tap FVG and fly like a rocketGold has shifted long-term momentum recently, we have made a great stride to the upside and currently in a pullback. It should take liquidity here either on the FVG zone or 3310. Targeting all the way at 161% fibs on the previous push at 3440.
Gold Maintains Bullish Tone – Eyes on $3,350 Breakout📊 Market Overview
• Gold is trading around $3,339 – $3,340, after rebounding from the session low at $3,332.
• The USD is temporarily weakening, and safe-haven flows remain steady — key factors supporting gold.
• Markets are awaiting fresh U.S. economic data for clearer directional cues.
📉 Technical Analysis
• Key Resistance Levels:
– Near-term: $3,344 – $3,345
– Extended: $3,352 – $3,356 (weekly highs)
• Key Support Levels:
– Near-term: $3,332 – $3,335
– Extended: $3,320 – $3,325 (MA confluence + technical base)
• EMA: Price remains above EMA 09, confirming a short-term uptrend.
• Candle Pattern / Volume / Momentum: RSI is around 54–56; momentum remains positive but has cooled — suggesting potential consolidation.
📌 Outlook
Gold is maintaining a bullish technical structure — if it breaks above $3,345, a move toward $3,352 – $3,356 is likely. On the downside, a drop below $3,332 could trigger a retest of $3,325 – $3,320.
💡 Suggested Trading Strategy
🔺 BUY XAU/USD: $3,324 – $3,327
• 🎯 TP: 40/80/100 pips
• ❌ SL: $3,320
🔻 SELL XAU/USD :$3,352 – $3,355
• 🎯 TP: 40/80/100 pips
• ❌ SL: $3,359

Gold rebound brings bearish opportunities
Before the fishermen go out to sea, they don't know where the fish are? But they still choose to go because they believe they will return with a full load. When you invest, you don't know whether you can make a profit, but you still need to try, and from the moment you decide to do it, you must insist on believing to gain something. The same is true for gold investment. You may still be losing money at the moment, but as long as you find me, all losses will be solved!
Views on the trend of gold!
In terms of gold, unfortunately, the bulls don't seem to last long, and they are also a bit unstable! Emphasize the most critical point, the continuous rise of the sun, the first wave of V-shaped rebound last night, and then the high-level oscillation, and there was no continuation of the rise of the sun last night. The bulls did not take off in one wave, but were held down again. But in the same way, don't think that the bulls are held down, and the bears will come. We still have to distinguish according to the range and strength. In many cases, the market maintains a oscillating range.
So how do you look at it today? Is there still hope for the bulls? From the perspective of correction, every big drop has poor continuity, and they all bottom out and rebound, just like gold fell to 3310 last night and violently rose to 3344, so there is a high probability that there will be continuation after the retracement today. On the one hand, even if it rebounds, it is also volatile, and the rebound and second decline is the continuation of the market. Therefore, currently pay attention to two points, the upward pressure 3355, and the downward strength and weakness dividing point 3325!
Gold: You can short at the rebound of 3350-55, defend 10 US dollars, and the target is 3330-25! If it breaks 3325, it will look down to the double bottom support of 3310. On the contrary, if it does not break, it can be shorted and look up to 3345-50!

Gold fluctuates downward, go long again when it falls back
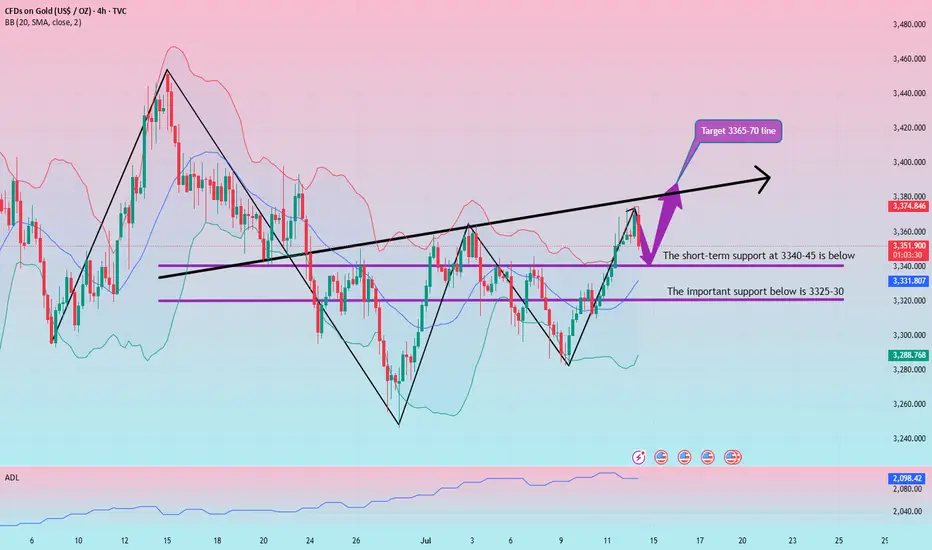
Gold is currently fluctuating downward. Although the trend is bullish, we must not rush into the market. The technical side needs to step back. We need to be cautious when going long. We need to grasp the entry position and step back to 3340-45 and then more!
From the 4-hour analysis, the short-term support below focuses on the neckline of the hourly line of last Friday, 3340-45, and the focus is on the support of 3325-30. The intraday step back continues to follow the trend and the main bullish trend remains unchanged. The short-term bullish strong dividing line focuses on the 3325 mark. The daily level stabilizes above this position and continues to follow the trend and bullish rhythm. Before falling below this position, continue to follow the trend and follow the trend. The main tone of participation. I will remind you of the specific operation strategy in the VIP group, and pay attention to it in time.
Gold operation strategy:
Gold goes long at the 3340-45 line when it steps back, and covers long positions at the 3325-30 line when it steps back, stop loss 3317, target 3365-70
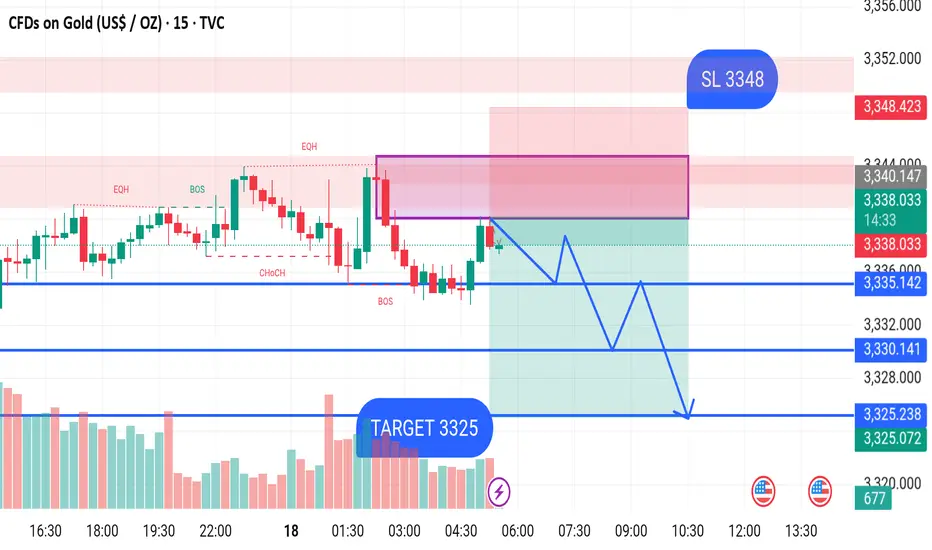
GOLD SELL M15Gold (XAUUSD) - 15-Minute Chart Analysis
This is a bearish short-term setup for Gold based on price action and key market structure levels.
Analysis Summary:
Entry Zone: Price has reached a supply zone around 3340, which is expected to act as a resistance.
Stop Loss (SL): Positioned at 3348, just above the supply zone to account for potential false breakouts.
Target (TP): The downside target is set at 3325, where previous support and volume interest converge.
Key Technical Levels:
Supply Zone: 3340 – 3348 (Red zone)
Resistance: 3340
Intermediate Support:
3335
3330
Final Target Zone: 3325
Structure Breakdown:
EQH (Equal Highs): Suggests a liquidity grab above recent highs.
BOS (Break of Structure): Indicates a shift from bullish to bearish structure.
CHoCH (Change of Character): Confirms potential trend reversal.
The expected price movement is a rejection from the supply zone, followed by lower highs and lower lows targeting 3325.
Trade Idea:
Sell around: 3340
Stop Loss: 3348
Target: 3325
Title: Gold (XAU/USD) Reversal Zone Trade Plan – 30M Analysis🔍
Chart Description & Full Breakdown
This 30-minute chart of XAU/USD outlines a potential bullish reversal trade from a key demand zone, identified by volume profile and historical price reaction. The analysis is built on confluence between price structure, volume imbalance, and risk-reward alignment.
📈
Analysis Summary:
🔴
Zone Highlight:
Marked Zone is a clear liquidity sweep / demand block between $3,319 – $3,340.
Price is hovering just below POC (Point of Control), where the most volume has transacted.
This area acted as prior support multiple times and is likely to draw in buyers again.
🛑
Stop Loss:
Set below the last major swing low: $3,312.
Beneath the volume gap and right under the high-volume support shelf, protecting against downside flushes.
🟢
Take Profit Levels:
TP1: $3,357 – First key volume shelf and local resistance.
TP2: $3,394 – Near-term swing high and high-volume node on the upper side.
🎯
Strategy & Meaning Behind It:
You’re playing a retest of the previous demand zone, paired with a low-risk reversal idea.
Why this works:
Strong bullish imbalance on the left of the chart.
Consolidation broke down but failed to follow through aggressively.
Buyers showed volume on recent touches of the zone.
Multiple timeframe confluence from the broader bullish setup.
💡
Execution Plan:
Entry: As close to $3,323 – $3,330 as possible.
Stop Loss: Tight below $3,312 to protect capital.
Target Profit Zones: Use volume profile to take partials at TP1 and let runners go to TP2. @BandMangfo
