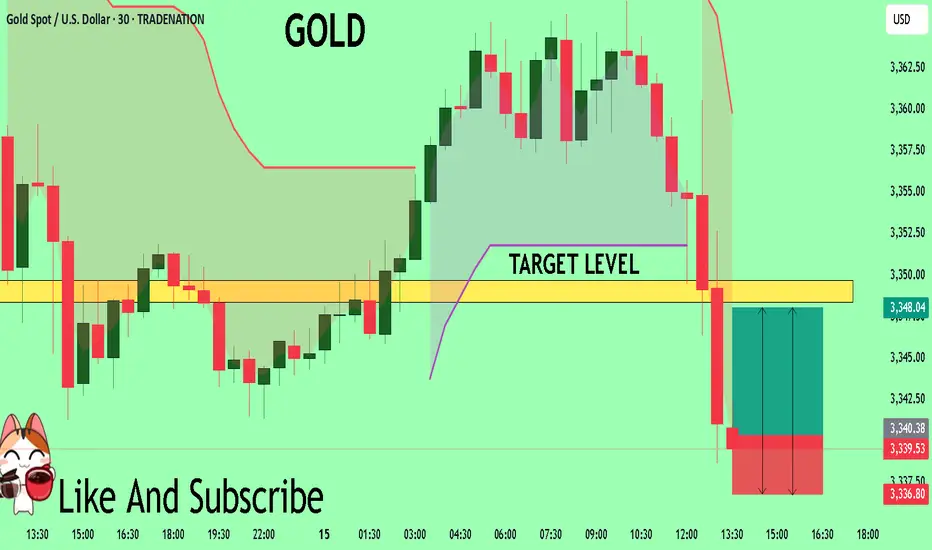
GOLD The Target Is UP! BUY!
My dear subscribers,
GOLD looks like it will make a good move, and here are the details:
The market is trading on 3340.39 pivot level.
Bias - Bullish
My Stop Loss - 3336.8
Technical Indicators: Both Super Trend & Pivot HL indicate a highly probable Bullish continuation.
Target - 3348.3
About Used Indicators:
The average true range (ATR) plays an important role in 'Supertrend' as the indicator uses ATR to calculate its value. The ATR indicator signals the degree of price volatility.
Disclosure: I am part of Trade Nation's Influencer program and receive a monthly fee for using their TradingView charts in my analysis.
———————————
WISH YOU ALL LUCK
CFDGOLD trade ideas
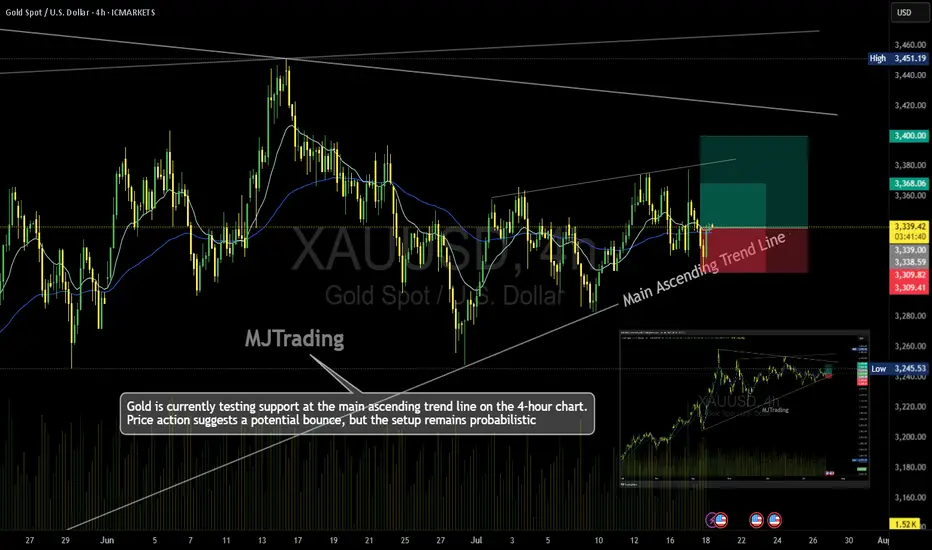
Gold (XAU/USD) – 4H Time Frame Trade Idea📈MJTrading:
Gold is currently testing support at the main ascending trend line on the 4-hour chart. Price action suggests a potential bounce, but the setup remains probabilistic—ideal for traders who operate on higher time frames and manage risk with discipline.
🔹 Trade Setup
Entry: 3340
Stop Loss: 3309
Take Profit 1: 3368
Take Profit 2: 3400
🔍 Technical Context
Price is respecting the long-standing trend line, hinting at bullish continuation.
Risk-reward ratio is favorable, especially for swing traders.
A break below the trend line invalidates the setup—hence the tight SL.
⚠️ Note: While the trend supports upside potential, failure to hold the trend line could trigger deeper retracement. Trade the probabilities, not the certainties.
In case it's not shown properly on your monitor because of different resolutions:
Psychology Always Maters:
#MJTrading #Gold #XAUUSD #Trend #Trendline #Forex #Chart #ChartAnalysis #Buy #Long
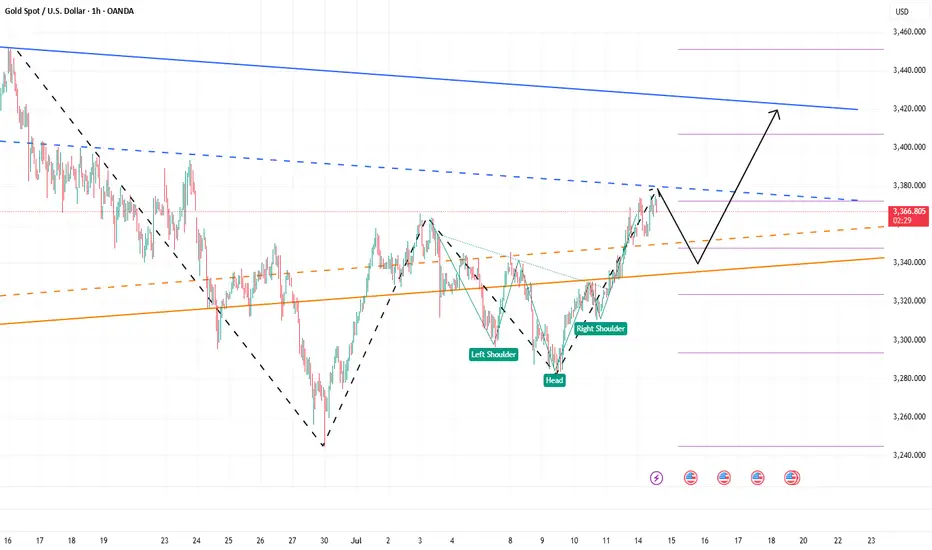
Gold on it's way back up!After finishing the descending broadening wedge break out, Gold got stopped short by the previous weekly high. It should only be knocked down to the main trendline it's been bouncing off of lately and then head back up to break that previous weekly high again.

Gold still has room to pull back, be brave and short gold!Gold continued to rebound today, and we also successfully gained 150pips profit in long gold trading. However, although gold is currently maintaining its upward trend, the rebound strength of gold is not strong during the European session, and it has repeatedly touched 3375 and then fell back, proving that there is still some resistance above. In my previous trading point of view, I also emphasized that gold is under pressure near 3380 in the short term. In addition, from a technical perspective, today's intraday high is limited to 3395.
So in order to dump the bullish momentum so that it can break through 3380 more smoothly, or even continue to above 3340, gold will inevitably have a retracement in the short term. So when most people in the market are still waiting for a retracement to go long on gold, I will definitely not waste the opportunity of gold retracement in vain.
So for short-term trading, I will consider shorting gold appropriately in the 3375-3395 area, with the target looking at 3360-3350. After gold falls back as expected, we might as well consider going long on gold at a low level.
my imagination about the future of the XAUUSDI'm sharing with you my trading opinion with the improved Elliott Wave. If the market enters the zone, it's likely to reach the zone.
If not, the second scenario will be respected. I'd like to have your opinion.

Gold Analysis and Trading Strategy | July 14✅ On Friday, gold prices surged strongly, successfully breaking through the key resistance level of 3345, which pushed the price higher and hit our take-profit target at 3365. The price remains strong, indicating that bullish sentiment continues to dominate the market. However, in the upcoming trades, we need to watch for a secondary pullback to base our next moves on.
✅ From a short-term perspective, if gold fails to break through the resistance zone at 3392-3400 next week, a double top pattern may form, putting pressure on the price. This could lead to a correction. Therefore, pay close attention to the fate of this resistance zone. A breakout above it may push the price higher, while a failure could result in a pullback.
✅ On the daily chart, the Bollinger Bands are starting to narrow, signaling that the current consolidation phase is about to end, and a new trend may emerge. Overall, after two months of consolidation, the probability of a bullish breakout is high, and we expect gold to continue rising in the coming days.
✅ On the 1-hour chart, the price remains in a strong bullish trend. Although the pullbacks have been small, we should not get complacent. Even in strong markets, there’s always a risk of deeper corrections. To avoid chasing prices too high, it's recommended to wait for a secondary pullback before making a decision.
🔴 Upper Resistance: The key resistance zone is currently between 3392-3400. If the price breaks through this area, it may continue to rise, but if not, there’s a risk of a pullback.
🟢 Lower Support: The first support is at 3340, which is a crucial point for the bullish-to-bearish transition. If the price declines further, the second support level is around 3330.
✅ Trade Strategy Reference:
Overall, we expect a pullback opportunity for gold next Monday. The short-term strategy should focus on buying during pullbacks and selling on rebounds. Pay close attention to the resistance zone at 3392-3400 and the support zone at 3340-3330. If the price retraces to 3345-3340, consider buying.
🔥 Reminder: Trading strategies are time-sensitive and should be adjusted in real time based on market conditions, especially after key support or resistance levels are broken. If you need more accurate and timely trading signals, feel free to reach out to me directly!
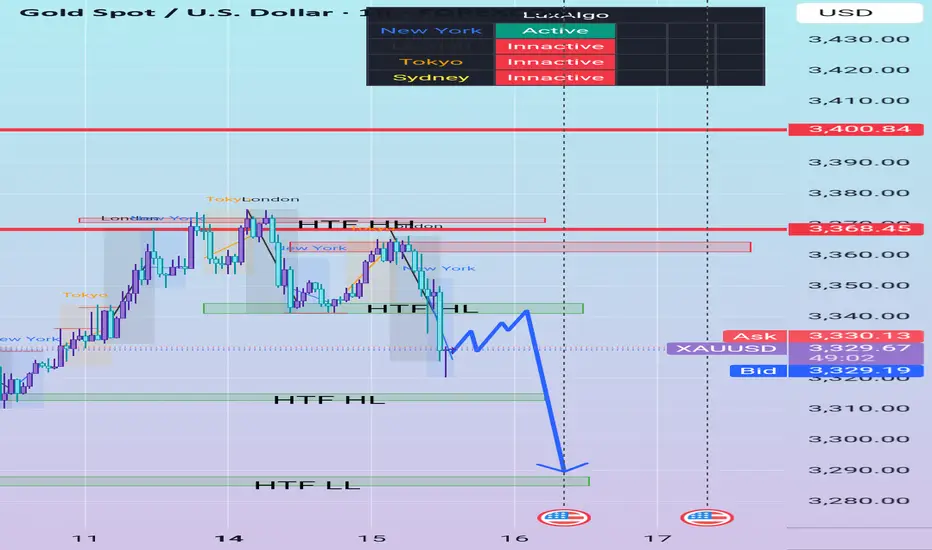
Bearish Continuation Idea on XAU/USDTimeframe: 1H
Session Context: Currently in New York, with London having just closed. Liquidity sweeps from London/NY overlapping zone are in play.
Step 1: Indication
HTF structure broke bullish to bearish with a clear break below a HTF Higher Low (HL) around 3,343–3,345.
This confirms Indication of bearish intent as market structure shifted from bullish → bearish.
The recent Swing High (3,368) was followed by strong selling momentum, showing institutional interest near previous liquidity pools.
Step 2: Correction
Price has retraced to test minor demand around the previous HL zone (green box).
Expecting liquidity collection above this area to trap late buyers and induce sellers.
The market is currently in Correction—a necessary pause after the break in structure to rebalance orders before continuation.
Step 3: Continuation Projection
If price respects the 3,343–3,345 correction zone and fails to reclaim the HTF HL:
Expect a lower high to form.
Entry would be ideal on a 5M–15M confirmation inside this corrective structure (lower timeframe BOS or SMC entry).
Targeting the HTF Lower Low (LL) at ~3,290, with potential for extended move toward 3,275 if NY volatility sustains.
Summary
Bias: Bearish
Reason: Structure Break (Indication), Pullback (Correction), Anticipating Downside Continuation
Confluences:
HTF Structure Break
Previous liquidity sweep from London
NY session volatility
Correction stalling beneath broken HL
Invalidation: A clean 1H close above 3,345–3,348 would invalidate the bearish bias and suggest a deeper retracement or reversal.
bulish on gold 3389currently no momentom downward.
breakout 3315 more potential riding on sell mode.

XAUUSD Long OpportunityXAUUSD is bullish per the 4 hour and 1 hour timeframe with continued bullish momentum coming out of the fundamentals around tariff uncertainty. There is clear bullish market structure.
XAUUSD is currently sitting on the pivot level of $3350 (Resistance turned support) after a retracement prior for the NY opening bell which gives rise for a long opportunity from this level towards the next Pivot point at $3391.
On the hour timeframe, price is trading above the 50 and 200 SMA and is currently sitting upon the 21 SMA which XAUUSD has used push point from in the past trending markets. RSI is currently sitting in a sweet spot region of the RSI between 45-55 indicating this is a valid retracement and price is looking to turn bullish again soon.
This provides 4 points of Bullish confluence within the momentum in favour of further bullish movements

GOLG Gold analysis on the 1-hour time frame in the Wyckoff style, which is in a changing trend, thanks to the esteemed professor, Mr. Ramtia Siddiqui COINBASE:GOLQ2025

XAUUSDThe current short setup on XAU/USD (Gold vs US Dollar) highlights a potential downside move from the entry zone of 3336–3340, targeting progressive profit levels down to 3313. This trade suggests that gold is encountering resistance in the specified entry area, likely due to previous price rejections, supply pressure, or alignment with a key Fibonacci retracement level or bearish trendline. The stop loss at 3352.00 is positioned above a key resistance zone, offering a buffer of approximately 12–16 points, which helps guard against short-term volatility or false breakouts before price possibly resumes its downward trajectory.
The risk-to-reward ratio on this setup is favorable, potentially offering 2:1 or better depending on entry execution. Moreover, the setup allows for flexibility; traders can trail the stop once TP1 is hit to reduce risk exposure and lock in profit. It's crucial to monitor price action closely at the entry zone—any bullish breakout above 3344–3348 with volume could invalidate the setup, while rejection candles or long upper wicks would confirm bearish strength.
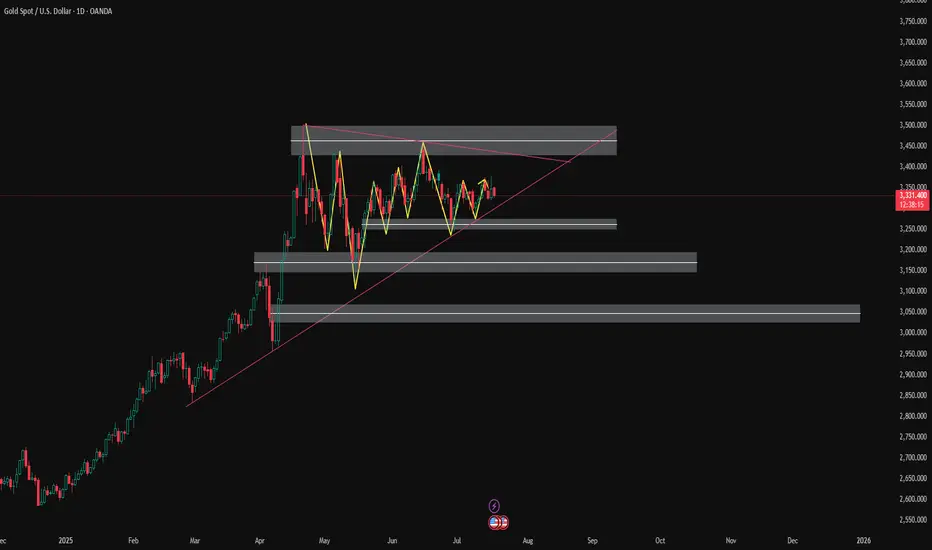
XAU/USD Daily Technical Outlook: Navigating Key Price LevelsThe Dominant Trend Profile
Gold has clearly maintained a robust uptrend on the daily timeframe since April, consistently finding dynamic support along a prominent, upward-sloping trendline. This strong underlying bullish structure has guided price action higher, forming a series of higher lows and highs within this established channel.
Immediate Price Dynamics & Overhead Resistance
The current price action indicates that Gold is encountering significant overhead supply, specifically challenging a critical zone labeled "Current Strong Resistance." This area appears to be a key juncture, where the market is consolidating, and a decisive break above this level would be required to signal a continuation of the rally.
Potential Bullish Continuation
Should buyers successfully overcome the immediate "Current Strong Resistance" zone, the pathway to higher valuations opens up. The next significant hurdle for Gold would be the "Next Resistance" level positioned around 3451.31, with the ultimate long-term target being the prior "All time high" at 3500.10.
Critical Support Zones & Downside Triggers
Conversely, the chart highlights a critical horizontal support line which, if broken to the downside, would serve as a key bearish trigger. Below this immediate support, the "3250 Key Area to focus" represents a substantial demand zone, followed by additional, deeper green-shaded areas that would come into play as important support levels where buying interest might re-emerge should the price decline further.
Disclaimer:
The information provided in this chart is for educational and informational purposes only and should not be considered as investment advice. Trading and investing involve substantial risk and are not suitable for every investor. You should carefully consider your financial situation and consult with a financial advisor before making any investment decisions. The creator of this chart does not guarantee any specific outcome or profit and is not responsible for any losses incurred as a result of using this information. Past performance is not indicative of future results. Use this information at your own risk. This chart has been created for my own improvement in Trading and Investment Analysis. Please do your own analysis before any investments.

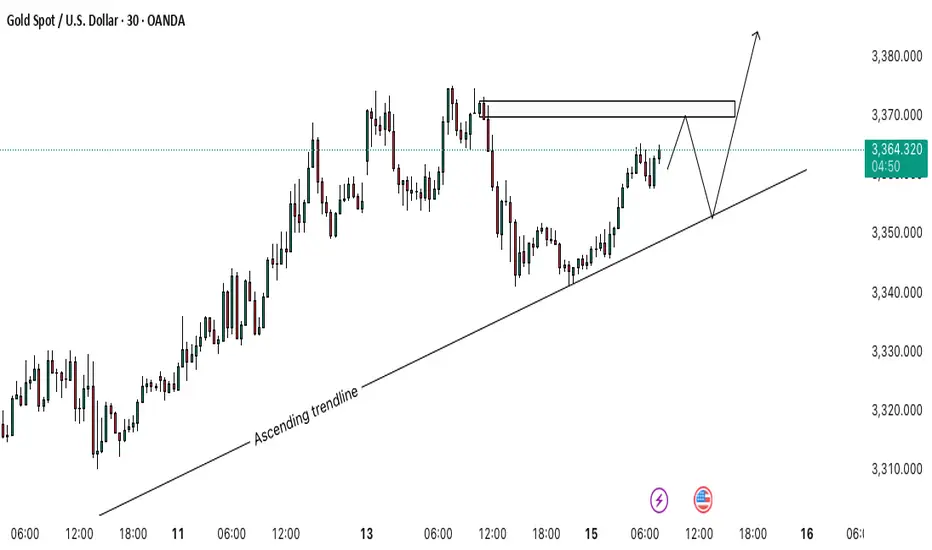
Gold (XAU/USD) – Bullish Continuation SetupGold is moving within an ascending trendline, showing strong bullish momentum. Price is approaching a Bearish Order Block near 3,370, which may trigger a short-term pullback 📉.
If price rejects from this zone and retests the trendline (around 3,355), it could offer a high-probability long setup for a continuation move toward 3,380+ 📈🚀.
🔍 Key Levels:
Resistance: 3,368–3,370 (Bearish Order Block)
Support: 3,355 (Trendline area)
💡 Trading Idea:
Look for price action confirmation near the trendline for potential buys. Break above the order block could fuel further upside.
Gold continues to rise after keeping low and breaking high
Last Thursday and Friday, I repeatedly mentioned the position of 3344 to my members. As a strong resistance position in the early stage, every time the price falls below the low point, the pressure to find the bottom and rebound is this area, and then continue to break the low under pressure. This time, we emphasize that breaking through and standing firmly on 3344 is the key. If it can break through and stand firmly, the next resistance is 3358, followed by 3373.
Now the price has broken upward as expected, completing the qualitative change. The next step is to look at the switching of space. Keep low and break high to see acceleration. After breaking the low point, consider sweeping.
Specific key points are expanded:
1. The daily line pattern is still closing and flat. The lifeline is the space switching point in the past one or two months, which will determine the subsequent market space rhythm. At present, the price has successfully broken through the lifeline and switched upward to enter the lifeline to the upper track. 3339-3396
Then, in the case of subsequent market holding the lifeline, maintain the upper range sweep, yes, it is still the rhythm of sweeping, just change the space
2. The four-hour pattern opens slightly upward, pointing to the upward direction
Starting from the lower track 3283 of the squat probe pattern, it has risen steadily. After repeatedly determining the lifeline position 3310 area, it will start to rise further and the pattern will open upward
The lifeline position coincides with the support 3330-3328 area repeatedly determined last Friday, and together they become the last defensive dividing line for the bulls to rise
3. The double-line interval 3330-3325 of the hourly chart has become a space switching area, which previously suppressed the price from falling further, and now it has turned into support, and will rely on the price to further rise Step up, pay attention to the role of the dividing line
4. Maintain the idea of switching with the same profit space, start from 3283 and calculate 3313, then 3328, then 3343, then 3358, and finally 3373, and then 3388, and 3403 (here needs to be highlighted)
5. As shown in the figure, the purple large channel range is swept, the space range is about 100-150 US dollars, this wave of increase is about 100 US dollars, and there is still room to pay attention to. The upper track of the channel overlaps with the upper track of the daily line pattern in the 3396-3400 area, and the 3403 position mentioned above together become the next space dividing line area
In summary, for the current gold, it is still in the rising stage, and the idea remains low and bullish. Pay attention to the process The intensity and amplitude of the adjustment can be squatted to gain leverage, or sideways for a period of time to gain space. Both are ways of correction. After the correction is completed, continue to be bullish and break through.
Referring to this idea, we gave a long position from 3358-3356 in the afternoon. As expected, it sprinted to 3375 as of press time. Those who keep positions should pay attention to the upward loss point, and then pay attention to further rise.
Of course, today's trend will be more tiring, so there is still an opportunity to step back and buy low. Pay attention to the 3364-3362 position to continue to buy low (aggressive 3366 can start), stop loss 3355, target 3380-3388
Another extreme sweep needs to pay attention to the 3342-3339 and 3330-3328 areas. This needs to be determined according to the situation. Pay attention to 3388 and 3396-3403 when switching upward.

XAUUSD Approaching Breakout Zone – Watch for Confirmation GOLD (#XAUUSD) – High-Probability Bullish Continuation Setup
Gold is maintaining its strong bullish structure on the daily timeframe, having recently respected a rising trendline, confirming ongoing buyer interest and market confidence.
Currently, price action is forming a well-defined Cup & Handle pattern, which is considered a high-probability bullish continuation formation. The market closed last week near the neckline resistance around the 3367 level, showing signs of pressure building for a breakout.
Key Technical Insight:
A daily candle close above 3367 will confirm a breakout of the neckline and validate the bullish setup. However, for entry confirmation, a clean breakout and daily close above 3380 will provide a stronger technical signal and reduce the likelihood of a false breakout.
Technical Summary:
Chart Pattern: Cup & Handle
Trend Structure: Rising Trendline (Confirmed)
Neckline Resistance: 3367
Breakout Entry Level: 3380+
Bias: Bullish
Timeframe: Daily

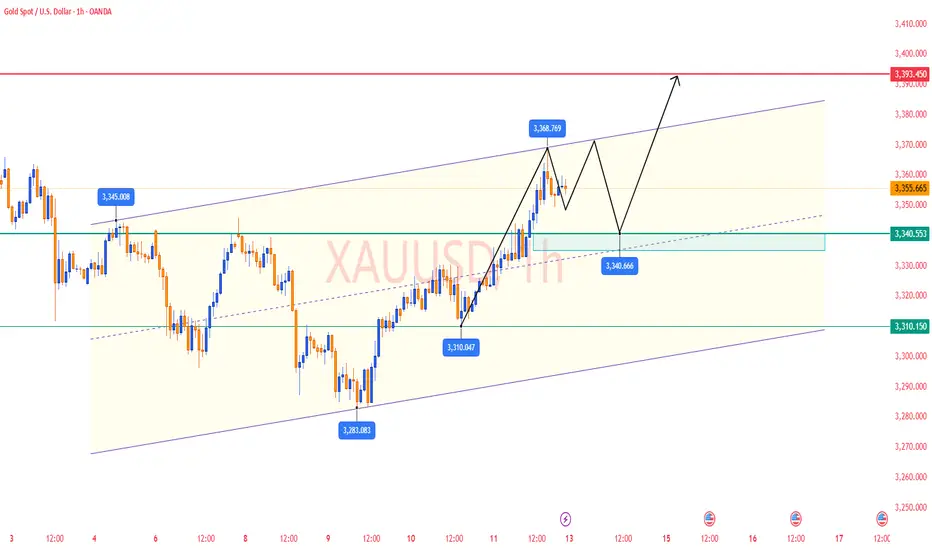
XAU/USD: Bullish Rebound from Support ZoneMarket Overview:
Gold tested and respected a key support zone around 3340–3345, aligning with the 144-period EMA and a prior accumulation area. The market is showing signs of bullish recovery, with a potential ABCD continuation pattern suggesting further upside toward key resistance levels.
Technical Signals & Formations:
— Rising trend channel remains intact
— Correction found strong support at demand zone
— EMA(144) acts as dynamic support
— Emerging bullish structure suggests continuation toward higher highs
Key Levels:
Support: 3340–3339, 3282
Resistance: 3366, 3375, 3394, 3410
Scenario:
Primary: holding above 3340 may trigger a rally toward 3375, 3394, and 3410.
Alternative: a break below 3339 would shift focus toward the 3282 zone.

Idea AITitle: XAU/USD – 4H: Bullish Demand Bounce Setup
Description:
- 📍 Daily Supply Zone (Resistance): **3,380–3,390**
- 📍 Daily Demand Zone (Support): **3,330–3,320**
- 🔍 Trendline (4H Higher Lows): Connect swing low ~3,290 to ~3,330
- 🎯 Fibonacci (for confluence): Low ~3,280 → High ~3,370
- ✅ Entry: Look for bullish confirmation (wicks, engulfing candle) in **3,330–3,320** zone
- 📈 Target 1: 3,435 (mid-swing), Target 2: 3,480 (swing high retest near 3,500)
- 🚫 Invalidation: Close below 3,315
#XAUUSD #Gold #TradingView #Structure #DemandSupply #4H

FOR KHANsome leves we will wait to tap and we will go for long and in some zones we wait for pull back to make a short postion
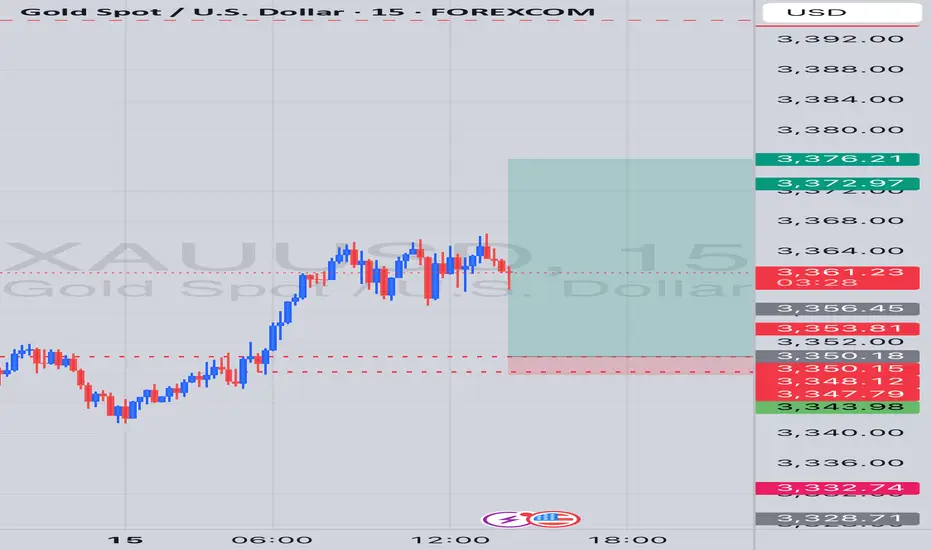
XAUUSD Short Based on a Fakeout + Rejection + Retrace Strategy💡 Strategy Flow
I'm seeing:
1. Fakeout – Price broke above resistance (3349–3350) and wicked into 3368–3372.
2. Rejection – Price quickly fell back below the resistance zone (classic bull trap).
3. Retrace to resistance – Price has now returned to the 3349–3350 zone, which is likely acting as new resistance again.
✅ Current price is sitting at the retrace area, after the initial rejection.
---
🔮 What should happen next?
According to this strategy, the next expected move is:
🔻 Rejection from resistance ➝ Bearish continuation
In detail:
> Price should fail to break resistance again.
> Sellers should step in around this level.
> If valid, price should drop, targeting:
🔹 Conservative TP: 3280
🔹 Aggressive TP: 3241.5
---
🎯 Entry Setup
Type Entry Stop Loss Take Profit Risk-Reward
Conservative 3349.0 3376.5 3280.0 ~1:1.6
Aggressive 3339.5 3378.5 3241.5 ~1:2.5
📍 Entry can be confirmed with bearish rejection candle on the resistance retest.
📈 Targeting previous swing low and major support zone around 3246–3247.
---
Symbol:
$BYBIT:XAUTSDT.P OANDA:XAUUSD
---
🧠 Strategy Logic:
This is a Smart Money-style trap play, where liquidity is swept above a well-known resistance, then price rejects and retraces back for a high-probability entry.
This fakeout–retest–drop sequence is deadly when aligned with market structure and zones like this.
---
🏷️ Hashtags:
#XAUTUSDT #XAUUSD #SmartMoney #LiquidityGrab #PriceAction #Fakeout #Retest #BearishSetup #BreakAndRetest #TradingView #SMC #TechnicalAnalysis #Forex #Crypto #StopHunt
---

Last resort buy’s concept ?Trade Journal Entry – XAUUSD (Gold Spot)
Date: July 15, 2025
Platform: TradingView (Demo Account)
Timeframe: 4H
Direction: Long
Status: Active trade under review / possible re-entry
Key Levels
- Sell-side liquidity tapped: ~3,340–3,345
- Support zone (mitigation block): ~3,316–3,310
- Last resort buy area: ~3,283
Market Context
Clear Break of Market Structure (BMS) confirming bullish bias.
Price swept recent sell-side liquidity above 3,360, failed to hold, and sharply pulled back.
Price is now entering a mitigation zone, sitting above the major buy-side liquidity zone and last resort demand.
Multiple liquidity layers marked below current price — good confluence for a reaction if structure holds.
Trade Rationale
Scenario A: If price respects ~3,316–3,310 zone and forms bullish engulfing/reversal, consider re-entry.
Scenario B: If price breaks deeper into 3,283 zone with SFP (swing failure pattern) or V-reversal, it's a last-chance long from premium demand.
Trade Plan
Watch for bullish reversal candle or lower timeframe BOS (M15) inside 3,316–3,310 zone.
If entered, SL below 3,283. TP remains at prior high ~3,492.
Manage risk carefully — only one more key demand zone below.
Emotional Reflection
Felt confident on initial entry, but market invalidated short-term structure. Now reassessing calmly — waiting for re-entry confirmation without chasing.
Reflection Questions
- Did I exit early enough once price showed failure to hold above 3,360?
- Will I maintain composure and wait for structure confirmation in the new zone?
- Is my risk sized properly for this secondary attempt?


Gold Fibonacci for the weekGold respects a smooth Fibonacci for the week. The pair is moving within a range, therefore the market is expected to move within the Fibonacci.
