Short.With BTC.D at 65% and above (my target 72%), we reach the buy area below 0.06 easily.
Then we're gonna fly. Not willing to long only spot.
CFXUSDT trade ideas

Next stepFrom the historical chart data, we find that there were three historical waves that fell, three historical waves that rose, and three historical waves that remained, compounded, in order for the shape to be wxy.
*In principle, I am not a supporter of any direction, but I am only giving my point of view, which may be right or wrong. If the analysis helps you, then this is for you. If you do not like this analysis, there is no problem. Just ignore it. My goal is to spread the benefit. I am not one of the founders of the currency.

CFXUSDT | Sellers Still in ControlI’ve seen this pattern before. CFXUSDT is still under pressure from strong sellers , and nothing has shifted yet to flip the bias.
The red box remains a key resistance. Until that level is clearly broken and turns into support with a proper retest, there’s no reason to look bullish .
If you're patient and wait for structure to shift, you’ll avoid the traps most traders walk into.
“I will not insist on my short idea. If the levels suddenly break upwards and do not give a downward break in the low time frame, I will not evaluate it. If they break upwards with volume and give a retest, I will look long.”
This is how high win rates are built . Not by guessing, but by reacting to confirmation.
📌I keep my charts clean and simple because I believe clarity leads to better decisions.
📌My approach is built on years of experience and a solid track record. I don’t claim to know it all but I’m confident in my ability to spot high-probability setups.
📌If you would like to learn how to use the heatmap, cumulative volume delta and volume footprint techniques that I use below to determine very accurate demand regions, you can send me a private message. I help anyone who wants it completely free of charge.
🔑I have a long list of my proven technique below:
🎯 ZENUSDT.P: Patience & Profitability | %230 Reaction from the Sniper Entry
🐶 DOGEUSDT.P: Next Move
🎨 RENDERUSDT.P: Opportunity of the Month
💎 ETHUSDT.P: Where to Retrace
🟢 BNBUSDT.P: Potential Surge
📊 BTC Dominance: Reaction Zone
🌊 WAVESUSDT.P: Demand Zone Potential
🟣 UNIUSDT.P: Long-Term Trade
🔵 XRPUSDT.P: Entry Zones
🔗 LINKUSDT.P: Follow The River
📈 BTCUSDT.P: Two Key Demand Zones
🟩 POLUSDT: Bullish Momentum
🌟 PENDLEUSDT.P: Where Opportunity Meets Precision
🔥 BTCUSDT.P: Liquidation of Highly Leveraged Longs
🌊 SOLUSDT.P: SOL's Dip - Your Opportunity
🐸 1000PEPEUSDT.P: Prime Bounce Zone Unlocked
🚀 ETHUSDT.P: Set to Explode - Don't Miss This Game Changer
🤖 IQUSDT: Smart Plan
⚡️ PONDUSDT: A Trade Not Taken Is Better Than a Losing One
💼 STMXUSDT: 2 Buying Areas
🐢 TURBOUSDT: Buy Zones and Buyer Presence
🌍 ICPUSDT.P: Massive Upside Potential | Check the Trade Update For Seeing Results
🟠 IDEXUSDT: Spot Buy Area | %26 Profit if You Trade with MSB
📌 USUALUSDT: Buyers Are Active + %70 Profit in Total
🌟 FORTHUSDT: Sniper Entry +%26 Reaction
🐳 QKCUSDT: Sniper Entry +%57 Reaction
📊 BTC.D: Retest of Key Area Highly Likely
📊 XNOUSDT %80 Reaction with a Simple Blue Box!
📊 BELUSDT Amazing %120 Reaction!
📊 Simple Red Box, Extraordinary Results
I stopped adding to the list because it's kinda tiring to add 5-10 charts in every move but you can check my profile and see that it goes on..

SPOT CFX LONG 12.06.2025Pinning after exhaustion of sales.
💰I enter at the market price.
I'll let you know when I record it manually.
‼️Risk per trade: 1% of the allocated funds for spot trading.
Thank you!

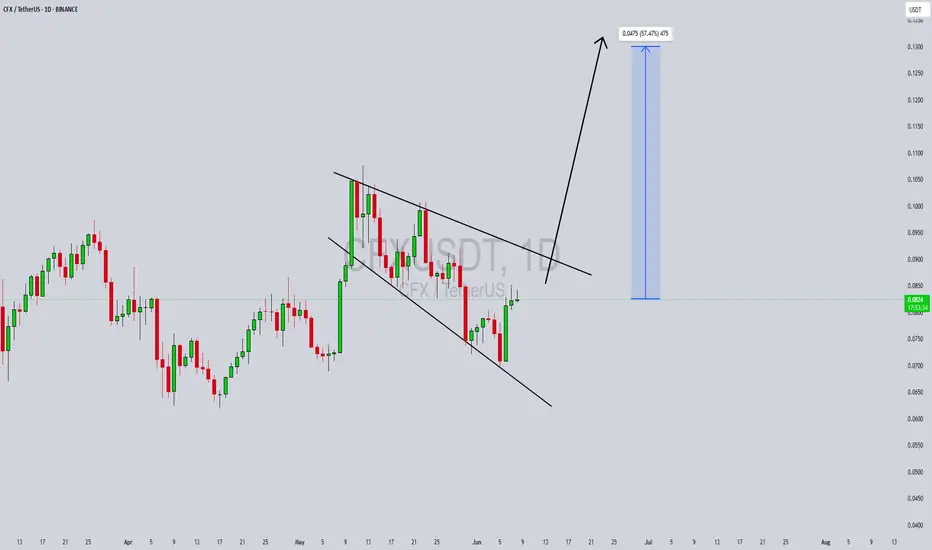
CFXUSDT Forming Falling WedgeCFXUSDT is showing signs of a strong bullish continuation as it emerges from a falling wedge pattern — a setup often considered a reliable reversal signal in technical analysis. As depicted in the chart, the price has been compressing within the wedge, gradually forming higher lows and now attempting a breakout from the resistance trendline. The recent green candles and growing volume suggest bulls are taking control, setting the stage for an upside move. With momentum building, traders could be looking at a potential 40% to 50% surge if the breakout sustains.
Conflux (CFX) has been gaining attention due to its unique position as a high-throughput, scalable blockchain that facilitates cross-border data and value transfer, particularly between China and the global crypto community. As regulatory clarity improves and Conflux continues to expand its ecosystem through partnerships and integrations, market sentiment has shifted in favor of the project. This renewed investor confidence is visible in the technical structure forming on the CFXUSDT chart, as smart money begins to accumulate.
The breakout target aligns with a previous high, indicating that this could be more than just a short-term rally. If volume continues to support the price action, CFX could rally toward the $0.12–$0.13 zone, which marks a critical resistance area. This creates a favorable risk-reward environment for both swing traders and position holders eyeing medium-term gains. Technical traders should watch for confirmation above the wedge and continuation candles backed by volume to validate the move.
Overall, CFXUSDT looks primed for a strong upward movement, supported by bullish technicals and increasing investor interest in the Conflux network. As the project remains fundamentally strong and gains traction in the Web3 space, this may be an opportunity to capitalize on a promising mid-cap altcoin.
✅ Show your support by hitting the like button and
✅ Leaving a comment below! (What is You opinion about this Coin)
Your feedback and engagement keep me inspired to share more insightful market analysis with you!
CFX/UsdtCFX/USDT — Gann Time & Price Confluence Zones
This is a 2-hour chart of CFX/USDT using W.D. Gann’s time and price forecasting methods. The analysis identifies key reversal zones based on both Gann angles and time cycles calculated from the Square of Nine.
🔷 Key Concepts:
Vertical Blue Lines = Gann Time Cycle Dates
Diagonal Lines = Gann Angles projecting trend and support/resistance
Horizontal Levels = Price zones from Square of Nine degrees, prior swing highs/lows, and Gann number clusters
📍 Highlighted Gann Price Levels:
0.0810 — Major upper resistance, extended Gann angle projection
0.0770 — Prior breakdown level, angle intersection
0.0730 — Current price area, Gann fan zone
0.0716 — Price cluster, potential resistance
0.0687 — Square of Nine level
0.0680 — Price/angle confluence
0.0643 – 0.0632 — Key support zone from multiple fan and horizontal overlaps
0.0610 — Deep Gann level support
0.0500 and below — Lower confluence support, only tested if current zones break
⏳ Upcoming Gann Time Windows:
May 31 – June 1, 2025 — First reversal window
June 2 – June 3, 2025 — Second time zone cluster
June 4 – June 5, 2025 — Final short-term window in current cycle
“Time is the most important factor in determining market movements.” – W.D. Gann
Gann used astrological degrees, mathematical cycles, and natural time laws to forecast changes in trend. This chart reflects those principles.
Purpose: This chart is intended to visualize reversal zones rather than signal direct trades. These levels are for observation and planning, not financial advice.

TradeCityPro | CFXUSDT A Wild Week of Volatility Ahead?👋 Welcome to TradeCityPro Channel!
Let’s dive in and analyze another altcoin in the market, CFX, which is likely to experience a highly volatile week ahead, offering great trading opportunities.
🌐 Overview Bitcoin
Before starting the analysis, I want to remind you again that we moved the Bitcoin analysis section from the analysis section to a separate analysis at your request, so that we can discuss the status of Bitcoin in more detail every day and analyze its charts and dominances together.
This is the general analysis of Bitcoin dominance, which we promised you in the analysis to analyze separately and analyze it for you in longer time frames.
🕒 Weekly Time Frame
CFX stands out as an older coin with prior bull-run experience. It’s trading above last year’s lows and hasn’t experienced steep declines.
Yesterday, we analyzed this coin briefly, but today, we’ll go into more detail. Unlike most altcoins that began their bullish moves from their lowest levels, CFX has already started its upward trajectory from 0.1219.
Fibonacci analysis shows that 0.1219 aligns with the 50% retracement level—a significant support both in Fibonacci terms and Dow Theory. After forming a range around this level and breaking the 0.1810 trigger, the coin moved toward its first target at 0.2596.
However, we were rejected at 0.2596 and even lost the critical support at 0.1087, dropping to the next support at 0.0647. Currently, it appears we’re pulling back to the key 0.1087 level.
📊 Daily Time Frame
On the daily chart, CFX was in a ranging box, forming higher lows. A breakout above 0.1851 was accompanied by a strong entry candle with buyer momentum, an RSI entry signal, and volume confirmation. Stop-loss was set at the daily low of 0.14.
If you followed this trigger, you’re likely in profit despite the current red daily candle. This correction is healthy, as an uptrend without pullbacks or red candles is often unsustainable.
After breaking the daily box between 0.1046 and 0.1230 and losing its support with an engulfing candle, we experienced a downward move to 0.0647. From there, sellers effectively exited the market, and buyers showed strength. After breaking 0.0823, we formed higher highs and lows. Now, after breaking 0.1046, we can consider buying for spot, with the main trigger being a break of 0.1230.
✍️ Final Thoughts
Stay level headed, trade with precision, and let’s capitalize on the market’s top opportunities!
This is our analysis, not financial advice always do your own research.
What do you think? Share your ideas below and pass this along to friends! ❤️

CFX/USDT BREAKOUT ALERT
CFX/USDT BREAKOUT ALERT
CFX/USDT has already broken out of the bull flag pattern and is showing bullish momentum. Since a bull flag is typically a continuation pattern, this breakout suggests the potential for further upside.
However, if the price drops back into the flag structure, it could turn out to be a fakeout. Watch closely to see if the breakout holds or fails.
Key point:
Sustained price action above the breakout = bullish confirmation
Drop back inside the flag = potential fakeout
Stay alert and manage risk accordingly.
#CFX/USDT#CFX
The price is moving within a descending channel on the 1-hour frame and is expected to continue lower.
We have a trend to stabilize above the 100 moving average once again.
We have a downtrend on the RSI indicator that supports the decline with a break below.
We have a support area at the upper limit of the channel at 0.0815.
Entry price: 0.0815
First target: 0.0788
Second target: 0.0763
Third target: 0.0740

CFX/USDTBINANCE:CFXUSDT
Almost +10% up ✅
TP2 hit on the ✅
More on the way 📈
Enjoy the gains—just don’t get too greedy 😉🚀
Disclaimer : Not Financial Advice

CFX SELL IDEA Price didn’t break the 1hr high
Price broke structure after mitigation
Selling at retest targeting the low that didn’t break the high
Full tp at 1hr low

CFX lower timeframe sell . Price didn’t break the last high acting as supply
. Price broke an inner low after mitigating the supply
.looking for a retest targeting the low leading to the mitigation as tp 1
.1hr low as full tp
NOT A FINANCIAL ADVICE ..just an idea

CFX Ready For Another Leg To The Upside?It has been a while since taking much interest in our favorite crypto projects. After massive gains straight out of the bear market most of that interest has sold off.
Previously we were targeting the 5 cent range and appear to be getting very close.
Current Trading Plan:
Looking at proportional relationships in the price chart to gauge potential moves we can see the average range size seems to be about 400%. After completing a traditional ABC pattern it has moved into our potential accumulation window. Currently looking to accumulate and hold for potential 10x IF the entire market follows.

CFX ANALYSIS📊 #CFX Analysis
✅There is a formation of Falling Wedge Pattern on daily chart with a good breakout and currently retests from the major resistance zone🧐
Pattern signals potential bullish movement incoming after a successful retest
👀Current Price: $0.0775
🚀 Target Price: $0.1210
⚡️What to do ?
👀Keep an eye on #CFX price action and volume. We can trade according to the chart and make some profits⚡️⚡️
#CFX #Cryptocurrency #TechnicalAnalysis #DYOR

CFXUSDT UPDATECFXUSDT is a cryptocurrency trading at $0.0788, with a target price of $0.1400. This represents a potential gain of over 80%. The technical pattern observed is a Bullish Falling Wedge, indicating a possible trend reversal. This pattern suggests that the downward trend may be coming to an end. A breakout from the wedge could lead to a significant upward movement in price. The Bullish Falling Wedge is a positive indicator, signaling a potential price surge. Investors are showing optimism about CFXUSDT's future performance. The current price may present a buying opportunity. Reaching the target price would result in substantial returns for investors. CFXUSDT is positioned for a potential breakout and significant gains.

CFXUSDT 1DCFX ~ 1D Analysis
#CFX Buy gradually after successfully penetrating this resistant line with a short -term target of at least 10%+.

Continuation play on CFXBitcoin is setting up a continuation on the 1H, CFX is also showing the same type of price action. Looking to take the double top as a risk entry on the 5M. Targeting 90% of the rising wedge

#CFX/USDT#CFX
The price is moving in a descending channel on the 1-hour frame and is expected to continue upwards
We have a trend to stabilize above the moving average 100 again
We have a descending trend on the RSI indicator that supports the rise by breaking it upwards
We have a support area at the lower limit of the channel at a price of 0.0950
Entry price 0.1000
First target 0.1033
Second target 0.1073
Third target 0.1123

CFXUSDT SHORT!!!#CFX/USDT
Entry zone : 0.1217254 - 0.1186527
Targets : 0.1175831 - 0.1152077 - 0.1128323 - 0.1104569 - 0.1080815 - 0.1057061 - 0.1033306 - 0.1009552
Stop loss :0.1264526

CFX roadmap (3D)By analyzing the complete CFX data, it can be observed that wave C of a larger structure has been completed.
Wave C formed a triangle, and its final wave, wave E, has also been completed.
It is expected to remain bearish in the long term and eventually deliver good returns from the green zone in the future.
A daily candle closing above the invalidation level will invalidate this outlook.
For risk management, please don't forget stop loss and capital management
Comment if you have any questions
Thank You


#CFX/USDT #CFX
The price is moving in a descending channel on the 1-hour frame and is adhering to it well and is heading to break it strongly upwards
We have a bounce from the lower limit of the descending channel, this support is at a price of 0.1455
We have a downtrend on the RSI indicator that is about to be broken, which supports the rise
We have a trend to stabilize above the moving average 100
Entry price 0.1500
First target 0.1570
Second target 0.1660
Third target 0.1743

#CFX/USDT#CFX
The price is moving in a descending channel on the 4-hour frame and sticking to it well
We have a bounce from the lower limit of the descending channel, this support is at 0.1242
We have an upward trend, the RSI indicator is about to break, which supports the rise
We have a trend to stabilize above the moving average 100
Entry price 0.1485
First target 0.1621
Second target 0.1770
Third target 0.1955
