Combo correction wave WXY | $0.13Daily chart
BINANCE:CFXUSDT has soared and completed impulse wave at 0.4876 and it's trading around 0.1904 now.
CFX is in the combo correction wave, I think so. On the chart, it shows a first leg (wave A) completed at 0.1665 and happening wave B then wave C
I expect wave C will down around 0.135 - 0.125
Wait and see next move
CFXUSDT trade ideas

Conflux CFX: Capturing the China Narrativesomething is going on here.
Hong Kong is allowing retail crypto trading starting in June. It is known that this is a pilot for releasing mainland China. Hong Kong itself has shown serious interest in all tradeshows and crypto conferences. My opinion is that the liquidity for this bull market comes from the Eastern World.
Conflux is building something and I am very bullish on this chain's prospects over many other tokens that could fall into this narrative.

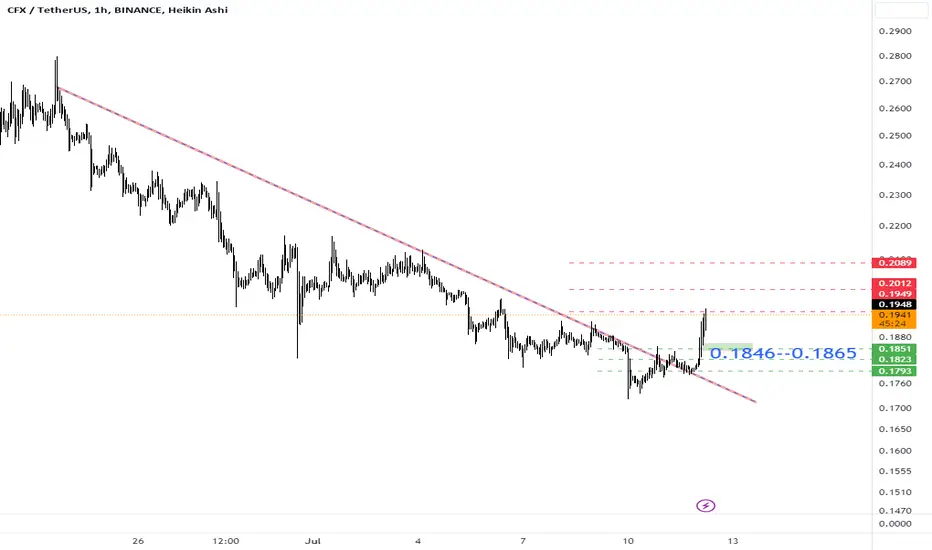
CFXUSDTFive upward waves were made, and a complex overlapping correction occurred for them. It is possible that we will see another five quick and short rising waves to end the large corrective rise of the currency.
Note: the analysis fails if the price closes below an area 0.17 usdt

CFXUSDT BULLFLAG BREAKOUTHello Tradingview friends! Make sure to LIKE and FOLLOW for more chart ideas! Today i am
bringing you my view on CFXUSDT and the bull flag i believe CFXUSDT has formed and is
showing signs of strength and a potential breakout!
What does bull flag mean?
A bull flag is a bullish chart pattern formed by two rallies separated by a brief consolidating
retracement period. The flagpole forms on an almost vertical price spike as sellers get
blindsided from the buyers, then a pullback that has parallel upper and lower trendlines, which
form the flag.
Thanks. Liquidmex

CFXUSDT bet lowCFXUSDT bet this is point to return
1) Volume is coming after lowest volume in 2-3 day ago.
2) In TF day make pattern little double bottom
3) CFX is sideway for 3 months after news partner with china telecom
4) In Neowave is maybe Irregular flat (Storng B - C failure) if correct price it will be explode but it will comfirm if price break high in big picture
5) Stoploss is set in low of double bottom
6) Rsi is make divergence

cfxAfter breaking its resistance line, it entered an upswing, and now it is in a resistance range, in case of correction, the green box and green lines can provide support.
If the pattern is formed, we will get a flight ticketThe CFX currency is forming a corner pattern to rise, but this pattern has not been formed yet. In case of breaking the resistance range that was mentioned in the video, we can expect to touch the target up to 40%. Two important support and resistance ranges were said in the video in case of failure. Any of these two ranges can have a safe entry to this currency

CFX reversal soonwe are looking for a break through of the current resistance we have been underlaying the past few days ...Judging by a few indicators i believe we may need to push lower first as indicated on my chart..... plancton0618 inspired my analysis

Long cfxusdtMega rally at the complete of the falling wedge wave e.. a break above 0.1871 will signal a buy. Weekly close is important

Mega rally incoming for cfxusdtA confirmed break above 0.1871 will signal that the bottom is in from the falling wedge.. weekly close will be important for this coin 💰

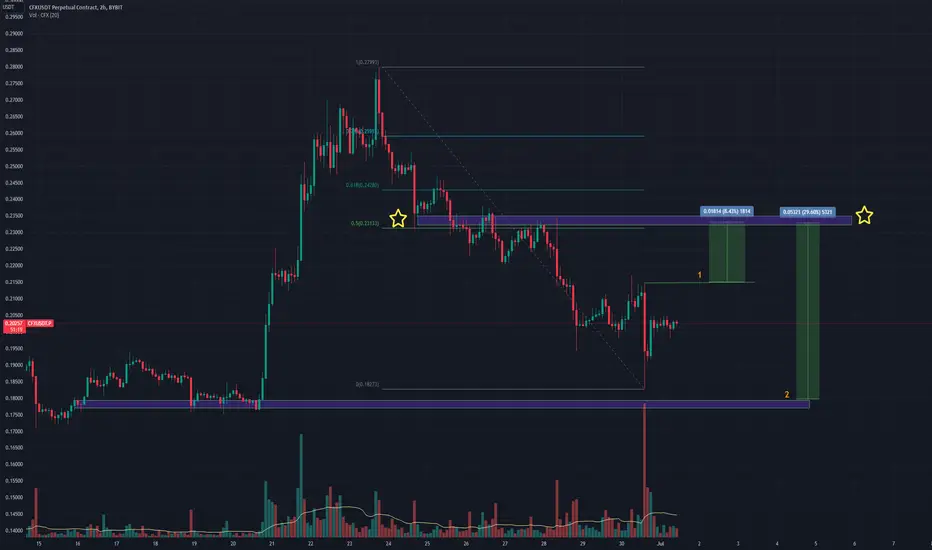
CFXUSDT wants the daily liquidty?
CFXUSDT is undergoing a crucial phase as it tests the key level on the 4-hour timeframe, situated just above the daily liquidity zone. This key level holds significant importance as it has the potential to influence the price's future trajectory.
At the moment, the price is encountering resistance at this key level, indicating that buyers are finding it challenging to push the price higher. However, according to Plancton's Rules, there is a possibility that the price might break through this resistance and grab new liquidity on its way to the daily support level.
Should the price manage to surpass the resistance, it could attract additional buyers, leading to an upward movement towards the daily support level. This potential liquidity grab is an opportunity for traders to open a new position based on Plancton's Rules, which suggests taking advantage of such market dynamics.
–––––
Follow the Shrimp 🦐
Keep in mind.
🟣 Purple structure -> Monthly structure.
🔴 Red structure -> Weekly structure.
🔵 Blue structure -> Daily structure.
🟡 Yellow structure -> 4h structure.
⚫️ Black structure -> <= 1h structure.
Follow the Shrimp 🦐


CFXIn my opinion, the CFX cryptocurrency has rather good prospects. The global growth of this cryptocurrency, in my opinion, can begin when Hong Kong actually becomes the capital of the crypto industry. As it is predicted today. CFX has huge support from China! And it is this fact that can give this cryptocurrency very huge growth prospects. And for now, I will trade this coin for futures. Because there was a breakdown of the market structure and the price is close to the support level, from which I will enter the deal. It should also be taken into account that there was a local growth in altcoins, which CFX has not yet shown. Most likely, he will now reach for the rest of the coins. And given the periodic increased volatility of this asset, you can count on not a weak movement and profit.

CFXUSDT.P LONGCFXUSDT.P LONG
SWING ENTRY
Price just bounced from its support and consolidation area and will now attempt to test the trendline resistance and the resistance areas above.
ENTRY
.2090
SL
.1630
TP
.2800
.3490
.4480
.4888
Always manage your risk! Happy Trading!
#TYOR #DYOR

CFX on Bullish Buy it on CMP thats how you degen LSE:CFX on a Sunday
CFX could also break up and out

Probable long analysis and signal for CFX cryptoProbable long analysis and signal for CFX crypto
In the two-hour time frame, at the bottom of the chart, you can see a good over-block area.
When the price reaches that area, we can enter a long position with great risk and reward.
Of course, you can enter a long position from the current price.
If you place a fibo on the downswing, you will see that the 50 fibo area is itself a heavy supply area, so you can set the target in the same area that I marked with a gold star.
Your possible profit by entering from the first zone is about 9% without leverage
Your possible profit by entering from the second zone is about 30% without leverage
CFXUSDT Short Term AnalysisTechnical Analysis:
CFXUSDT has been trading within a descending channel pattern on the daily time frame. From June 10th to June 20th, the price underwent consolidation at the support level, indicating a period of indecision and potential accumulation. The subsequent range breakout suggests a shift in momentum and a potential bullish rally in the making. Currently, the price is approaching the resistance area, which will be a key level to watch for a breakout.
Trade Setup:
Entry:
As per the Smart Money Concept, a fresh entry can be taken at $0.2080, preferably after the breakout above the resistance area. This entry point aligns with the expectation of a bullish rally following the breakout.
Target:
Our target for this trade setup is set at $0.4490, representing a significant upside potential from the entry level. This target reflects the anticipated price movement once the breakout above the resistance area is confirmed.
Stop Loss:
To manage risk effectively, it is recommended to set a stop loss at $0.1900. Placing the stop loss below the entry level can help protect against potential downside risks

Conflux buy zoneMarked is the potential buy zone for Conflux. (CFXUSDT)
Im looking at a reversal pattern in this zone. For instance: RSI divergence or simply a higher high with higher low.
Im also keeping the options open of it not entering the zone but just as it did touching it.

CFX - Resonable entry areaCFX has reched support.
Big week for the market next week - potential to push up from here. 0.5
Best, Hard Forky

Good pattern based crypto! From examining the previous price action of CFX, it can be well understood that this crypto is pattern-oriented and tends to act like it did in the past. Therefore, it is expected to soar from this area to 0.45 based on the chart. Stop loss can be set at 0.1345.

CFXUSDT bullish opportunityOn the H2 chart of CFXUSDT, with high probability, the price has finished the 4th Elliott wave within a bullish cycle. The divergence on the AO indicator provides a buy signal with a reasonable R/R ratio.

CFX - Still Neutral
The yellow "bounce zone" is holding price, but there hasn´t been a clear bullish event yet.
I´m neutral as long as we stay:
Below black trendline
Above green support.
I´ll consider long trades above black trendline with a higher high in place.

