CFXUSDT trade ideas


CFXUSDT Breaks Double-Bottom ResistanceCFXUSDT Technical analysis update
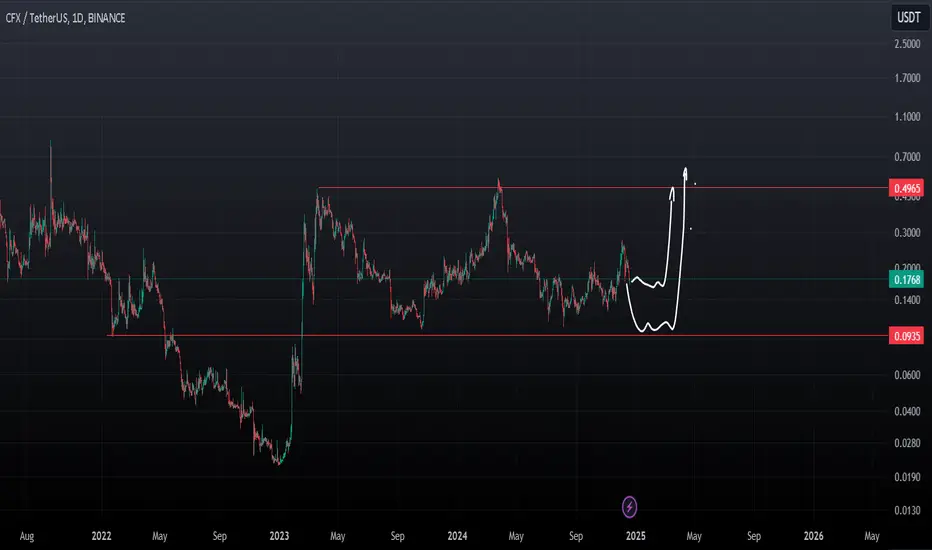
CFX/USDT price found strong support at $0.10 and bounced 110% from this level, forming a potential double-bottom pattern. The price is now breaking the neckline resistance on the daily chart while trading above the 100 and 200 EMA. This setup indicates a possible 100-200% bullish move from the current levels.


CFXUSDT: Is the Next Big Pump Brewing in the Blue Box?CFXUSDT Analysis Promising Setup with Volume Increase
CFXUSDT is showing strength with a notable volume spike. This could be a solid opportunity if the price reaches the blue box.
Highlights:
Volume Increase: Strong market activity supports the bullish potential.
Blue Box Entry: I plan to enter near the blue box with a stop below the most recent low.
For Risk-Reward Seekers: Those looking for higher risk-to-reward setups can wait for upward breaks in lower time frames within the blue box for confirmation.
Key Observations:
"The blue box is very carefully picked using volume footprint, volume profile, cumulative delta volume, and liquidity heatmap. When trading this zone, I will look for buyers and upward market structure breaks in lower time frames for confirmation."
This setup has potential, but as always, wait for confirmation before acting. 🚀
Let me tell you, this is something special. These insights, these setups—they’re not just good; they’re game-changers. I've spent years refining my approach, and the results speak for themselves. People are always asking, "How do you spot these opportunities?" It’s simple: experience, clarity, and a focus on high-probability moves.
Want to know how I use heatmaps, cumulative volume delta, and volume footprint techniques to find demand zones with precision? I’m happy to share—just send me a message. No cost, no catch. I believe in helping people make smarter decisions.
Here are some of my recent analyses. Each one highlights key opportunities:
🚀 RENDERUSDT: Strategic Support Zones at the Blue Boxes +%45 Reaction
🎯 PUNDIXUSDT: Huge Opportunity | 250% Volume Spike - %60 Reaction Sniper Entry
🌐 CryptoMarkets TOTAL2: Support Zone
🚀 GMTUSDT: %35 FAST REJECTION FROM THE RED BOX
🎯 ZENUSDT.P: Patience & Profitability | %230 Reaction from the Sniper Entry
🎯 DEXEUSDT %180 Reaction with %9 Stop
🐶 DOGEUSDT.P: Next Move
🎨 RENDERUSDT.P: Opportunity of the Month
💎 ETHUSDT.P: Where to Retrace
🟢 BNBUSDT.P: Potential Surge
📊 BTC Dominance: Reaction Zone
🌊 WAVESUSDT.P: Demand Zone Potential
🟣 UNIUSDT.P: Long-Term Trade
🔵 XRPUSDT.P: Entry Zones
🔗 LINKUSDT.P: Follow The River
📈 BTCUSDT.P: Two Key Demand Zones
🟩 POLUSDT: Bullish Momentum
🌟 PENDLEUSDT.P: Where Opportunity Meets Precision
🔥 BTCUSDT.P: Liquidation of Highly Leveraged Longs
🌊 SOLUSDT.P: SOL's Dip - Your Opportunity
🐸 1000PEPEUSDT.P: Prime Bounce Zone Unlocked
🚀 ETHUSDT.P: Set to Explode - Don't Miss This Game Changer
🤖 IQUSDT: Smart Plan
⚡️ PONDUSDT: A Trade Not Taken Is Better Than a Losing One
💼 STMXUSDT: 2 Buying Areas
🐢 TURBOUSDT: Buy Zones and Buyer Presence
🌍 ICPUSDT.P: Massive Upside Potential | Check the Trade Update For Seeing Results
🟠 IDEXUSDT: Spot Buy Area | %26 Profit if You Trade with MSB
📌 USUALUSDT: Buyers Are Active + %70 Profit in Total
🌟 FORTHUSDT: Sniper Entry +%26 Reaction
🐳 QKCUSDT: Sniper Entry +%57 Reaction
📊 BTC.D: Retest of Key Area Highly Likely
This list? It’s just a small piece of what I’ve been working on. There’s so much more. Go check my profile, see the results for yourself. My goal is simple: provide value and help you win. If you’ve got questions, I’ve got answers. Let’s get to work!

CFX Double bottom / 3 rising valleysLooking for a move above the local 618 for confirmation, but the first target would be the top of the range for the Sign of strength.
Typically youll see a partial decline of sorts, which would then statistically favor a breakout into extension targets at the 1.618, and the measured move a bit higher.
With daily and 3 day volatility still contracting, it could take a little time but momentum has shifted upwards, and bias remains higher without a new low.


CFX Neutral ZoneUpdated price action has given me a neutral bias for CFX.
The pullback was deep, and we are looking at 2 scenarios:
Bullish: Leading diagonal which would take wave 5 to the mid-0.30's.
Bearish: A breakdown of the bottom ascending trendline for a new lower low.
While we are between the bottom ascending trendline and the solid green resistance, I don't see any trades to be taken.

#CFX Ready For a Massive Move Above Or Not? Key Levels to Watch Yello, Paradisers! Has #Conflux just kicked off its next bullish run or is this a fakeout waiting to trap traders? Let’s dive into the latest move in #CFXUSDT:
💎#CFX has recently broken out above the descending resistance of the broadening wedge—a major technical milestone. This breakout signals potential bullish momentum, with the price now eyeing key resistance zones for confirmation of a sustained move upward.
💎The immediate challenge for #Conflux lies at the $0.26-$0.29 supply wall. A daily candle close above this level would validate the breakout and likely trigger an extended bullish rally. Beyond this, the next target sits at the $0.4500–$0.5500 major resistance zone, where stronger profit-taking and selling pressure are expected.
💎If #CFXUSD manages to conquer the $0.2900 barrier, bullish momentum could carry it toward $0.6500 or even higher, establishing a new trend for long-term traders. Keep an eye on volume—an uptick in buying activity would confirm the strength of this breakout. In case of a pullback, immediate support lies at $0.1720, with a critical demand zone around $0.1356. As long as CFX holds above these levels, the bullish structure remains intact, and any dip into this zone could present an attractive re-entry point for buyers.
💎If #CFX closes below $0.1356, this would invalidate the bullish breakout, signaling potential downside. Such a scenario could drive prices toward $0.1000 or lower, erasing recent gains and catching overleveraged bulls off guard.
Stay focused, patient, and disciplined, Paradisers🥂
MyCryptoParadise
iFeel the success🌴

TradeCityPro | CFXUSDT Analysis: Don’t Fear the Red Candles!👋 Welcome to TradeCityPro Channel!
Let’s dive into the first day of the week where we’ve seen red candles and minor corrections. This is a good time to review our coins and prepare our triggers.
🌍 Market Overview
Before analyzing CFX, let’s take a quick look at Bitcoin. It faced a strong rejection at 100,400 and printed a significant red candle. But what should we do in such cases? For now, nothing. The trend remains bullish, and Bitcoin dominance is also correcting.
If Bitcoin’s dominance continues to drop and forms a lower high on the daily timeframe while the market remains bullish, keep an eye on the charts for potential altcoin entries. This scenario could signal the start of a bull run.
🕒 Weekly Time Frame
CFX stands out as an older coin with prior bull-run experience. It’s trading above last year’s lows and hasn’t experienced steep declines.
Yesterday, we analyzed this coin briefly, but today, we’ll go into more detail. Unlike most altcoins that began their bullish moves from their lowest levels, CFX has already started its upward trajectory from 0.1219.
Fibonacci analysis shows that 0.1219 aligns with the 50% retracement level—a significant support both in Fibonacci terms and Dow Theory. After forming a range around this level and breaking the 0.1810 trigger, the coin moved toward its first target at 0.2596.
For further targets, use Fibonacci extensions from the same 0.5 range. Once 0.5171 is broken, potential targets include 0.7385, 1.21, and 2.26.
If you entered at 0.181, holding your position is advised. For re-entry, consider buying after the 0.2596 breakout with a stop-loss at 0.1219. RSI confirmation above 76.18 would also validate the entry.
📊 Daily Time Frame
On the daily chart, CFX was in a ranging box, forming higher lows. A breakout above 0.1851 was accompanied by a strong entry candle with buyer momentum, an RSI entry signal, and volume confirmation. Stop-loss was set at the daily low of 0.14.
If you followed this trigger, you’re likely in profit despite the current red daily candle. This correction is healthy, as an uptrend without pullbacks or red candles is often unsustainable.
For re-entry, consider buying after the 0.2596 breakout with a stop-loss at 0.14. Alternatively, a pullback to 0.1851 with confirmation from a bullish candle could also provide a good entry point.
🕒 4-Hour Time Frame
Let’s discuss how you could have entered positions earlier. After the 0.1905 breakout, a bullish engulfing candle (covering the prior two candles) marked the entry trigger. The stop-loss was set below the previous low, ensuring a secure long position with a good risk-reward ratio.
But would you really use a 14% stop-loss in futures trading? Yes, in volatile conditions like this, a larger stop-loss ensures safety and increases win rates. It’s better to risk 1% with higher win rates than repeatedly hit small stop-losses, which could harm your trading psychology.
📈 Long Position Trigger
wait for the 0.2596 breakout or RSI returning to its range, coupled with momentum confirmation in lower timeframes.
In bullish markets, an RSI recovery from oversold levels and breaking above 30 can also serve as an early long trigger.
📉 Short Position Trigger
For shorts, I still advise against them. For example, shorting the 0.2412 breakdown with a stop-loss at 0.2596 would’ve only offered a 1:1 risk-reward ratio, going against the primary trend.
💡 BTC Pair Insight
Against Bitcoin, CFX has held its 0.00000164 support and found strength. After breaking the 0.00000294 trigger, the coin is expected to deliver its main moves in the USDT pair. If the market remains bullish, CFX could showcase significant upward momentum.
📝 Final Thoughts
Stay calm, trade wisely, and let's capture the market's best opportunities!
This analysis reflects our opinions and is not financial advice.
Share your thoughts in the comments, and don’t forget to share this analysis with your friends! ❤️

TradeCityPro | CFX : Breaking Out of Consolidation👋 Welcome to TradeCityPro!
In this analysis, I’m going to review the CFX coin. After consolidating for a long time within a box between 0.1147 and 0.1903, the price has finally broken the upper boundary of the box and is moving upward.
📅 Daily Timeframe: Multiple Resistances Above the Price
On the daily timeframe, after breaking 0.1903, the price gained strong bullish momentum, and a significant amount of buying volume entered the market. However, upon reaching the first resistance at 0.2572, the price failed to break through and is now consolidating below this level.
✨ The RSI oscillator is exiting the Overbuy zone. If it manages to remain or re-enter the Overbuy zone, the price could continue its upward movement.
📈 In case of a breakout above 0.2572, the next resistances will be 0.3564 and 0.5125. If the price manages to stabilize above these levels, the next target will be 1.0368, which represents the ATH resistance of this coin.
🔽 Correction Scenario
The first support level is at 0.1903, and the next one is at 0.1147, which is the final stronghold for buyers to maintain the price.
📝 Final Thoughts
This analysis reflects our opinions and is not financial advice.
Share your thoughts in the comments, and don’t forget to share this analysis with your friends! ❤️


CFX Long Sl -11.33CFX Long Setup
Reason:
Breakout of trending line
All technical indicators suggesting a bullish wave
Still not taken the LTF Liquidity, since we added DCA Point for the liquidity
Can Strongly move in very short term.
Best Regards,
Crypto Panda
BINANCE:CFXUSDT
BYBIT:CFXUSDT.P
MEXC:CFXUSDT.P
BITGET:CFXUSDT.P

Is #CFX’s Breakout Just a False Alarm or a Major Move is Ahead?Yello Paradisers! is #CFXUSDT Ready for another massive rally or not? Let's discuss the latest analysis of #Conflux and see what's happening:
💎After grinding for 4-5 months in a tough downtrend, #CFX has finally broken out of its descending channel, fueled by a solid push off the major support at $0.130-$0.138. But don’t get too comfortable because a retest of this support zone could be on the horizon.
💎For this rally to gather real momentum, #CFX must clear the minor resistance at $0.226. If the bulls manage to push past this key level, we could see a stronger surge toward the next major resistance, powered by increasing volume and support from the 20EMA—clear signs that the bulls may finally be taking charge.
💎If the momentum stalls, be prepared for a pullback. A retest of the breakout zone or the major support at $0.130-$0.138 is possible. If this support doesn’t hold, expect a drop toward the lower demand zone at $0.113.
💎A break below $0.113 would shift the control back to the bears, likely leading to a deeper correction and dashing hopes for a bullish recovery in the near term. Stay vigilant, Paradisers—trading at these levels demands caution and a strategic approach.
Stay focused, patient, and disciplined, Paradisers🥂
MyCryptoParadise
iFeel the success🌴

CFX is readyAfter an 80% correction from $0.55 this year, CFX seems to have found its lowest price of the year at $0.125. With Bitcoin's positive price movement, CFX looks to provide positive price movement. The signs are that the price action crossed the 21 SMA (weekly chart), and the RSI reversed and crossed the 50 boundaries.
CFX's target is to make a higher high after $0.55. But before that, CFX must be able to cross the $0.23 price because there is a potential supply in that area.


