CFX - Re-entry opportunityLow based on H&S pattern
Target 0.37
I expect this will be reached over next 24 hours
Best, HF
CFXUSDT trade ideas


Conflux(CFX), a project with 💲2000% profit💲 (🗺️Roadmap🗺️)!!!Today let's take a look at the Conflux project, which has grown nearly 😱➕2000%➕ 😱in the last 80 days.
First, let's see what kind of project Conflux is.
Fundamental :
Conflux is a high throughput first layer consensus blockchain that utilizes a unique Tree-Graph consensus algorithm, enabling the parallel processing of blocks and transactions for increased throughput and scalability.
As the only regulatory compliant, public, and permissionless blockchain in China, Conflux provides a unique advantage for projects building and expanding into Asia, connecting decentralized economies to strengthen the global DeFi ecosystem.
Despite the recent banking collapse in the United States that has become a source of worry for those in the crypto industry, some cryptocurrency projects emerge unscathed, and CFX is one of them.
Also,The Conflux is the only blockchain in China that complies with legal requirements and utilizes the Tree-Graph consensus mechanism for increased throughput and scalability.
---------------------------------------------------------------------------------------------------------------------------------------------------------
Technical :
Conflux started its impulse waves after breaking the important downtrend line.
In order to know whether we still have the opportunity to invest in the Conflux project token(CFX), we must examine the current technical conditions of this token.
Conflux confirmed the start of wave 5 after breaking the 🔴resistance zone($0.362-$0.320)🔴 by 🟢bullish Marubozo candle (standard)🟢 and it is likely that wave 5 will continue until the 🔴heavy resistance zone($0.832-$.0635)🔴; as a result, the CFX token may grow by 👍+60%👍.
As long as Conflux does not lose its uptrend line and confirms the uptrend 50-SMA and 50-EMA, we can hope for the target of 👍+60%👍.
Conflux Analyze ( CFXUSDT ), Daily time frame ⏰.
Do not forget to put Stop loss for your positions (For every position you want to open).
Please follow your strategy, this is just my Idea, and I will be glad to see your ideas in this post.
Please do not forget the ✅' like '✅ button 🙏😊 & Share it with your friends; thanks, and Trade safe.

CFX Short and Long Swing SetupCFX currently forming MTR on its 4 hour chart, However, this current pump is heading to red resistance which is also a pull back to golden 66% of first bearish leg. I am expecting a second bearish leg, after this pull back heading to 0.096 area, which is also a golden 66% pull back of major bullish leg!:-)
For those of you who missed this current move including myself, I am taking a short position, at marked price(Red) on chart with TP of my entry price for long swing setup.
I would update SL on each position after Filling my orders.
Longest trade I ever had:-)
Lets see


CFX short term tradeHigh risk trading with uncertain market conditions, but wanted to share this possible short term paly.
So what I am watching is CFX on the 1hr timeframe. There has been a break in market structure and the price action is now creating a small bear flag/wedge just under resistance.
This is also helpful to pair with BTC being just under a resistance level, so if BTC breaks through this level marked then there is a high likelihood that the CFX trade will get stopped out.

$CFXUSDT, BREAK DOWN, SHORTING, POSSIBLE 5%-25%Break down from channel, resisted from resistance on daily, with 1 is to 1 Risk Reward Ratio(RRR) and possible 1 is to 5 RRR.

Side NoteAccording to many news dated back earlier, they have used the related news about how the government from Hong Kong will the crypto space. CFX is up 38% by newly received 10 millions in backing from KuCoin. They have bumped earlier this morning and it is time to relax for a moment. Try to get some more new comers so they have the hold the price around 0.30-0.38 -ish.

CFXUSD ❕ broke up the downward wedgeThe asset came out of the descending wedge.
Trading volumes indicate that the market is interested in price growth.
CFX will grow after holding the support.

Cfxusdt Breaking Bullish Flag Seems Like Getting Ready For Another Bullish Impulse
Breaking Bullish Flag In h4 timeframe Expecting Another 35 to 40% Bullish Move Incase Of successful Breakout

CFXUSDT IdeaCFXUSDT CFXUSD BINANCE:CFXUSDT CRYPTO:CFXUSD
✅ ✅ Risk warning, disclaimer: the above is a personal market judgment and analysis based on published information and historical chart data on The trading view,
And only some of these analyzes are my actual real trades.
I hope Traders consider I am Not responsible for your trades and investment decision.

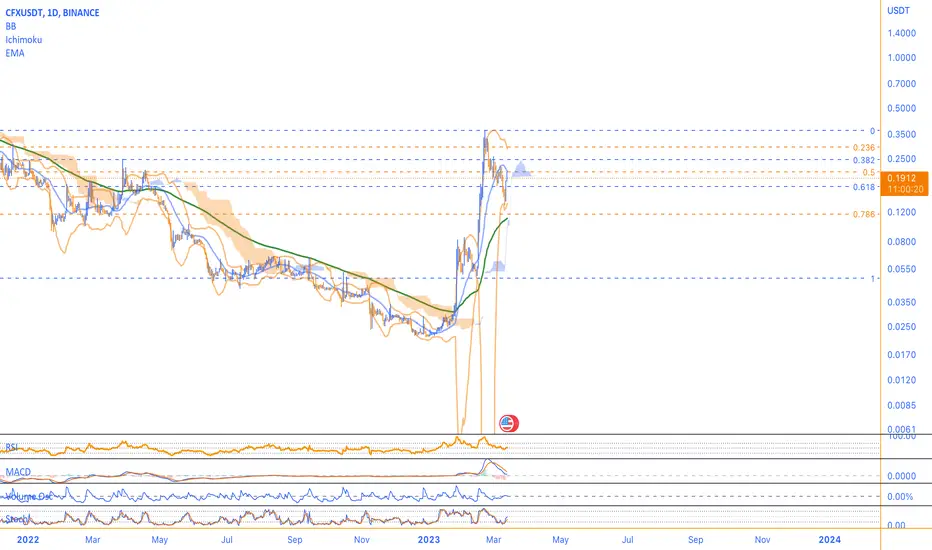
Balanced Market Sentiment and Unique Competitive AdvantagesConflux (CFX) is currently trading at $0.1910 area in the daily timeframe, and its RSI is at 52. The asset is neither overbought nor oversold at the current price level, which indicates a balanced market sentiment.
When looking at the Fibonacci retracement levels in the daily timeframe, the 0.3669 level appears to be the primary resistance level, while the 0.2077 level acts as a support level. The price has recently bounced off the 0.2077 level, indicating strong buying support at that level. The 1 fibonacci level stands as the next potential support if the price continues to fall.
The Bollinger Bands in the daily timeframe provide further insight into the asset's volatility. The upper Bollinger band is currently at 0.2865, and the lower Bollinger band is at 0.1346. The middle Bollinger band, which is the 20-day moving average, is at 0.2106. The price seems to be trading around the middle Bollinger band, indicating that the market is currently balanced, and the asset's volatility is stable.
The volume oscillator is currently at 3.80%, indicating a moderate level of trading activity in the asset. The MACD, which is a trend-following momentum indicator, is currently at 0.0059, which suggests a weak bullish momentum.
The Stochastic oscillator, which measures the strength of the asset's momentum, is at 47.03. The reading suggests that the asset is not currently overbought or oversold.
Conflux's unique Tree-Graph consensus algorithm enables parallel processing of blocks and transactions, which increases throughput and scalability. Additionally, as the only regulatory-compliant public and permissionless blockchain in China, Conflux provides a unique advantage for projects building and expanding into Asia, connecting decentralized economies to strengthen the global DeFi ecosystem.
Overall, the technical analysis suggests that Conflux is currently trading at a balanced market sentiment, with moderate trading activity and stable volatility. The asset's unique features, such as its high throughput and regulatory compliance, could provide a competitive edge in the blockchain industry, particularly in Asia. However, investors should consider additional factors such as market trends and news developments when making investment decisions.

$cfxI am just proud of this. I spent 6 days trading this entire wave on $cfx
I like to leave lots of notes on my chart for myself since im still newish (about a year in)
There is a real science behind these markets

Cfx Getting Ready For further Upside Moves Seems Like Cfx Getting ready For Another Bulish impulse
Forming Bullish Flag In h4 Timeframe Incase Of breakout Expecting Another 50 to 55% bullish move

CFX USDT - BULLISH PENNANT 2HR TF2hr timeframe we have a bullish pennant, cfx has already started it's climb and is about half way to the target.

CFXUSDT Idea UPDATECFXUSDT - CFXUSD
✅ ✅ Risk warning, disclaimer: the above is a personal market judgment and analysis based on published information and historical chart data on The trading view,
And only some of these analyzes are my actual real trades.
I hope Traders consider I am Not responsible for your trades and investment decision.

CFXUSDTHello Crypto Lovers,
Mars Signals team wishes you high profits.
This is a 4-hour-time frame analysis for CFXUSDT
Here we have R1 as the resistance area that expresses the price was not able to rise at different points. And S1 and S2 are our support areas in this chart containing the support of price even since the past. Hence, we have the price fluctuating over S1 area in a neutral behavior after breaking the mentioned area upward and we expect it to have more increase and reach R1. Then by having some rising signs there, we would wait for an increase. Due to the high density of price, there is a high possibility for the price to face more increase. So if we receive some confirmation candles to rise, an increase would take place for the price to break R1 upward and even move rise toward R2 area would happen in case the price is supported at R1. But if the price is not supported, more fall is predicted there for it to touch lower amounts. We suggest you to put your trade orders by the time the price is on the pullback to S1. Surely if the price falls below S1, definitely more decline will happen. Please do not forget to wait for some signs such as confirmation candles in order to make sure of what will be your next movement and then act wisely.
Warning: This is just a suggestion and we do not guarantee profits. We advise you to analyze the chart before opening any positions.
Wish you luck


CFXUSDT IdeaCFXUSDT - CFXUSD
✅ ✅ Risk warning, disclaimer: the above is a personal market judgment and analysis based on published information and historical chart data on The trading view,
And only some of these analyzes are my actual real trades.
I hope Traders consider I am Not responsible for your trades and investment decision.

cfx trendlinewe are nearing a breakout on the trendline going back to the large run when china blockchains were moving

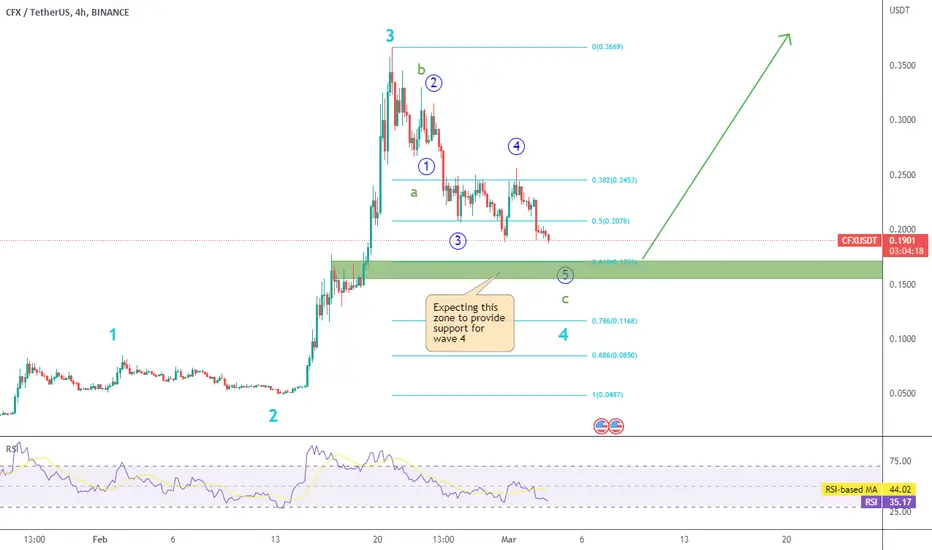
CFX - Wave 4 could be wrapping up
My primary count shows wave 4 in its final stages.
I expect the green zone to provide support, due to:
- previous consolidation
- 61.8% pullback
- 161.8% green ABC extension
CFX Bearish TriangleThere is a downtrend on the instrument, a decrease in trading volumes, the buyer cannot update local highs, all this indicates the presence of its weakness.
In view of the above, a short breakout level was formed with several touches, as well as a downward slope. I expect that the further inability to update the highs and the price tightening to the level of $ 0.2050 will lead to its breakdown into the short.
