Midweek overviewMidweek overview of the current state of play.
Having to elaborate on the idea here so trading view will publish it lol
CHFAUD trade ideas


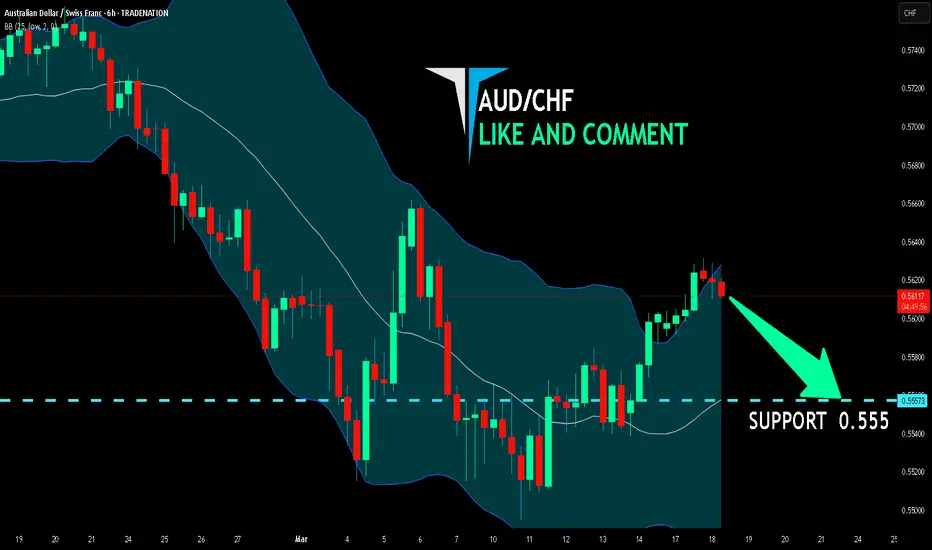
AUD/CHF SELLERS WILL DOMINATE THE MARKET|SHORT
Hello, Friends!
AUD/CHF pair is in the uptrend because previous week’s candle is green, while the price is obviously rising on the 6H timeframe. And after the retest of the resistance line above I believe we will see a move down towards the target below at 0.555 because the pair overbought due to its proximity to the upper BB band and a bearish correction is likely.
Disclosure: I am part of Trade Nation's Influencer program and receive a monthly fee for using their TradingView charts in my analysis.
✅LIKE AND COMMENT MY IDEAS✅


Bullish bounce?AUD/CHF is reacting off the pivot and could bounce to the 1st resistance.
Pivot: 0.55755
1st Support: 0.55314
1st Resistance: 0.56322
Risk Warning:
Trading Forex and CFDs carries a high level of risk to your capital and you should only trade with money you can afford to lose. Trading Forex and CFDs may not be suitable for all investors, so please ensure that you fully understand the risks involved and seek independent advice if necessary.
Disclaimer:
The above opinions given constitute general market commentary, and do not constitute the opinion or advice of IC Markets or any form of personal or investment advice.
Any opinions, news, research, analyses, prices, other information, or links to third-party sites contained on this website are provided on an "as-is" basis, are intended only to be informative, is not an advice nor a recommendation, nor research, or a record of our trading prices, or an offer of, or solicitation for a transaction in any financial instrument and thus should not be treated as such. The information provided does not involve any specific investment objectives, financial situation and needs of any specific person who may receive it. Please be aware, that past performance is not a reliable indicator of future performance and/or results. Past Performance or Forward-looking scenarios based upon the reasonable beliefs of the third-party provider are not a guarantee of future performance. Actual results may differ materially from those anticipated in forward-looking or past performance statements. IC Markets makes no representation or warranty and assumes no liability as to the accuracy or completeness of the information provided, nor any loss arising from any investment based on a recommendation, forecast or any information supplied by any third-party.

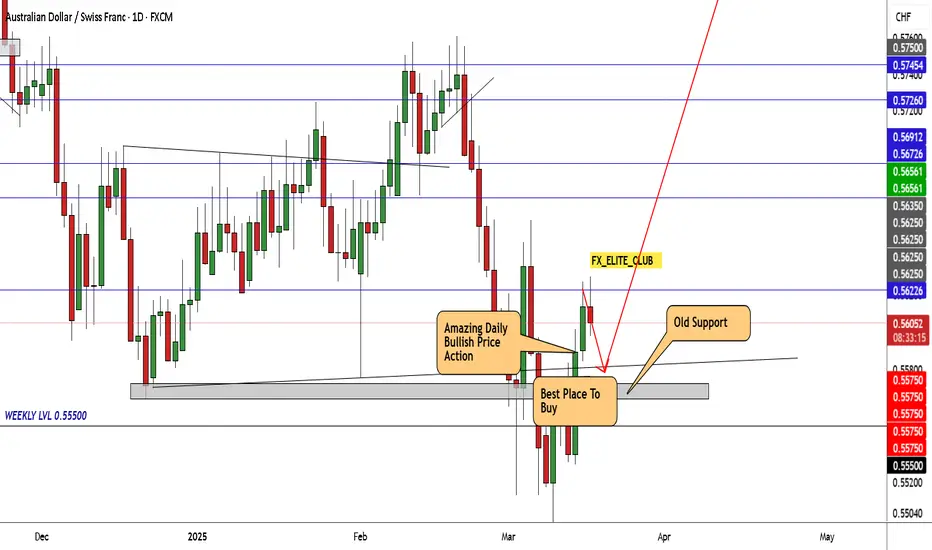
AUD/CHF Ready To Go Up , Don`t Miss This 250 Pips !Here is my chart on AUD/CHF , As we see the price back above our old support again and giving amazing bullish price action on all timeframes , so i decided to buy it from my support and i`m targeting 250 pips target .
This Is An Educational + Analytic Content That Will Teach Why And How To Enter A Trade
Make Sure You Watch The Price Action Closely In Each Analysis As This Is A Very Important Part Of Our Method
Disclaimer : This Analysis Can Change At Anytime Without Notice And It Is Only For The Purpose Of Assisting Traders To Make Independent Investments Decisions.
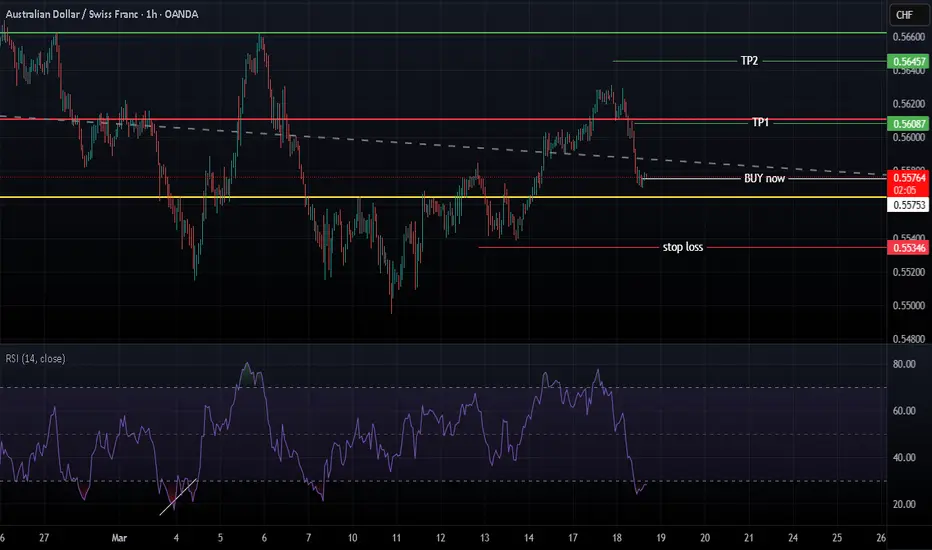
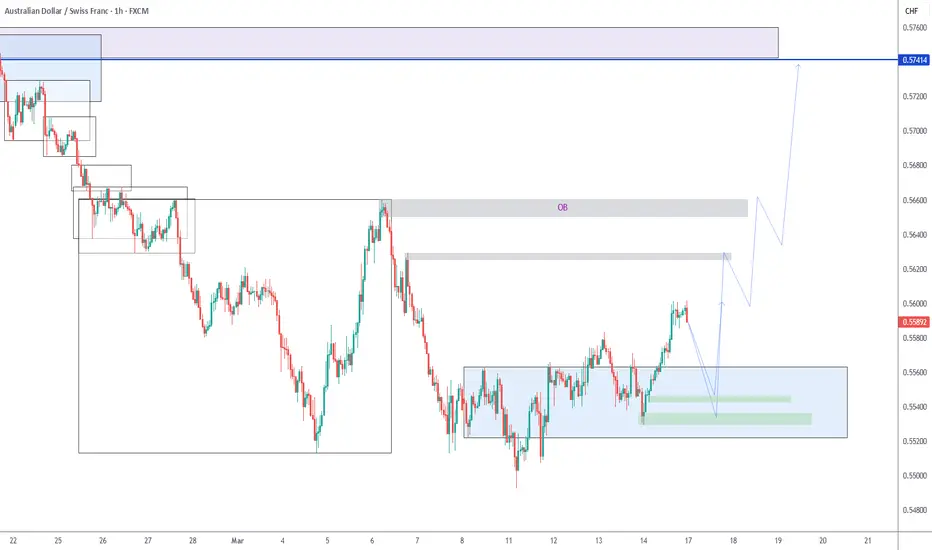
Short Term Long AUDCHFSimilar pattern and risk to the recent EURAUD trade so be aware for risk purposes .
Looking for reversal and push up as we move towards US Market open and beyond
Turning around clusters of liquidity at the " big figure "
Previous historic resistance levels
Return to Fibonacci zones from recent rise
Entry 5599
Stop 5580
Target 5628
A reasonable risk reward greater than 1


AUD/CHF: Consolidation Within a Defined RangeThe AUD/CHF pair continues to oscillate within a range between 0.56550 and 0.55000, recently reaching the upper boundary. Following a rebound from the support level, the price has developed an ABC move, which often precedes a pullback.
Currently, the market has approached the upper boundary of the channel and trendline, a level where price has previously faced rejection twice. Given the ongoing consolidation, there is a possibility of another rejection at resistance, potentially leading to a downward move while the sideways trend persists. The next key target is the support zone around 0.55835
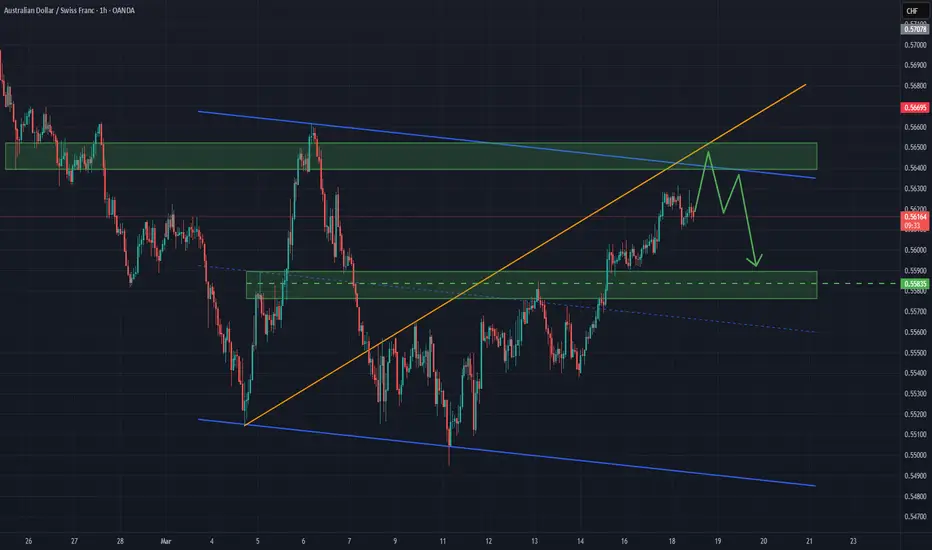
Lingrid | AUDCHF short OPPORTUNITY at Top of the MARKET RangeThe price perfectly fulfilled my last idea . It hit the target zone. As we can see, FX:AUDCHF is oscillating between the 0.56550 and 0.55000 levels, having recently reached the top of this range. After bouncing off the support level, the price began to form an ABC move, which typically precedes a pullback. Additionally, the price has reached the upper border of the channel and trendline, where it has previously dropped twice. Given that the price is currently consolidating, I think it may bounce off the resistance again, leading to a move lower as we anticipate a continuation of the sideways trend. My goal is support zone around 0.55835
Traders, If you liked this educational post🎓, give it a boost 🚀 and drop a comment 📣

AUDCHF Trade SetupAUD is getting the strength back while CHF is little weaker in a heat map. We can witness that AUDCHF in LONG run were in the down trend, but after liquidly sweep we can see local range break of structure happening signaling the strength of AUD against CHF. Thus Right now we can have trade setup of continuation , if bullish momentum persistent till NY Open.


Overlap resistance ahead?AUD/CHF is rising towards the pivot which is an overlap resistance and could reverse to the 1st support.
Pivot: 0.56541
1st Support: 0.55863
1st Resistance: 0.57011
Risk Warning:
Trading Forex and CFDs carries a high level of risk to your capital and you should only trade with money you can afford to lose. Trading Forex and CFDs may not be suitable for all investors, so please ensure that you fully understand the risks involved and seek independent advice if necessary.
Disclaimer:
The above opinions given constitute general market commentary, and do not constitute the opinion or advice of IC Markets or any form of personal or investment advice.
Any opinions, news, research, analyses, prices, other information, or links to third-party sites contained on this website are provided on an "as-is" basis, are intended only to be informative, is not an advice nor a recommendation, nor research, or a record of our trading prices, or an offer of, or solicitation for a transaction in any financial instrument and thus should not be treated as such. The information provided does not involve any specific investment objectives, financial situation and needs of any specific person who may receive it. Please be aware, that past performance is not a reliable indicator of future performance and/or results. Past Performance or Forward-looking scenarios based upon the reasonable beliefs of the third-party provider are not a guarantee of future performance. Actual results may differ materially from those anticipated in forward-looking or past performance statements. IC Markets makes no representation or warranty and assumes no liability as to the accuracy or completeness of the information provided, nor any loss arising from any investment based on a recommendation, forecast or any information supplied by any third-party.

Bearish reversal?AUD/CHF is rising towards the resistance level which is an overlap resistance and could reverse from this level to our take profit.
Entry: 0.5654
Why we like it:
There is an overlap resistance level.
Stop loss: 0.5682
Why we like it:
There is a pullback resistance level.
Take profit: 0.5586
Why we like it:
There is a pullback support level.
Enjoying your TradingView experience? Review us!
Please be advised that the information presented on TradingView is provided to Vantage (‘Vantage Global Limited’, ‘we’) by a third-party provider (‘Everest Fortune Group’). Please be reminded that you are solely responsible for the trading decisions on your account. There is a very high degree of risk involved in trading. Any information and/or content is intended entirely for research, educational and informational purposes only and does not constitute investment or consultation advice or investment strategy. The information is not tailored to the investment needs of any specific person and therefore does not involve a consideration of any of the investment objectives, financial situation or needs of any viewer that may receive it. Kindly also note that past performance is not a reliable indicator of future results. Actual results may differ materially from those anticipated in forward-looking or past performance statements. We assume no liability as to the accuracy or completeness of any of the information and/or content provided herein and the Company cannot be held responsible for any omission, mistake nor for any loss or damage including without limitation to any loss of profit which may arise from reliance on any information supplied by Everest Fortune Group.


AUDCHF: Strong Bullish Continuation 🇦🇺🇨🇭
It looks to me that AUDCHF will continue rising.
A confirmed breakout of a neckline of a cup & handle pattern
on a 4H time frame provides a strong bullish signal.
The price will likely reach at least 0.5627 level soon.
❤️Please, support my work with like, thank you!❤️
I am part of Trade Nation's Influencer program and receive a monthly fee for using their TradingView charts in my analysis.

Mon 17th Mar 2025 AUD/CHF Daily Forex Chart Buy SetupGood morning fellow traders. On my Daily Forex charts using the High Probability & Divergence trading methods from my books, I have identified a new trade setup this morning. As usual, you can read my notes on the chart for my thoughts on this setup. The trade being a AUD/CHF Buy. Enjoy the day all. Cheers. Jim

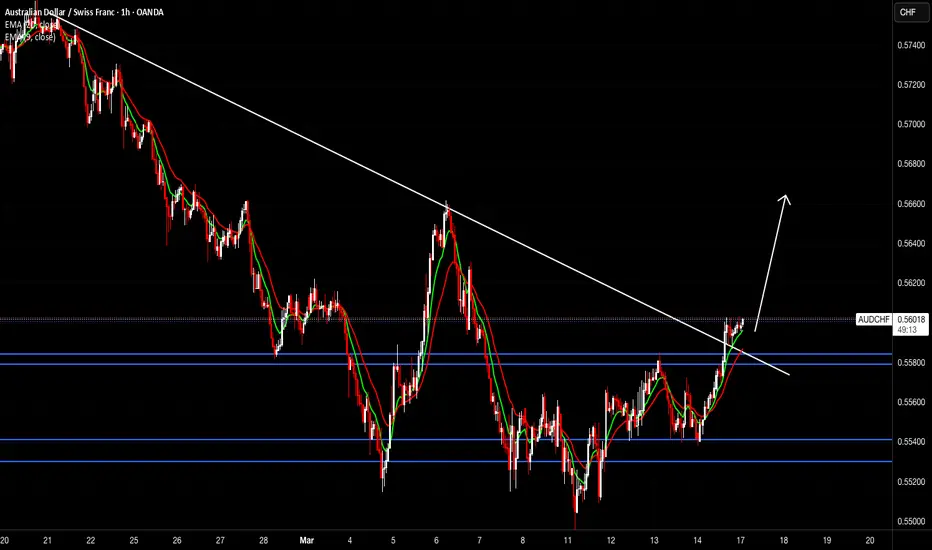
AUD-CHF Move Up Expected! Buy!
Hello,Traders!
AUD-CHF made a bullish
Breakout of the key horizontal
Level of 0.5576 and the
Breakout is confirmed
Because the daily candle
Closed above the key level
So on the market open
We will be expecting a
Local pullback and then
A strong move up
Buy!
Comment and subscribe to help us grow!
Check out other forecasts below too!
Disclosure: I am part of Trade Nation's Influencer program and receive a monthly fee for using their TradingView charts in my analysis.
