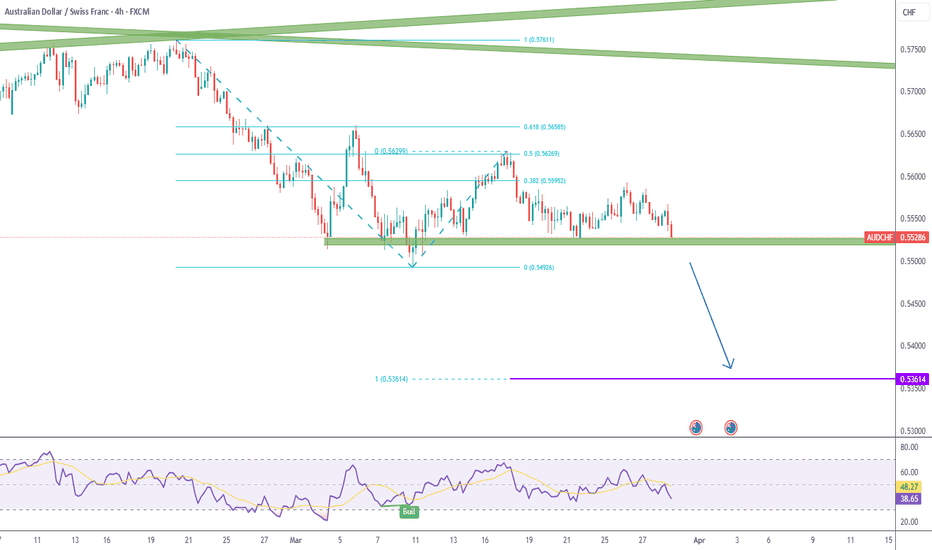
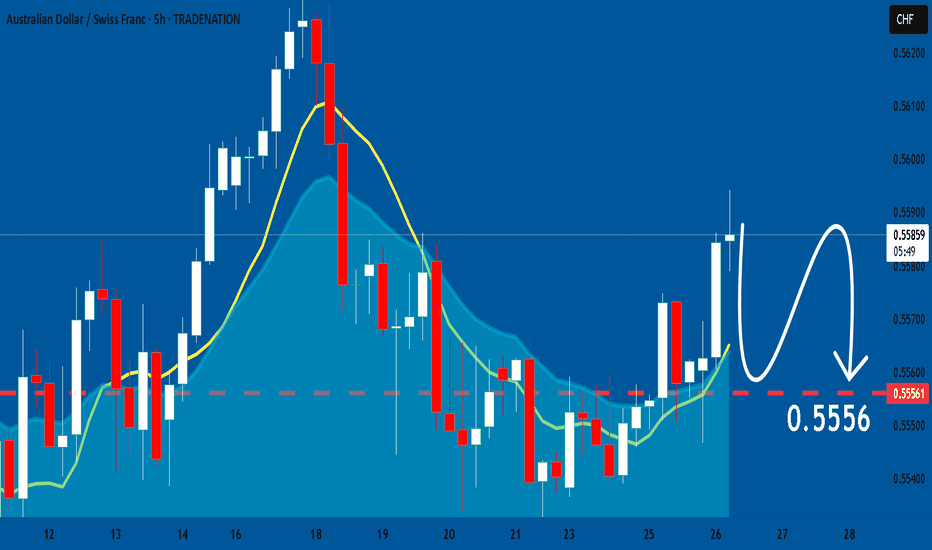
AUD_CHF POTENTIAL SHORT| ✅AUD_CHF is going up to retest a horizontal resistance of 0.5885 Which makes me locally bearish biased And I think that we will see a pullback And a move down from the level Towards the target below at 0.5822 SHORT🔥 ✅Like and subscribe to never miss a new idea!✅Shortby ProSignalsFx4
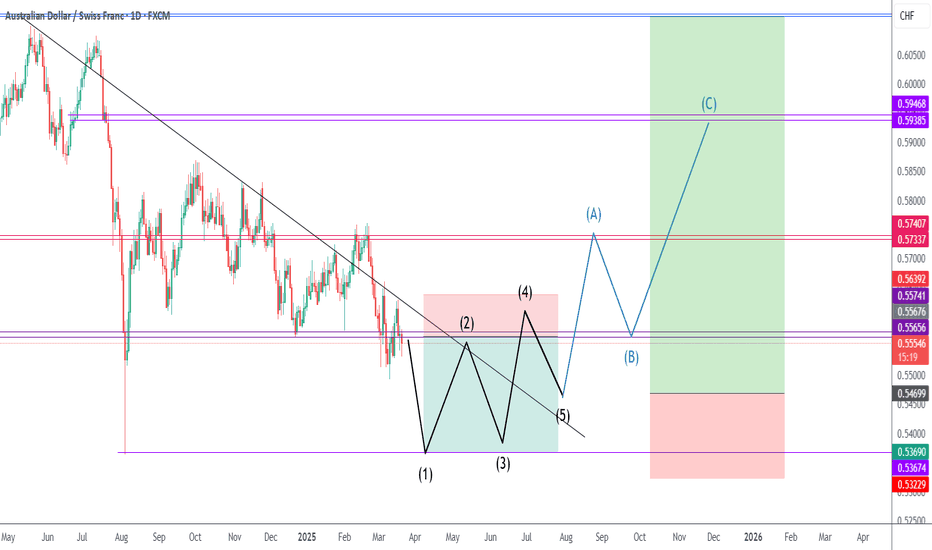
AUDCHF - Bullish Momentum - Weekly Bullish DivergenceFX:AUDCHF has formed bullish divergence on weekly timeframe, and broken lower highs on Daily and 4 Hr. 4 Hr Analysis: 1. Bullish Trend (Dow Theory) 2. Multiple Lower Highs Broken 3. Weekly Bullish DivergenceLongby Tempo_Trades113
AUD/CHF BUYERS WILL DOMINATE THE MARKET|LONG Hello, Friends! AUD/CHF is trending up which is clear from the green colour of the previous weekly candle. However, the price has locally plunged into the oversold territory. Which can be told from its proximity to the BB lower band. Which presents a beautiful trend following opportunity for a long trade from the support line below towards the supply level of 0.581. ✅LIKE AND COMMENT MY IDEAS✅Longby EliteTradingSignalsUpdated 225
AUD/CHF - Potential Bullish ReversalThe AUD/CHF pair has been forming a recovery after bouncing off the 38.2% Fibonacci retracement level at 0.5643, following a sharp downtrend. Currently, the price is trading around 0.5840, indicating a potential breakout from the downtrend channel. Key Resistance Levels: 0.5814 (61.8% Fib retracement) 0.5900 (Top of the downward sloping trendline) 0.6090 (Previous swing high) Key Support Levels: 0.5728 (50% Fib retracement) 0.5625 (Horizontal support) The breakout above 0.5814 signals a potential bullish continuation, targeting the upper trendline near 0.5900 . If the price can break through this level, the next major target will be 0.6090 . However, a rejection here could result in a retest of support at 0.5728. RSI is pointing upwards, suggesting momentum is in favor of the bulls, though it is nearing overbought territory. Volume also supports a potential upward move, but caution is advised at key resistance areas.by AngshumanSaikia1
Trade idea - AUDCHF Long4H Corrective approach towards entry zone. -68 Fibonacci completion aligning with entry zone. = Buy limit. Bullish Fake Out flag also there as extra evidence. 1.5% risk. Longby PipjagerUpdated 0
AUDCHF BROKEN CHANNEL Sell opportunity after break of channel. Strong bearish momentum candle on the 4hr chart. Unless this is a fake break out I'm looking for a sell entry after the retest of the channel. Sell limonite order set. This is not trading advice. This is my personal analysis. Trade at your own risk. Shortby RichFish4040
AUDCHF Uptrend ContinuesContinuation of Sept. 11th trade analysis. 1. Weekly double bottom chart pattern identified 2. Fib levels line up with S&R zones 3. Original 9/11 trade analysis successful and price action confirms trade is moving towards weekly/Monthly key levels which has been calculated from the completion of the pullback and the continuation of the trend thereafter. 4. Re-enter at break of resistance 0.57950Longby RichFish404Updated 116
AUD-CHF Bearish Breakout! Sell! Hello,Traders! AUD-CHF was trading in an Uptrend but now we are Seeing a breakout from an Opening wedge pattern So we are bearish biased Now and we will be expecting A local move down Sell! Like, comment and subscribe to help us grow! Check out other forecasts below too!Shortby TopTradingSignals223
AUDCHF BEARISHAccording to my analysis the price will break support level 2 and continue to be bearishShortby muzairafzal1992110
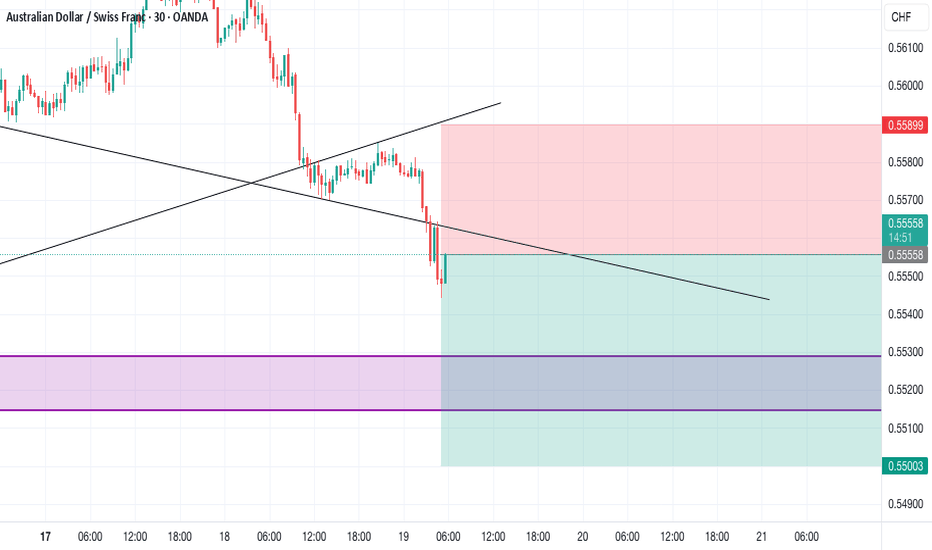
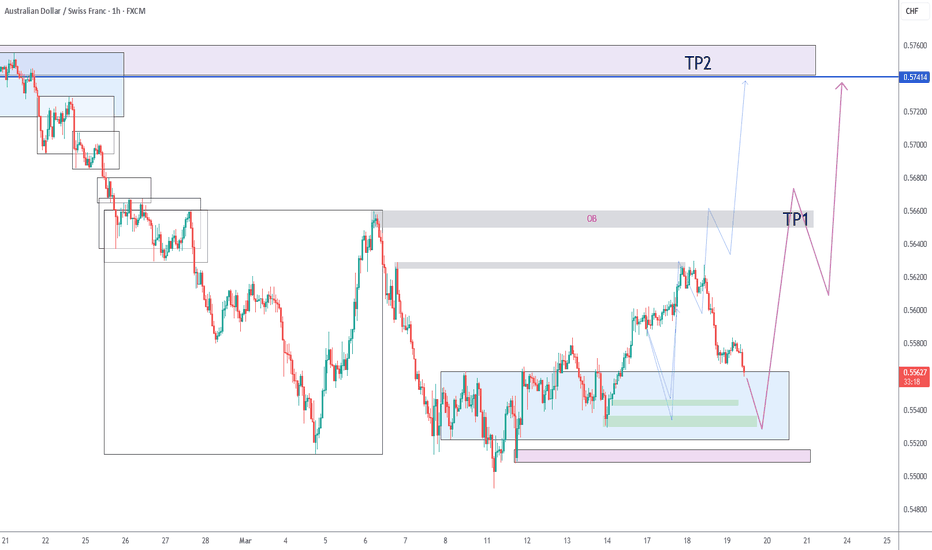
AUDCHF SELL TO BUY IDEAWatching for price to clear out trendline liquidity on this pair, down to our entry at the support level for more upsides, to our TP1( purple resistance area) and possibly TP 2 levels, this is not a trade signal, rather a possible trading opportunity, use suitable risk management if you agree with my idea Another additional confluence would be the inverse head and shoulder pattern pictured on the chart, we are now watching for price to retest the neckline for a bullish moveLongby Santanndan2
AUD/CHF Channel Breakout: Long Opportunity on the HorizonIn the AUD/CHF pair, we’ve seen a decisive break and close above the descending channel. On the weekly chart, a long-tailed candle has formed, signaling a robust rebound from the key support level. The market has consistently honored the 0.5600 psychological barrier, bouncing off it several times. With the bullish momentum gathered this week, I anticipate further upward movement. This could indicate either a potential trend reversal or a continuation of the current bullish trend, especially if the market sustains its position above the support. My target is the resistance zone around 0.58400. Traders, if you found this idea helpful or have your own insights to share, feel free to drop a comment. I’d love to hear your thoughts! Longby lonelyPlayer0Updated 3
AUD_CHF APPROACHING RESISTANCE|SHORT| ✅AUD_CHF is going up now But a strong resistance level is ahead at 0.5885 Thus I am expecting a pullback And a move down towards the target at 0.5807 SHORT🔥 ✅Like and subscribe to never miss a new idea!✅Shortby ProSignalsFx114
A sell to buy tradeso AUDCHF has been bearish and currently price is retracing back to a orderblock zone and now we are looking for a sell sclaping opportunity to the buy position Shortby rumeog78u111
AUD CHF: Looks to be a smooth BUY right now Current price for AUD CHF is sitting right on the anchored VWAP and a bullish cross of 9EMA over the 50EMA on Daily timeframe. Longby Easy_Explosive_TradingUpdated 1
AUDCHF → Bearish Movement Soon?Dear traders, After monitoring AUDCHF on the daily chart, we found a clear Break & Retest setup that gives us a sign that price might fall down. If TP1 gets hit, there is a very high chance that price might continue further down to TP2! What do you think about our setup? Shortby ForexProton115
AUDCHF 1H TF Bullish (Dow, Trendline)AUDCHF shows a bullish continuation by making DOW HH's and HL's and following strong rising trendline. Entry is taken at CMP with SL at previous HL and TP at 1:1 R:R. What do you think, will it hit the TP?Longby Trad3WithTayyab2
AUDCHF 1DThe price is located between the 0.618 and 0.78 Fibonacci area, also the daily moving average 200 is above the price and there is also a resistance zone in this area that can pull the price down.Shortby Trading-House1
AUD/CHF For Bullishyou can go long now - Price Break High Resistance Level at red arrow - Price has H4 Gulfing Candle have fun :)Longby maxbayne1
AUSSIE will be the last to move on interest rates. Buy AUD CHF Do you ever wish you could make that BIG move in a trade, over maybe a couple of months but for big-bucks. Timing is everything for these big moves. They don't make it easy for us retail traders to capitalise on these big moves. AUD CHF is a very high time frame double bottom right now. Recommended to scale into with tiny lot size, so you can watch it, and then master how to trade these huge double-bottom systems for the big money in the markets. AUD is returning to the strength it had through 2023. This is a way to get in at the bottom. * Trading is risky. Not to be taken as investment advice. For education and illustration purposes.Longby Easy_Explosive_Trading0
AUDCHF-SHORTAUDCHF was trading in bullish trend now it seems this pair is about to start a bearish trend so we will take a short entry Shortby shanihamza113
AUDCHF 1DThe price has reached a strong resistance level on the daily time frame, and there is a high probability of rejection from this area. Look for an entry point in lower time frames for a Sell trade.Shortby Trading-House1
1:2 day trade - AUDCHFAUDCHF is on an uptrend. Formed a bull flag and broke out with an engulfing candle. Going for a 1:2, seems reasonable if price action follows the previous similar bull flag breakout that happened earlier on the 18th. Would be smart to lock in profits at 1:1Longby gunhy3
WHATS FLOWING!?: EURCAD | EURJPY | GBPCHF | BTCEUROANDA:EURCAD OANDA:EURJPY OANDA:GBPCHF COINBASE:BTCEUR Today's Episode of What's Flowing: EURCAD, EURJPY, GBPCHF, BTCEUR Trade Ideas In today's episode, we will be looking at four key trading pairs and their current market movements, providing insights into potential trade setups and market sentiment. 1. EURCAD Current Price: EURCAD traded at 1.50239, slightly decreasing by 0.04% since the last session. Over the past month, it has lost 0.19% but remains up 5.46% over the last 12 months. Forecast: Projections suggest EURCAD could decline further, with expected levels at 1.48962 by the end of this quarter and 1.48690 in a year. With a declining trend, this suggests a potential short setup for traders looking to capitalize on continued weakness in the pair. 2. EURJPY Current Price: EURJPY traded at 160.189, showing a gain of 0.34% in today's session. It’s up 0.70% over the past month and 1.57% over the last year. Forecast: EURJPY is projected to climb to 161.743 by the end of the quarter and 162.624 within a year. Given its upward momentum, this pair presents a potential long trade opportunity for those looking to take advantage of its positive trajectory. 3. GBPCHF Current Price: GBPCHF traded at 1.13158, increasing slightly by 0.05% today. The pair has gained 1.26% over the past four weeks and 1.62% over the past year. Forecast: With forecasts indicating a potential drop to 1.11578 by the end of the quarter and 1.11645 within the year, this pair offers an attractive short opportunity for those looking to ride the predicted downside. 4. BTCEUR Current Price: Bitcoin is trading at 57,015.7 EUR, rising 0.70% today. Over the past year, BTCEUR has seen a staggering rise of 129.62%, with strong momentum in recent months. Forecast: BTC is expected to correct slightly to 51,739.8 EUR by the end of this quarter and could drop further to 48,987.6 EUR in one year. This indicates a potential profit-taking opportunity or a short-term pullback setup for those cautious about BTC’s extended rally.11:26by moneymagnateash2282