Buying audchf
Now more buying expected till 2 weeks
Currently buying from weekly demand and gonna again touch previous high
CHFAUD trade ideas

Audchf for a midterm buy Wait for a retest on the support zone below. Take your buys, I have covered the lows that needs to be covered.

AUDCHF - Short after BOS !!Hello traders!
‼️ This is my perspective on AUDCHF.
Technical analysis: Here we are in a bearish market structure from daily timeframe perspective, so I look for a short. Price rejected from bearish order block, as well we have hidden divergence on daily and regular divergence on H4, so after BOS I will enter short.
Like, comment and subscribe to be in touch with my content!

AUD_CHF WILL GROW|LONG|
✅AUD_CHF keeps growing
And the pair made a
Retest of the horizontal
Support of 0.5728 and is
Going up again which
Reinforces our bullish
Bias and we will be
Expecting a further
Bullish continuation
LONG🚀
✅Like and subscribe to never miss a new idea!✅

Trade idea - AUDCHF Long4H
Corrective approach towards entry zone.
-27 Fibonacci completion aligning with entry zone.
= Buy limit.
Bullish M pattern also there as extra evidence.
0.5% risk.
Aiming to take full profit at Daily TP.

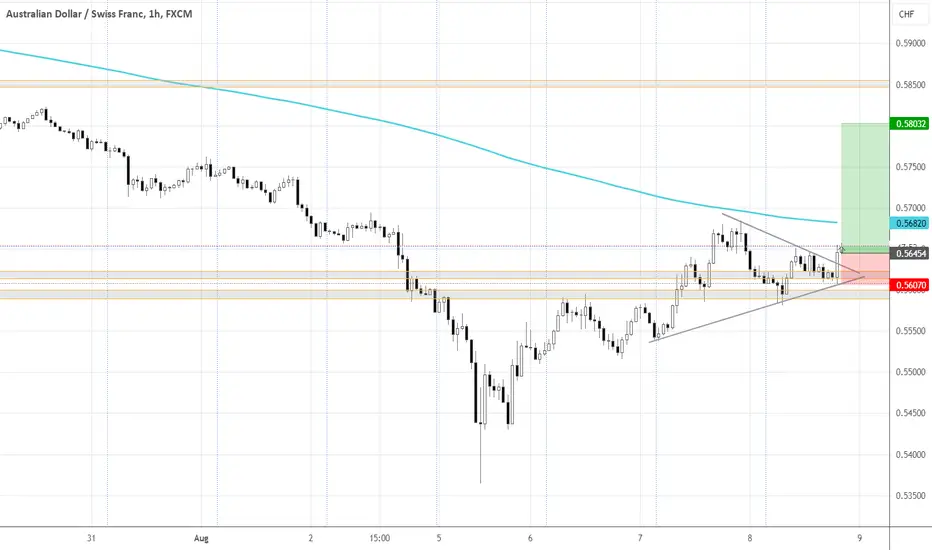
Recovery bet: hawkish aussie and franc devaluationAUD
- Hawkish RBA, at a previous meeting even discussed the rate hike
- Positive US Headline Jobless Claims - good for risk assets
CHF
- Franc is in dangerous territory for SNB, risking deflation - possible intervention to devalue CHF
Technical & Other
Setup: S(B)
Setup timeframe: 1h
Trigger: 1h
Medium-term: Down
Long-term: Down
Min target: 0.58
Risk: 0.68%
AUDCHF: Bullish Trend Continues 🇦🇺🇨🇭
AUDCHF is trading in a bullish trend on a 4H time frame.
After quite an extended bullish wave, the pair was consolidating within
a horizontal range for some time.
The resistance of the range was broken yesterday.
It is a very important sign of strength of the buyers for us.
I think that growth may continue, and the market will reach 0.58 level soon.
❤️Please, support my work with like, thank you!❤️

Lingrid | AUDCHF double TOP at RESISTANCE zone. ShortFX:AUDCHF successfully broke through the range zone and subsequently formed a double top at the resistance level. On the daily timeframe, the market shows a clear bearish trend, having completed approximately a 50% retracement. The price is now moving toward the support level, and I believe it may continue lower, breaking through the upward channel on the 1H timeframe. I anticipate that the market continue to move down and at least retest last week's high. My goal is to support level at 0.57130
Traders, if you liked this idea or if you have your own opinion about it, write in the comments. I will be glad 👩💻

Buy on AUDCHF Entered on a Buy
- Price Shot Up and Moved
Above the Consolidation
Level
- Price Struggle to Break
0.57600 Zone and Stayed
Above
- New @ 9:30: RBA Govenor
Bullock Speaks (Might Get Smoked)

Very Bullish Price Action On AUD/CHF , Ready To Catch 200 Pips ?This Is An Educational + Analytic Content That Will Teach Why And How To Enter A Trade
Make Sure You Watch The Price Action Closely In Each Analysis As This Is A Very Important Part Of Our Method
Disclaimer : This Analysis Can Change At Anytime Without Notice And It Is Only For The Purpose Of Assisting Traders To Make Independent Investments Decisions.

AUD/CHF +150 Pips 0 Drawdown , Gave For Free , Did You Enter ?This Is An Educational + Analytic Content That Will Teach Why And How To Enter A Trade
Make Sure You Watch The Price Action Closely In Each Analysis As This Is A Very Important Part Of Our Method
Disclaimer : This Analysis Can Change At Anytime Without Notice And It Is Only For The Purpose Of Assisting Traders To Make Independent Investments Decisions.

Possible trade idea for AUD/CHFSo when we are looking at the chart we can see that the price is moving in some sort of range for now. We can see that the price is struggling to break a zone of resistance.
At this moment we are close to that level that the resistance is at. What we can do now is go and see if we could go short here to do some range trades.
Entry: 0.57471
SL: 0.57646
TP: 0.57006
R/R: 2.66%

AUD/CHF SENDS CLEAR BEARISH SIGNALS|SHORT
Hello, Friends!
It makes sense for us to go short on AUD/CHF right now from the resistance line above with the target of 0.571 because of the confluence of the two strong factors which are the general downtrend on the previous 1W candle and the overbought situation on the lower TF determined by it’s proximity to the upper BB band.
✅LIKE AND COMMENT MY IDEAS✅

Short Sell on AUDCHFEntered on a Sell
- Price Broke Structure
and staying below the
0.57010 Zones
- Price Forming a "J"
Usually moves downward
- Risky entry, Price struggling
to break 0.57000 Zones
- News @ 9:30

Bearish drop?AUD/CHF is reacting off the pivot which has ben identified as an overlap resistance and could drop to the overlap support.
Pivot: 0.57216
1st Support: 0.55944
1st Resistance: 0.58223
Risk Warning:
Trading Forex and CFDs carries a high level of risk to your capital and you should only trade with money you can afford to lose. Trading Forex and CFDs may not be suitable for all investors, so please ensure that you fully understand the risks involved and seek independent advice if necessary.
Disclaimer:
The above opinions given constitute general market commentary, and do not constitute the opinion or advice of IC Markets or any form of personal or investment advice.
Any opinions, news, research, analyses, prices, other information, or links to third-party sites contained on this website are provided on an "as-is" basis, are intended only to be informative, is not an advice nor a recommendation, nor research, or a record of our trading prices, or an offer of, or solicitation for a transaction in any financial instrument and thus should not be treated as such. The information provided does not involve any specific investment objectives, financial situation and needs of any specific person who may receive it. Please be aware, that past performance is not a reliable indicator of future performance and/or results. Past Performance or Forward-looking scenarios based upon the reasonable beliefs of the third-party provider are not a guarantee of future performance. Actual results may differ materially from those anticipated in forward-looking or past performance statements. IC Markets makes no representation or warranty and assumes no liability as to the accuracy or completeness of the information provided, nor any loss arising from any investment based on a recommendation, forecast or any information supplied by any third-party.

AUDCHF Bullish The trend is bullish as seen from the support, the trend is bullish till the price respect the uptrend support line.

AUDCHF: Short Term Sell OpportunityShort Term:
- Small Sell Opp.
- Price Trapped in Ranging
Uptrend
- Waiting for price to close below
Zone

AUDCHF Bank Robbery Plan on Bullish Direction to Steal MoneyMy Dear Robbers / Traders,
This is our master plan to Heist AUDCHF Bank based on Thief Trading style Technical Analysis.. kindly please follow the plan I have mentioned in the chart focus on Long entry. Our target is Red Zone that is High risk Dangerous level, market is overbought / Consolidation / Trend Reversal at the level Bearish Robbers / Traders gain the strength. Be safe and be careful and Be rich.
Note: If you've got a lot of money you can get out right away otherwise you can join with a swing trade robbers and continue the heist plan, Use Trailing SL to protect our money.
Entry : Can be taken Anywhere, What I suggest you to Place Buy Limit Orders in 15mins Timeframe Recent Swing Low
Stop Loss : Recent Swing Low using 2h timeframe
Warning : Fundamental Analysis comes against our robbery plan. our plan will be ruined smash the Stop Loss. Don't Enter the market at the news update.
Loot and escape on the target 🎯 Swing Traders Plz Book the partial sum of money and wait for next breakout of dynamic level / Order block, Once it is cleared we can continue our heist plan to next new target.
Support our Robbery plan we can easily make money & take money 💰💵 Follow, Like & Share with your friends and Lovers. Make our Robbery Team Very Strong Join Ur hands with US. Loot Everything in this market everyday make money easily with Thief Trading Style

audchf buyHere’s a bullish technical analysis for the AUD/CHF pair on the H4 chart:
Moving Averages: The AUD/CHF pair is trading above the 50-period and 200-period moving averages, indicating a bullish trend. The 50-period moving average has crossed above the 200-period moving average, forming a “Golden Cross,” which is a strong bullish signal1.
Relative Strength Index (RSI): The RSI is currently above 50, suggesting that the momentum is in favor of the bulls. If the RSI approaches the overbought territory (above 70), it could indicate strong buying pressure2.
MACD (Moving Average Convergence Divergence): The MACD line is above the signal line, and both are above the zero line, which is a bullish indicator. This suggests that the upward momentum is likely to continue3.
Bollinger Bands: The price is moving towards the upper Bollinger Band, indicating that the pair is in an uptrend. A breakout above the upper band could signal further bullish momentum2.
Support and Resistance Levels: The pair has recently broken above a key resistance level around 0.5700, which now acts as support. The next resistance level to watch is around 0.58001.
Volume: An increase in trading volume on bullish candles suggests strong buying interest and supports the bullish outlook3.
Overall, the technical indicators on the H4 chart for AUD/CHF suggest a bullish trend.

AUDCHFI have a theory regarding the AUDCHF currency pair that I believe will play out in the coming days. Based on my analysis and observations, I anticipate that the price will decrease. This expectation is grounded in a combination of factors that I track through my proprietary set of private indicators. These indicators have been meticulously developed and fine-tuned over time, giving me confidence in their predictive power. While market movements can be unpredictable and influenced by a multitude of external factors, I trust that my indicators provide a reliable basis for this forecast. Hence, I am preparing for a potential decline in the AUDCHF price.

AUDCHF BUY TF H4 TP = 0.5913On the H4 chart the trend started on Aug. 06 (linear regression channel).
There is a high probability of profit taking. Possible take profit level is 0.5913
Using a trailing stop is also a good idea!
Please leave your feedback, your opinion. I am very interested in it. Thank you!
Good luck!
Regards, WeBelievelnTrading

AUDCHF Will Fall! Short!
Take a look at our analysis for AUDCHF.
Time Frame: 3h
Current Trend: Bearish
Sentiment: Overbought (based on 7-period RSI)
Forecast: Bearish
The market is trading around a solid horizontal structure 0.572.
The above observations make me that the market will inevitably achieve 0.564 level.
P.S
We determine oversold/overbought condition with RSI indicator.
When it drops below 30 - the market is considered to be oversold.
When it bounces above 70 - the market is considered to be overbought.
Like and subscribe and comment my ideas if you enjoy them!

AUDCHFWe have just broken the lower trend line and now waiting to see if this is a fake out for a continuation of trend to the upside, staying inside the channel, to the next resistance.
If the break of the trend isn't a fake out, and we are just having a retest of the trend line, I will wait for a break for structure to the downside to be sure of a sell down to the next support.
