AUDCHF time to see changes?
OANDA:AUDCHF much upsides-downsides we are not see some special moves here from start of Mart.
Today we are have RBA, AUD looks like its gather power, currently price exepcting to come in zone and break of same expecting in this week.
CHF showing self weak and with other pairs, like CAD and GBP.
SUP zone: 0.55000
RES zone: 0.56200, 0.56600
CHFAUD trade ideas

AUDCHF BUYPrice has entered into the wicked area of lows that have been a previous area of momentum change. With interest rates expecting to remain the same. I don't see how the price to drive lower. I'll be looking for Buys to surcharge the price to bounce off the wicked area. Positive Swaps via USD holdings means I'll swing this from entry and work on risk off when price moves into profit and swaps can reduce risked position.

AUD/CHF SENDS CLEAR BEARISH SIGNALS|SHORT
Hello, Friends!
AUD/CHF pair is trading in a local uptrend which we know by looking at the previous 1W candle which is green. On the 3H timeframe the pair is going up too. The pair is overbought because the price is close to the upper band of the BB indicator. So we are looking to sell the pair with the upper BB line acting as resistance. The next target is 0.553 area.
Disclosure: I am part of Trade Nation's Influencer program and receive a monthly fee for using their TradingView charts in my analysis.
✅LIKE AND COMMENT MY IDEAS✅


A fall signal found.Dear viewers,today we search AUDCHF opportunities and find what I will mention later...OK,in my view the AUD has started a small downfall since 26 March and a great fall from 20 Feb against CHF.And absolutely a range zone from 4 March is wrought.!So what to do?!come back to the small fall where the price touched the descending channel border and started.Now we can see it closing a small support area.I am watching,watching If the price reacts to support, then I will sell at the indicated level...For now, we are looking at it this way with the AUDCHF.Follow the trend with its waves and enjoy!


AUDCHF: Bearish Forecast & Bearish Scenario
It is essential that we apply multitimeframe technical analysis and there is no better example of why that is the case than the current AUDCHF chart which, if analyzed properly, clearly points in the downward direction.
Disclosure: I am part of Trade Nation's Influencer program and receive a monthly fee for using their TradingView charts in my analysis.
❤️ Please, support our work with like & comment! ❤️


AUDCHF - Potential Short-Term BottomTaking a look at the daily chart, AUDCHF has began showing indications of a potential bottom. This might be a decent low risk LONG setup as a swing trade.
Leave a comment below, let me know what you think. Share with friends. Check out my profile for more awesome trade plans and setups. DM for account management
Trade Safe - Trade Well
~Michael Harding


AUDCHF: Long Trade with Entry/SL/TP
AUDCHF
- Classic bullish setup
- Our team expects bullish continuation
SUGGESTED TRADE:
Swing Trade
Long AUDCHF
Entry Point - 0.5536
Stop Loss - 0.5514
Take Profit - 0.5578
Our Risk - 1%
Start protection of your profits from lower levels
Disclosure: I am part of Trade Nation's Influencer program and receive a monthly fee for using their TradingView charts in my analysis.
❤️ Please, support our work with like & comment! ❤️


Bearish reversal?AUD/CHF is rising towards the resistance level which is a pullback resistance that aligns with the 61.8% Fibonacci retracement and could reverse from this level to our take profit.
Entry: 0.5602
Why we like it:
There is a pullback resistance level that aligns with the 61.8% Fibonacci retracement.
Stop loss: 0.5626
Why we like it:
There is a pullback resistance level.
Take profit: 0.5545
Why we like it:
There is a pullback support level.
Enjoying your TradingView experience? Review us!
Please be advised that the information presented on TradingView is provided to Vantage (‘Vantage Global Limited’, ‘we’) by a third-party provider (‘Everest Fortune Group’). Please be reminded that you are solely responsible for the trading decisions on your account. There is a very high degree of risk involved in trading. Any information and/or content is intended entirely for research, educational and informational purposes only and does not constitute investment or consultation advice or investment strategy. The information is not tailored to the investment needs of any specific person and therefore does not involve a consideration of any of the investment objectives, financial situation or needs of any viewer that may receive it. Kindly also note that past performance is not a reliable indicator of future results. Actual results may differ materially from those anticipated in forward-looking or past performance statements. We assume no liability as to the accuracy or completeness of any of the information and/or content provided herein and the Company cannot be held responsible for any omission, mistake nor for any loss or damage including without limitation to any loss of profit which may arise from reliance on any information supplied by Everest Fortune Group.


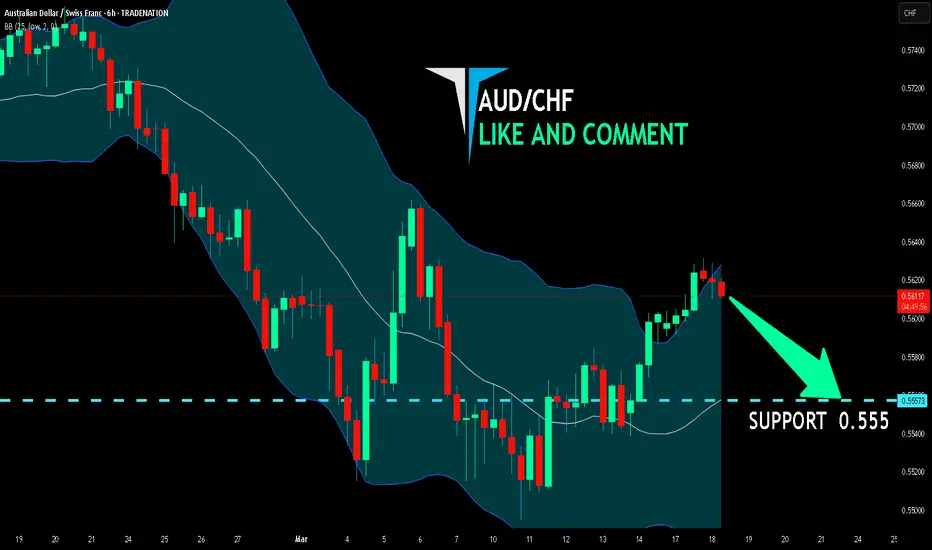
AUD/CHF SELLERS WILL DOMINATE THE MARKET|SHORT
Hello, Friends!
AUD/CHF pair is in the uptrend because previous week’s candle is green, while the price is obviously rising on the 6H timeframe. And after the retest of the resistance line above I believe we will see a move down towards the target below at 0.555 because the pair overbought due to its proximity to the upper BB band and a bearish correction is likely.
Disclosure: I am part of Trade Nation's Influencer program and receive a monthly fee for using their TradingView charts in my analysis.
✅LIKE AND COMMENT MY IDEAS✅