Potential Long Opportunity on CADCHFSome confluences I think will cause this pair to go long:
- Valid trend line broken on Daily Time frame.
- Price couldn't make a lower low on Daily
What do you think?
CHFCAD trade ideas

CADCHF: Support at 0.382 Fib Level with Bullish DivergenceCADCHF has found support at the 0.382 Fibonacci retracement level and is forming a bullish divergence. This technical setup indicates potential upward momentum.

CADCHFit's been on a strong uptrend for a while and is now consolidating at a spike peak giving a v-formation. i am speculating another jump from here

cadchfhi Traders, Market structure of cadchf is more likely to have a retracement on a higher tf, like daily and 4 hour TF, however, price may take supply area if you want to go short, and wait till price hits the below liquidity

CAD/CHFhello traders, the condition of the market is very interesting and beautiful, the market is in a rejection state and it looks very clean, we can wait a little and get confirmation and try to buy from the specified zones

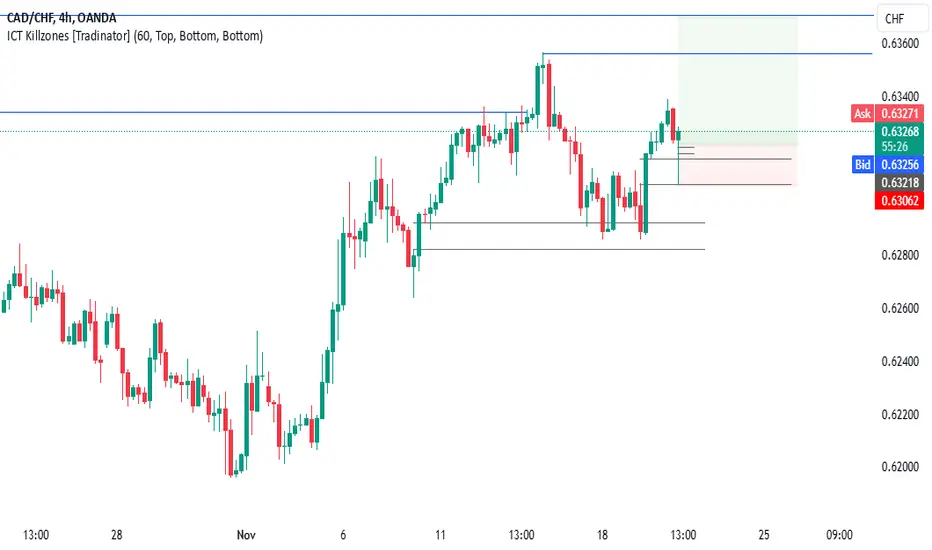
Could the price reverse from here?CAD/CHF is rising towards the pivot which is a pullback resistance and a reversal from this level could indicate a double top pattern which might lead to a potential price drop to the 1st support.
Pivot: 0.63555
1st Support: 0.63121
1st Resistance: 0.63754
Risk Warning:
Trading Forex and CFDs carries a high level of risk to your capital and you should only trade with money you can afford to lose. Trading Forex and CFDs may not be suitable for all investors, so please ensure that you fully understand the risks involved and seek independent advice if necessary.
Disclaimer:
The above opinions given constitute general market commentary, and do not constitute the opinion or advice of IC Markets or any form of personal or investment advice.
Any opinions, news, research, analyses, prices, other information, or links to third-party sites contained on this website are provided on an "as-is" basis, are intended only to be informative, is not an advice nor a recommendation, nor research, or a record of our trading prices, or an offer of, or solicitation for a transaction in any financial instrument and thus should not be treated as such. The information provided does not involve any specific investment objectives, financial situation and needs of any specific person who may receive it. Please be aware, that past performance is not a reliable indicator of future performance and/or results. Past Performance or Forward-looking scenarios based upon the reasonable beliefs of the third-party provider are not a guarantee of future performance. Actual results may differ materially from those anticipated in forward-looking or past performance statements. IC Markets makes no representation or warranty and assumes no liability as to the accuracy or completeness of the information provided, nor any loss arising from any investment based on a recommendation, forecast or any information supplied by any third-party.

CADCHF buyprice stayed under the strong level
higher high is made after bullish impulse
so continuation is expecting

CADCHF Pontential buy If price manages to close above resistance on the smaller timeframe we have a clean buy set up. This has potential to become a swing trade

CADCHF: Rejection at Key ResistanceCADCHF faced a strong rejection at a key resistance level, indicating potential downward movement.
CADCHF, Head and Shoulder at Resistance ZoneRejected from Resistance
Head and Shoulder Formation
Bearish Divergence
Right Shoulder Formation
Entry on break of neckline
Sl above right shoulder
Tp towards 1:1

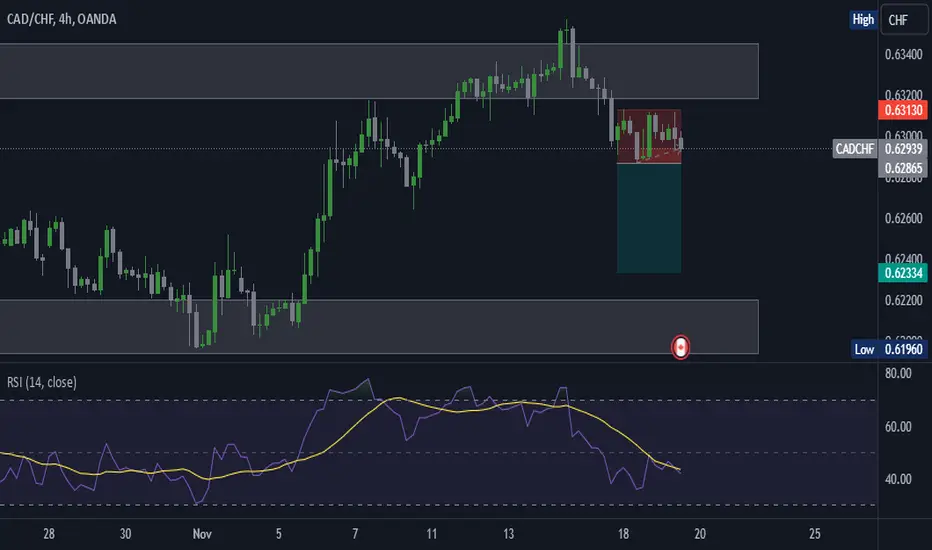
CADCHF: Bull Trap & Confirmed Bearish Movement 🇨🇦🇨🇭
CADCHF looks bearish after a false violation of a key horizontal
daily resistance.
The price formed a strong bearish imbalance
and violated multiple intraday supports.
I think that the pair will reach 0.6276 support soon.
❤️Please, support my work with like, thank you!❤️

CADCHFThis pair has been doing a lot of side way moves, but I think as in 15 min time frame it looks uptrend, I am putting a long position here for another spike from this point

CADCHF Massive Short! SELL!
My dear subscribers,
CADCHF looks like it will make a good move, and here are the details:
The market is trading on 0.6349 pivot level.
Bias - Bearish
My Stop Loss - 0.6373
Technical Indicators: Both Super Trend & Pivot HL indicate a highly probable Bearish continuation.
Target - 0.6302
About Used Indicators:
The average true range (ATR) plays an important role in 'Supertrend' as the indicator uses ATR to calculate its value. The ATR indicator signals the degree of price volatility.
———————————
WISH YOU ALL LUCK

CADCHFWe can attempt to buy CADCHF from specified level as it make HL , also 0.618 FIB level occur indicate that it moves upward.
SL , TP mention in chart.

CADCHF Daily LongIn Daily timeframe price has reach the resistance level. A nice good entry candle has been made. IT IS GOOD FOR GOING SHORT.

CADCHF potential buy.This pair has been ranging for quite some time, finally broken out of both range and trendline resistance and done retesting. Let's see

CAD/CHF: Ready to Break Out? Edge-Forex is Bullish on This One!So, here’s where we’re at: CAD/CHF has been hanging out in this tight box between 0.6230 and 0.6430 for a while, just begging for a breakout. And Edge-Forex is calling it – we’re leaning bullish on this setup. Here’s why. 👀
Top of the Range Pressure 💥
Right now, price is sitting right up against that 0.6430 resistance, and with the way momentum is building, it’s looking ready to pop. If it breaks above, this could be our ticket to a bullish ride up.
RSI is Supporting the Move 📊
RSI is up around 65 – not quite overbought, so there’s room to push higher if this breakout takes off. This is a classic bullish sign, especially with price testing resistance at the top of the range.
Breakout Targets 🎯
If we see that breakout hold above 0.6430, our first stop is 0.6550. And if things really get rolling, 0.6700 isn’t out of the question. Edge-Forex sees potential for some solid gains here if we can clear this level with strength.
How We’re Playing It:
Bullish Entry: Jump in on the confirmed breakout above 0.6430. We want to see a solid close above this level – not just a quick fakeout.
Protective Stop: Set it below 0.6230. If it dips back down, we don’t want to be caught holding the bag.
Target 1: 0.6550 – the initial resistance to aim for.
Target 2: 0.6700 if the bulls really take control. 🐂
Edge-Forex is bullish, but we’re watching that 0.6430 level like a hawk. If it clears, this could be a smooth ride up. But if it fakes out, be ready to adjust. Let’s see if CAD/CHF is ready to reward the bulls. 🚀

cadchfcadchf received support again from the median of its rising trend. With this support, it will advance to the upper resistance of the channel.
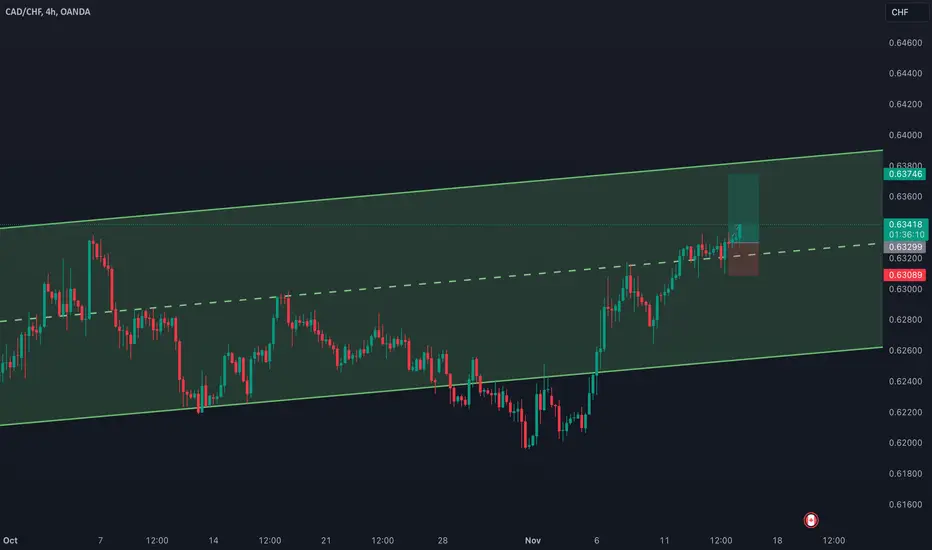
cadchfcadchf received support again from the median of its rising trend. With this support, it will advance to the upper resistance of the channel.

CADCHF Bearish in Short TermCADCHF has reached an important resistance area and is developing clear hidden bearish divergences.
This offers us the opportunity for a short-term short trade in the currency pair.

CADCHF after long time, changes here expected
CADCHF what's next, we can see SYMMETRICAL TRIANGLE pattern (and possible fake break of same), +price is on trend line. From fundamentals we are have BOC ~two weeks ago and NONFARM from last friday here expecting is have impact.
Currently CHF with many showing weakness, here expecting to see long bullish push
SUP zone: 0.61950
RES zone: 0.63000, 0.63400

CADCHF Signal : 1H / 4H :SHORT !!!!CADCHF 1H
Market price : 0.6326
Sell limit : 0.6330 - 0.6350
Tp1 : 0.6300
Tp2 : 0.6260
Tp3: 0.6200
Tp4 : 0.6120
Sl : 0.6380 ( 40 pip )
Traders, if you liked this idea or if you have your own opinion about it, write in the comments. I will be glad
Remember this is a position that was found by me and it is a personal idea not a financial advice, you are responsible for your loss and gain.
