CAD/CHF: Break, Retest and Go?The market is in a strong downtrend, moving inside a visible steep channel. Price recently pulled back into a previous support-turned-resistance zone. This move appears corrective in nature, with sellers likely waiting for signs of exhaustion before re-entering in the direction of the existing trend.
Now price is reacting to the resistance zone and rejecting further upside, suggesting potential continuation lower. Ideally if price retests without closing significantly above it and forms bearish price action confirmation, it would provide a high-probability short setup: pin bars or bearish engulfing candlesticks right at retest level would help confirm the signal.
From there, continuation toward the middle of the channel becomes likely. The target projection sits near the 0.57300 level. If price fails to break lower and instead closes above the resistance zone, the setup becomes invalid and would indicate potential reversal.
In short, sellers are watching for a break and retest, aiming to ride the move down to target of near 0.57300. The downtrend would be maintained as long as price respects the current resistance and shows more signs of bearish strength.
Just sharing my thoughts for the charts, this isn’t financial advice. Always confirm your setups and manage your risk properly.
Disclosure: I am part of Trade Nation's Influencer program and receive a monthly fee for using their TradingView charts in my analysis.
CHFCAD trade ideas

CAD_CHF STRONG SUPPORT|LONG|
✅CAD_CHF has been falling recently
And the pair seems locally oversold
So as the pair is approaching a
Horizontal support of 0.5790
Price growth is to be expected
LONG🚀
✅Like and subscribe to never miss a new idea!✅
Disclosure: I am part of Trade Nation's Influencer program and receive a monthly fee for using their TradingView charts in my analysis.

CADCHF: Waiting for the Right MomentDespite the recent minor pullback, I’m still watching closely and waiting for a stronger bearish move. What’s your take on this pair? Feel free to share your thoughts!

CADCHF BUY BIASConfluence 1 - “Daily Low Sweep”
• A liquidity sweep of a previous daily low occurred.
• This move typically indicates stop hunts and smart money accumulation, potentially setting up for a bullish reversal.
Confluence 2. Demand Zone (Grey Box)
• Area where price reacted after the sweep.
• Range: approximately 0.58100 – 0.58200
• Price currently respecting this zone, indicating potential bullish order block behavior.
🧠 Projected Price Path
The sketched movement indicates a plan for:
1. Break above current resistance
2. Pullback into breakout area (possibly retesting the demand)
3. Bullish continuation to 0.58470 and ultimately to 0.58800

CAD/CHF Downtrend Dominates Amid Mixed Economic SignalsTechnical Analysis
The CAD/CHF pair remains firmly in a downtrend on the 1-hour chart, with price consistently making lower highs and lower lows, underscoring sustained selling pressure. The price is trading below both the 20-period and 50-period weighted moving averages, which have turned downward, signaling bearish momentum.
Price action recently tested the critical last market bottom near 0.5826, slightly dipping below before a minor rebound. This area acts as immediate support but a decisive break lower could open the way toward deeper retracements at the 127.2% (0.5821), 141.4% (0.5818), and 161.8% (0.5814) Fibonacci extensions, serving as potential targets for bears.
Overall, the technical picture favors continued bearish pressure toward the next Fibonacci support levels. However, a recovery above the 61.8% Fibonacci retracement at 0.5833 and the short-term resistance near the 20-period WMA (around 0.5837) could trigger a corrective rebound toward 0.5845.
Fundamental Outlook
Key upcoming Canadian data, including the Ivey PMI readings on July 8 and the employment report scheduled for July 11, will be pivotal in shaping CAD sentiment. The Ivey PMI is expected to reflect ongoing softness in business activity, while employment figures will be closely monitored for signs of labor market resilience or deterioration.
Swiss economic data will be more limited but important releases such as the SECO Consumer Climate index on July 11 may provide additional insight into domestic demand and sentiment, impacting CHF positioning.

CADCHF 4H Rocket Booster Strategy – Bearish Setup with EMA CADCHF 4H Rocket Boost Strategy – Bearish Setup with EMA Breakdown, Impulsive Sell Candles, MACD Momentum Shift, and Stoch RSI Signal
The CADCHF currency pair is setting up for a potential downside move on the 4-hour chart, following the Rocket Boost Strategy
framework for bearish trades. With price trading below key moving averages, momentum indicators confirming weakness,
and aggressive selling pressure evident, this setup may offer a clean sell opportunity for trend-following traders.
1. Price Below the 50 EMA
CADCHF is currently trading below the 50-period Exponential Moving Average (EMA), indicating that short-term momentum has
shifted in favor of sellers. The 50 EMA is no longer acting as support but now serves as resistance. This shift often marks the start of a downtrend.
2. Price Below the 200 EMA
Long-term trend bias has turned bearish, with price also below the 200 EMA. The 50 EMA has crossed below the 200 EMA,
forming a bearish stack—this adds weight to the idea that the market structure has flipped in favor of continued downside.
3. Breakout Candles / Bearish Impulse Moves
Recent candles show strong bearish momentum—long-bodied red candles with shallow upper wicks, suggesting aggressive
selling and minimal buyer defense. This behavior mimics a "gap-down" effect in forex terms, indicating institutional selling or
heavy supply pressure.
4. MACD Bearish Crossover Confirmation
The MACD line has crossed below the signal line, and the histogram is growing more negative with each candle close. This
is a key sign that momentum is accelerating to the downside. MACD crossovers below the zero line, especially during bearish
EMA alignment, often mark the start of significant downtrends.
5. Stochastic RSI Confirms Reversal Sell Signal
The Stochastic RSI recently reversed from overbought levels and crossed downward. This suggests a momentum reversal at a
local top, lining up perfectly with the broader bearish context. When used in conjunction with other trend signals, it helps
traders time their entries with greater precision.
What This Means for CADCHF Traders
This Rocket Boost bearish setup is showing full alignment: price under both major EMAs, downside confirmation from MACD,
strong bearish candles, and a Stoch RSI reversal. Traders watching this pair should be alert for continuation signals such as lower
highs, retests of broken support levels, or breakdowns through psychological price zones.
Targets could include previous swing lows, Fibonacci retracement levels, or key support zones on the daily chart.
To learn more about this kind of setup, search for Rocket Booster Strategy content.
Disclaimer: This article is for educational purposes only and does not constitute financial advice. Always do your own analysis and use proper risk management.
Use a simulation trading account before you trade with real money

CADCHF 1D IdeaPotential for a bullish pullback on the CADCHF 1D which could lead to a price movement towards the resistance level at 0.61200. BUY levels from 0.58400

CAD_CHF GROWTH AHEAD|LONG|
✅CAD_CHF made a retest
Of the horizontal support
Of 0.5820 and we are already
Seeing a bullish reaction
So we will be expecting a
Further bullish move up
On Monday
LONG🚀
✅Like and subscribe to never miss a new idea!✅
Disclosure: I am part of Trade Nation's Influencer program and receive a monthly fee for using their TradingView charts in my analysis.

CADCHF KEY ZONES TO LOOK AT - POSSIBLE LONG The pair has been trading inside a bearish trend on H4. It recently rejected from a strong support area and broken above falling trendline. This could be an indication of a start of a new bullish movement.
Please do your own analysis before placing any trades.
Cheers and Happy Trading!!!!!

CADCHF Is Going Up! Long!
Take a look at our analysis for CADCHF.
Time Frame: 1h
Current Trend: Bullish
Sentiment: Oversold (based on 7-period RSI)
Forecast: Bullish
The market is on a crucial zone of demand 0.583.
The oversold market condition in a combination with key structure gives us a relatively strong bullish signal with goal 0.585 level.
P.S
Please, note that an oversold/overbought condition can last for a long time, and therefore being oversold/overbought doesn't mean a price rally will come soon, or at all.
Disclosure: I am part of Trade Nation's Influencer program and receive a monthly fee for using their TradingView charts in my analysis.
Like and subscribe and comment my ideas if you enjoy them!

CAD-CHF Local Long! Buy!
Hello,Traders!
CAD-CHF made a retest
Of the horizontal support
Of 0.5832 so we are locally
Bullish biased and we will be
Expecting a local bullish move up
Buy!
Comment and subscribe to help us grow!
Check out other forecasts below too!
Disclosure: I am part of Trade Nation's Influencer program and receive a monthly fee for using their TradingView charts in my analysis.

CAD/CHF 4H Reversal Setup – Stoch RSI Signals Exhaustion CAD/CHF 4H Reversal Setup – Stoch RSI Signals Exhaustion 📉📈
Pair: CAD/CHF
Timeframe: 4H
Date: July 3, 2025
---
Market Overview
The CAD/CHF pair remains in a strong downtrend. Price is trading below both the 50 EMA and 200 MA, which are sloping downward. This confirms bearish momentum. After a small bullish bounce, the pair is testing the dynamic resistance zone formed by the 50 EMA.
---
Indicator Confluence
Stochastic RSI (3,3,14) is deep in the overbought zone (above 94), suggesting bullish momentum may be fading.
Price has failed to break above the 50 EMA (0.58564), which could serve as a resistance barrier.
EMA and MA crossover shows 50 EMA remains below the 200 MA, confirming the dominant trend is bearish.
---
Trade Idea: Short Setup
Entry Zone: 0.58240 – 0.58300 (wait for bearish confirmation candle)
Stop Loss: Above 0.58600 (just beyond the 50 EMA)
Take Profit Targets:
TP1: 0.57200 (recent swing low)
TP2: 0.56000 (next support zone)
---
Strategy Logic
This is a trend-continuation reversal entry, catching the top of a pullback within a bearish structure. The Stochastic RSI overbought condition, combined with resistance at the 50 EMA and overall trend alignment, makes this setup attractive for swing or intraday short trades.
---
Risk Disclaimer
This idea is for educational purposes only. Always apply proper risk management and confirm setups with your trading plan.
---
If you found this helpful, feel free to like, comment, or share your thoughts below. Are you short on CAD/CHF too?
\#CADCHF #Forex #TradingView #StochasticRSI #BearishReversal #EMA #4HSetup #ForexEducation #TrendTrading #PriceAction
---

CAD-CHF Rejection From Resistance! Sell!
Hello,Traders!
CAD-CHF is trading in a
Very strong downtrend
And the recent breakout
Of the a strong key level
Of 0.5839 is confirmed
So we are bearish biased
And as the pair made a
Retest of the new resistance
We can enter a short trade
And will be expecting at
Least a local move down
In a bearish continuation
Sell!
Comment and subscribe to help us grow!
Check out other forecasts below too!
Disclosure: I am part of Trade Nation's Influencer program and receive a monthly fee for using their TradingView charts in my analysis.

CADCHF - BEARISH - QUANT-LEVEL FX LISTDaily: Downtrend
H4: Downtrend
H1: Downtrend
m15: Downtrend
Risk of Entering Now: Better Zone a little higher
Target at least previous day low
tg@darksheeptrades

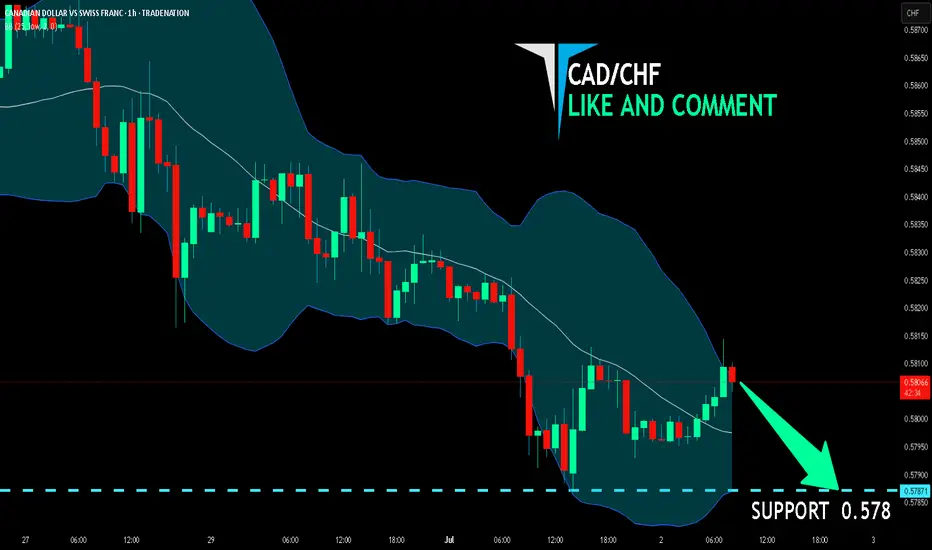
CAD/CHF BEARS WILL DOMINATE THE MARKET|SHORT
Hello, Friends!
We are targeting the 0.578 level area with our short trade on CAD/CHF which is based on the fact that the pair is overbought on the BB band scale and is also approaching a resistance line above thus going us a good entry option.
Disclosure: I am part of Trade Nation's Influencer program and receive a monthly fee for using their TradingView charts in my analysis.
✅LIKE AND COMMENT MY IDEAS✅
CADCHFforex fundamental edge is bearish on CADCHF .
seasonality sentiment and technical support to continue bearish trend
look for sell opportunities at resistance levels

CADCHF - SHORT - Statistically-backed FX shortlistCADCHF - SHORT
Daily Outlook - Statistically-backed FX shortlist
@darksheeptrades

CADCHF BUY SIGNALCADCHF has been visiting new lower price levels; it has found a major support at 0.58174, but in reaching the full potential of its profits, it might face two levels of resistance at 0.58412- TP 1, and 0.58758- TP2. One can place a stoploss at 0.58000.
Risk wisely.....

CAD_CHF WILL KEEP FALLING|SHORT|
✅CAD_CHF broke the key structure level of 0.5840
While trading in a strong downtrend
Which makes me bearish
And I think that after the retest of the broken level is complete
A rebound and bearish continuation will follow
SHORT🔥
✅Like and subscribe to never miss a new idea!✅
Disclosure: I am part of Trade Nation's Influencer program and receive a monthly fee for using their TradingView charts in my analysis.

CAD/CHF – Neutral Bias with Breakout Buy Setup (1H Timeframe)We’re currently analyzing CAD/CHF on the 1-hour chart. While the pair is in a bearish trend, a strong bullish divergence has developed, hinting at possible momentum shift.
There’s no clear reversal pattern or harmonic structure for now, which keeps our bias neutral. Additionally, Myfxbook sentiment shows that 95% of retail traders are long, reflecting strong bullish crowd positioning.
With bulls and bears nearly balanced, we’re waiting for confirmation via breakout above the previous lower high (LH). If price forms a new higher high, that could signal the beginning of a bullish structure.
🔹 Pair: CAD/CHF
🔹 Timeframe: 1H
🔹 Trend: Bearish (with bullish divergence)
🔹 Divergence: Bullish
🔹 Pattern: None
🔹 Harmonic: None
🔹 Sentiment: 95% Long (Myfxbook)
🔹 Bias: Neutral
🔹 Entry (Buy Stop): 0.58856
🔹 Stop Loss: 0.58149
🔹 Take Profit 1: 0.59563
🔹 Lot Size: 0.21
🔹 Risk/Reward: 1:1
🔹 Risk: $200
🔹 Potential Reward: $200
🎯 Strategy: Trade will only activate if price confirms a breakout above the previous LH, shifting market structure to bullish.
📌 #CADCHF #ForexSignals #BullishDivergence #BreakoutTrade #NeutralBias #PriceActionSetup #TrendAnalysis #SmartMoney #1HChart #RetailSentiment #TechnicalSetup #RiskManagement #ForexTradeIdeas

How To Short Sell This Forex Pair In A 4h (Time Frame) EntryAm always a curious person and thats what
allows me to penetrate any culture.I have this knack for adventure.
This is means i enjoy challenging myself.
I dont want to live a boring life.So even when i visit
a "Extremely High" poverty area, am good.
Because i know i have to check in.
Every place in the world has these places.
You have to check in with the G's of
that area otherwise you cooked!!. These areas
are notorious to high crime, and disease.
So if you dont check in bro you f'*d!
Remember every trading signal has to have a double confirmation
think of this double confirmation like
checking in the "hood".
You might be the king in your area
but in another area bro you aint the king.
You have to stay humble.
If you want to learn more you have to check in
with the financial trading experts like myself.
Is that fair? heck no.But you gots to check in man.
If you want more coaching just hit
me up for a reason fee on a monthly
basis and i got you.
Rocket boost this content to learn more.
Disclaimer:Trading is risky learn risk management
and profit taking strategies.Also don't use margin.
Use a simulation trading account
before you trade with real money.

CAD/CHF Loonie Heist: Sniping Swiss Profits with Thief Trading!🌍 Hello Global Traders! 🌟
Money Makers, Risk Takers, and Market Shakers! 🤑💸✈️
Dive into our CAD/CHF "Loonie vs Swiss" Forex heist, crafted with the signature 🔥Thief Trading Style🔥, blending sharp technicals and deep fundamentals. Follow the strategy outlined in the TradingView chart, focusing on a long entry targeting the high-risk MA Zone. Expect a wild ride with overbought conditions, consolidation, and potential trend reversals where bearish players lurk. 🏆💰 Celebrate your wins, traders—you’ve earned it! 💪🎉
Entry 📈: The vault’s open! Grab bullish opportunities at any price, but for precision, set buy limit orders on a 15 or 30-minute timeframe near swing lows or highs for pullback entries.
Stop Loss 🛑:
📍 Place your Thief SL at the recent swing low on the 4H timeframe (0.59400) for scalping or day trades.
📍 Adjust SL based on your risk tolerance, lot size, and number of open orders.
Target 🎯: Aim for 0.61500.
💵 CAD/CHF is riding a bullish wave, fueled by key market drivers. ☝
Unlock the full picture—dive into Fundamentals, Macro Insights, COT Reports, Quantitative Analysis, Sentiment Outlook, Intermarket Trends, and Future Targets. Check 👉🌎🔗.
⚠️ Trading Alert: News & Position Management 📰🚨
News can shake the market hard. Protect your trades by:
Avoiding new entries during news releases.
Using trailing stops to lock in profits and shield running positions.
📌 Markets move fast—stay sharp, keep learning, and adapt your strategy as conditions evolve.
💖 Power up our heist! 🚀 Tap the Boost Button to amplify our Thief Trading Style and make stealing profits a breeze. Join our crew, grow stronger, and conquer the markets daily with ease. 🏆🤝❤️
Catch you at the next heist, traders—stay ready! 🤑🐱👤🤩

CADCHF SellOne strong reason for this trade is that the price clearly broke down from an inverted Cup and Handle pattern and confirmed the move with a small bearish flag, making this a high-probability trend continuation short setup. These patterns together signal strong bearish momentum and give a solid reason for entering a short position.
