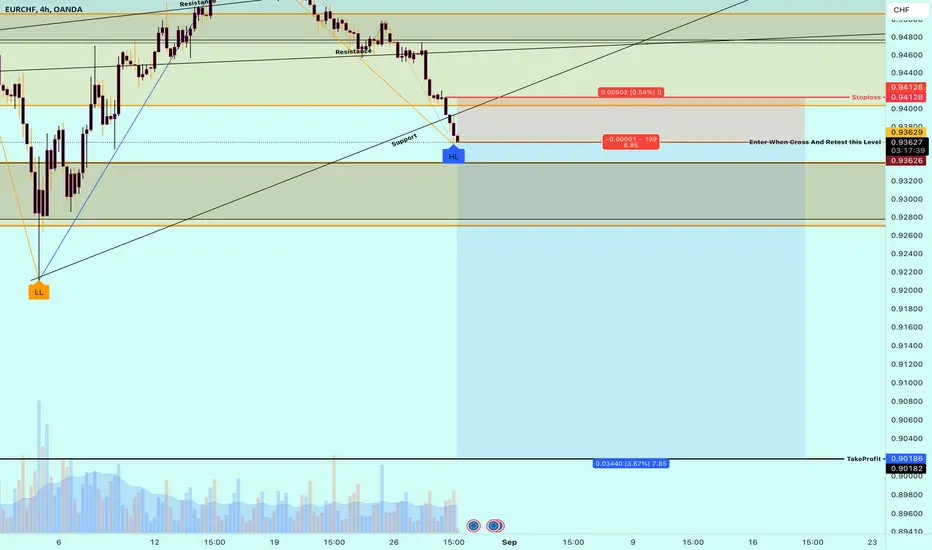
EURCHF going down!! Possible continuation pattern!EURCHF experiencing significant pressure. Given the overall bearish trend will continue going down. Support level is around 0.9378 and resistance is now acting at 0.9413. By looking at 1H and 4H chart market has tendency t o continue declining.
CHFEUR trade ideas

Short EURCHFShort on EURCHF as the euro shows weakness to other currencies as well.
Instead of establishing a solid V-bottom pattern, the euro keeps breaking down support level and staying below the moving averages.

EURCHF - STRONG BERARISH ?hi everyone
here i just share about basic technical analysis
here on Daily chart
so clear to make a lower low (downtrend movement)
so, whatever i do
i just focus short sell
:D
disclaimer
this is not a signal
i just share my idea
be smart
do your own analysis
thanksyou

Sell Trade Idea for EUR/CHF Capitalizing on Economic DivergenceDescription
The EUR/CHF currency pair represents the exchange rate between the Euro and the Swiss Franc, two currencies deeply influenced by the economic policies and conditions within the Eurozone and Switzerland, respectively. Key fundamentals influencing a sell position in EUR/CHF include:
- **Swiss Franc as a Safe Haven:** The Swiss Franc often strengthens in times of global uncertainty due to its status as a safe-haven currency. Recent global economic concerns could drive investors towards the Franc, applying downward pressure on EUR/CHF.
- **Divergent Monetary Policies:** The European Central Bank (ECB) may adopt more dovish policies in response to economic challenges within the Eurozone, while the Swiss National Bank (SNB) might maintain or adjust its policies to support the Franc, potentially weakening the Euro against the Franc.
- **Economic Indicators:** Economic indicators from the Eurozone, such as lower growth forecasts or rising inflation concerns, may negatively impact the Euro’s strength relative to the Swiss Franc.
These fundamentals suggest that the EUR/CHF pair may face downward pressure, presenting a sell opportunity for traders looking to capitalize on these trends.
Disclaimer
Trading in the foreign exchange market involves significant risk and can result in substantial losses. The content provided here is for informational purposes only and should not be considered financial advice. Always conduct your own research, consider your risk tolerance, and consult with a financial advisor before making any trading decisions. Past performance is not indicative of future results, and currency values can fluctuate widely.
EURCHF Sellers In Panic! BUY!
My dear followers,
I analysed this chart on EURCHF and concluded the following:
The market is trading on 0.9387 pivot level.
Bias - Bullish
Technical Indicators: Both Super Trend & Pivot HL indicate a highly probable Bullish continuation.
Target - 0.9450
Safe Stop Loss - 0.9351
About Used Indicators:
A super-trend indicator is plotted on either above or below the closing price to signal a buy or sell. The indicator changes color, based on whether or not you should be buying. If the super-trend indicator moves below the closing price, the indicator turns green, and it signals an entry point or points to buy.
———————————
WISH YOU ALL LUCK

EURCHF TOP DOWN ANALYSIS PLUS TRADEIn the following video I break down the EURCHF pair and explain my sell trade. This trade is running on MT5.

EURCHFHello traders, after analyzing the 4-hour time frame, the price is moving within a descending channel. As the price approaches the demand zone, which aligns with the 61% and 78% Fibonacci levels, I anticipate that we can enter a buy position if a CHoCH pattern forms in a lower time frame. In this scenario, the target could be the 38% Fibonacci resistance level, which aligns with the top of the descending channel. If the price breaks out above this resistance at 0.9475, the next key resistance level will be 0.96300, which aligns with the supply zone and the 78% Fibonacci level. At this level, we can look for confirmation to enter a sell position.

EUR/CHF For Bearishyou can go short now
- General Trend is Down
- EUR is Weak
- Price Break current support
- i think it will retest that broken support and then go down
have fun :)

SELL EURCHF - trade explained in detailTrader Tom, a technical analyst with over 15 years’ experience, explains his trade idea using price action and a top down approach. This is one of many trades so if you would like to see more then please follow us and hit the boost button.

EURCHF: Important BreakoutEURCHF has broken through and closed below an important horizontal support level during the day.
This broken level is now acting as resistance. It is possible that the market will continue to decline. The next resistance level to watch for is at 0.9378.

EURCHF - 4hrs ( Sell Trade Target Range 140 PIP ) Pair Name : EUR/CHF
Time Frame : 4hrs Chart / Close
Scale Type : Large Scale
------
spreading knowledge among us and to clarify the most importan+t points of entry, exit and entry with more than 5 reasons
We seek to spread understanding rather than make money
Key Technical / Direction ( Short )
Type : Mid Term Swing
———————————
Bearish Break
0.94300 area
Reasons
- Major Turn level
- Visible Range Lvn
- Pattern Break
- Turn level
- Day / week low
Bullish Reversal
0.93000 Area
Reasons
- Major Turn level
- Visible Hvn
- Pattern Target
- Fibo Golden
- Quarter Area
- Choch Zone

Eurchf for shortEurchf for short. Wait for break and retest of the zone below.monthly is bearish, weekly is also bearish.

EURCHF Technical Analysis and Trade Idea👀👉 I’m closely monitoring the EURCHF currency pair. Currently, we’re observing a market structure break with a higher high on the chart, along with the potential formation of a base that could lead to further upward movement. If the market conditions align as discussed in the video, I’ll be looking for a buying opportunity.
This analysis highlights key elements of technical analysis, including trend identification, price action, and market structure. We'll also outline a potential trade setup and explore strategies to enhance the likelihood of success.
Please remember, this analysis is for educational purposes only and should not be considered financial advice. The observations made are speculative and do not guarantee future market outcomes. It’s crucial to verify current price actions before making any trading decisions.
This presentation provides a thorough review of the current trend, market structure, and price dynamics. However, it’s essential to understand that while this information is educational, it does not ensure trading success. Trading in the foreign exchange market carries significant risks, and we strongly recommend applying sound risk management practices in all your trades.
We urge you to conduct extensive research and carefully consider all factors before making any trading decisions. Stay informed, exercise caution, and approach the markets with a well-crafted strategy. 📊✅

EURCHF: Market of Buyers
The analysis of the EURCHF chart clearly shows us that the pair is finally about to go up due to the rising pressure from the buyers.
❤️ Please, support our work with like & comment! ❤️

Bullish rise?EUR/CHF is reacting off the support level which is an overlap support and could rise from this level to our take profit.
Entry: 0.94637
Why we like it:
There is an overlap support level.
Stop loss: 0.93811
Why we like it:
There is an overlap support level which lines up with the 50% Fibonacci retracement.
Take profit: 0.95768
Why we like it:
There is a pullback resistance.
Please be advised that the information presented on TradingView is provided to Vantage (‘Vantage Global Limited’, ‘we’) by a third-party provider (‘Everest Fortune Group’). Please be reminded that you are solely responsible for the trading decisions on your account. There is a very high degree of risk involved in trading. Any information and/or content is intended entirely for research, educational and informational purposes only and does not constitute investment or consultation advice or investment strategy. The information is not tailored to the investment needs of any specific person and therefore does not involve a consideration of any of the investment objectives, financial situation or needs of any viewer that may receive it. Kindly also note that past performance is not a reliable indicator of future results. Actual results may differ materially from those anticipated in forward-looking or past performance statements. We assume no liability as to the accuracy or completeness of any of the information and/or content provided herein and the Company cannot be held responsible for any omission, mistake nor for any loss or damage including without limitation to any loss of profit which may arise from reliance on any information supplied by Everest Fortune Group.

EURCHF 25/08/2024Weekly:
-Sellside liquidity taken.
-Weekly lows rejected.
Daily:
-Bullish M pattern.
-IC acting as magnet for price.
4H:
-Bullish M pattern.

eurchf sell idea trade #2looking to see price create a LH which ill be looking for high probability trade sell ideas. i have an aggressive and a conservative approach to this trade. my risk on my aggressive approach is a lot tighter than the conservative approach which is why im considering entering the aggressive zone then scale in at the conservative zone.

EURCHF SETUP COMINGEURCHF isnt our favorite pair in any way.. however we have a good opturtunity to take a nice swing back to the highs. We think CHF is ready to start weakening on other charts also so lets see.

EURCHF Is Bullish! Buy!
Take a look at our analysis for EURCHF.
Time Frame: 3h
Current Trend: Bullish
Sentiment: Oversold (based on 7-period RSI)
Forecast: Bullish
The market is approaching a significant support area 0.947.
The underlined horizontal cluster clearly indicates a highly probable bullish movement with target 0.951 level.
P.S
The term oversold refers to a condition where an asset has traded lower in price and has the potential for a price bounce.
Overbought refers to market scenarios where the instrument is traded considerably higher than its fair value. Overvaluation is caused by market sentiments when there is positive news.
Like and subscribe and comment my ideas if you enjoy them!

EURCHF BEARISH MOVEEURCHF bears move due to clear price action provided by technical data and also clear bears trend

EURCHF: Swing Trading & Technical Analysis
Balance of buyers and sellers on the EURCHF pair, that is best felt when all the timeframes are analyzed properly is shifting in favor of the buyers, therefore is it only natural that we go long on the pair.
❤️ Please, support our work with like & comment! ❤️

EURCHF - Down Trend Continues towards DemandEURCHF is in a long term downtrend.
We have seen a recent rally from .9300 rejected of the Supply Zone at .9580.
The market structure is contained , with the prior swing high intact.
Price is now moving back towards the Demand Zone , within a defined Channel.
The near term outlook is biased bearish , and opportunities sought to go short off trendline resistance.

EURCHF Will Move Higher! Long!
Here is our detailed technical review for EURCHF.
Time Frame: 6h
Current Trend: Bullish
Sentiment: Oversold (based on 7-period RSI)
Forecast: Bullish
The price is testing a key support 0.946.
Current market trend & oversold RSI makes me think that buyers will push the price. I will anticipate a bullish movement at least to 0.952 level.
P.S
The term oversold refers to a condition where an asset has traded lower in price and has the potential for a price bounce.
Overbought refers to market scenarios where the instrument is traded considerably higher than its fair value. Overvaluation is caused by market sentiments when there is positive news.
Like and subscribe and comment my ideas if you enjoy them!
