EURCHF is gaining momentum for upsideEURCHF is rising price is making HH and HL, currently trading near trend line good opportunity for buyers to buy at current level with stop loss at previous higher low.
CHFEUR trade ideas

EURCHF Potential Sell SetupEURCHF Potential sell setup
Base on elliotwave advanced pattern, this is a high probabilistic sell setup
Importantly, your risk management will keep you in the game

BASE / LIQUIDITY CONCEPTIn this analysis , here I'm looking for a potential buy today. Because here we have a BASE and market also sweep previous SSL liquidity. let's delve deeper into these levels and potential outcomes.
# EUR/CHF (1H) Timeframe Technical Analysis Expected Move.
This is only just my prediction and analysis.

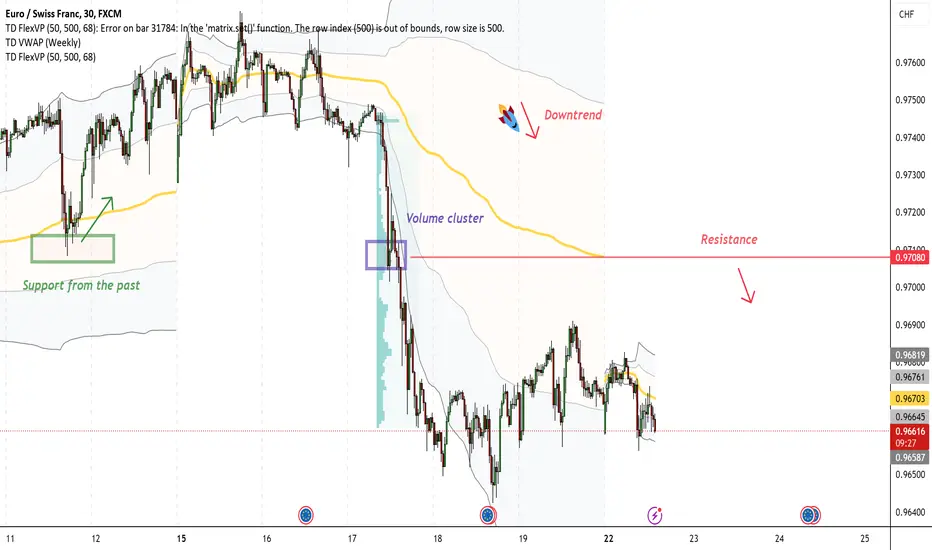
EUR/CHF Day Trading Analysis With Volume ProfileOn EUR/CHF , it's nice to see a strong sell-off from the price of 0.97080. It's also encouraging to observe a strong volume area where a lot of contracts are accumulated.
I believe that sellers from this area will defend their short positions. When the price returns to this area, strong sellers will push the market down again.
The downtrend combined with the strong volume area along with the strong S/R area from the past are my main reasons for this short trade.
Happy trading,
Dale
EURCHF: Bearish Movement After Breakout 🇪🇺🇨🇭
EURCHF looks bearish after a breakout of a key daily support.
Retesting the broken structure, the pair formed an inverted cup and handle pattern.
The last 4H candle closed below its neckline.
We can expect a bearish move now to 0.9644
❤️Please, support my work with like, thank you!❤️

EUR/CHF BEARISH CONTINUATIONAs you can see a clearly bearish flag has have been formed in the chart and has so many potential to the donwside of the market.

EUR/CHF SELL BEARISH FLAGAs you can see the price its consolidating for a little bit, and if the price exits in the bearish flag its a very secure sell entry for all the day trading sellers in the market

EURCHF SHORTEURCHF might continue being bearish. Let's see how the week ahead unfolds. HAPPY TRADING !!!


EURCHF SELL TRADEAfter my last successful AUDNZD trade, EURCHF is resisted by a key resistance and if this level hold, it will go down fast.
The pair has been bearish for 2 years now and and it made a strong bullish pullback and consolidated for a while.


Eurchf Eurchf is on a down trend both on 4hr 1 day and 1 week time frame so we expect a pull back to the zone then we go for a short

Eurchf Eurchf is on a down trend both on 4hr 1 day and 1 week time frame so we expect a pull back to the zone then we go for a short

#EURCHF#EURCHF
Playing nice for possible sell continuation, expecting price to push to the support level at $0.94816
#forex #forextrading #forexsignals #crypto #forexlifestyle #money #lifestyle #trade #stock #cash #iphone #daytrading #currencytrading #tradingonline #swingtrading #profit #forextips

EURCHF Is Very Bullish! Buy!
Please, check our technical outlook for EURCHF.
Time Frame: 6h
Current Trend: Bullish
Sentiment: Oversold (based on 7-period RSI)
Forecast: Bullish
The market is approaching a significant support area 0.966.
The underlined horizontal cluster clearly indicates a highly probable bullish movement with target 0.970 level.
P.S
The term oversold refers to a condition where an asset has traded lower in price and has the potential for a price bounce.
Overbought refers to market scenarios where the instrument is traded considerably higher than its fair value. Overvaluation is caused by market sentiments when there is positive news.
Like and subscribe and comment my ideas if you enjoy them!

EURCHF is BearishPrice has broken the ascending trendline after bearish RSI divergence appeared on four hourly time frame, and has also defined a lower low, which according to Dow theory marks the beginning of a bearish rally. Targets are mentioned on the chart.

EURCHF Day Trade Sell LimitA crazy bear running 120pips in two days ,
pay back !!
haha....joking........
Day Trade.
Staytune

BUY EURCHFAlthough I see this pair having a huge long-term buy, I am personally a short term trader and i like to catch the short runs then leave. so in this case I personally believe the eurchf will have a short buy due to the curvature of the candles and the heavy resistance on the higher timeframes

EURCHF - Forecast Main Refinancing RateForecast Main Refinancing Rate
Opportunity for EURCHF. This setup trading idea is for intraday. >> TAYOR
Risk Factors:
1. Market conditions, unexpected news, or external events could impact the trade.
2. Always use risk management strategies to protect your capital.

Eurchf is the trade of the WeekThe reason for taking this trade is
1. All Timeframes are bearish
2. It is currently resisting a daily AOI zone
3. There was a strong bearish engulfing candlestick on the 2hr timeframe
4. I waited for a 15mins engulfing candlestick before entering
5. It's only wise to go with the trend cause the trend is our friend.

EURCHF: Market Sentiment & Forecast
The recent price action on the EURCHF pair was keeping me on the fence, however, my bias is slowly but surely changing into the bullish one and I think we will see the price go up.
❤️ Please, support our work with like & comment! ❤️

EUR/CHF: Bearish Signals and Breakout Opportunities✨Welcome to my channel. Here, we conduct a daily analysis of crypto projects and forex pairs.
📅 Today's Analysis: Today, we'll be diving into the Forex market and analyzing the EUR/CHF.
📉 Recent Performance
The EUR/CHF pair has seen significant movements recently, breaking through multiple support and resistance levels. The primary support at 0.95366 and resistance at 0.99155 are key areas to watch.
⚠️ Bearish Momentum
The RSI is currently at 45.71, indicating potential bearish momentum. If the RSI drops below 30, we could see increased selling pressure.
📊The pair is currently in the 0.618 to 0.707 Fibonacci range. If it breaks below 0.94838, the next target could be around 0.93119.
🔻Short Position Strategy
A confirmed break below the 0.94838 support level with increased sell volume would be an ideal short entry point. The target for this move could be the next support at 0.93119.
🔼Long Position Strategy
For a long position, wait for a clear breakout above the resistance at 0.99155 with increased buy volume. This would signal a potential bullish reversal.
📝 In conclusion, EUR/CHF is showing bearish signals with critical levels to watch. A short position could be triggered below 0.94838, while a long position is advisable only after a breakout above 0.99155. Always monitor volume and RSI closely to confirm momentum and manage risk appropriately.
⚠️Please note that this is not financial advice. I'm simply introducing this project to you, and remember always to do your own research.
🫶 If you found this analysis helpful and want to support me, please boost this analysis. Feel free to leave a comment or suggest a coin you'd like me to analyze next.

EURCHF: Short ScenariosHello Traders,
There are 2 possible short trades are here!
1st: On top of the short-term channel
2nd: After break of the channel
There is a possible bullish scenarios after breaking over the zone. I'll post about it if happen.
