GBPCHF Is Going Up! Buy!
Here is our detailed technical review for GBPCHF.
Time Frame: 1D
Current Trend: Bullish
Sentiment: Oversold (based on 7-period RSI)
Forecast: Bullish
The market is trading around a solid horizontal structure 1.135.
The above observations make me that the market will inevitably achieve 1.149 level.
P.S
Overbought describes a period of time where there has been a significant and consistent upward move in price over a period of time without much pullback.
Like and subscribe and comment my ideas if you enjoy them!
CHFGBP trade ideas


GBPCHF - breakout, pullback setupGoing long GBPCHF - breakout /retest setup.
Small position size to start, will add more positions if this works out.
This is not a trade recommendation, merely my own analysis. Trading carries a high level of risk, so only trade with money you can afford to lose and carefully manage your capital and risk. If you like my idea, please give a “boost” and follow me to get even more. Please comment and share your thoughts too!!
It’s not whether you are right or wrong, but how much money you make when you are right and how much you lose when you are wrong – George Soros

GBP/CHF Testing Channel Support – Breakout or Support Hold?GBP/CHF is moving in an upward channel, meaning the price has been going up while staying within a set range. Right now, it's sitting at the support level of the channel, which is an important point.
If the price breaks below this support, it could mean sellers are taking control, and the price may drop further, possibly down to 1.1100.
But if the support holds, buyers might step in, pushing the price back up and keeping it inside the channel. In that case, it will continue following the upward trend.

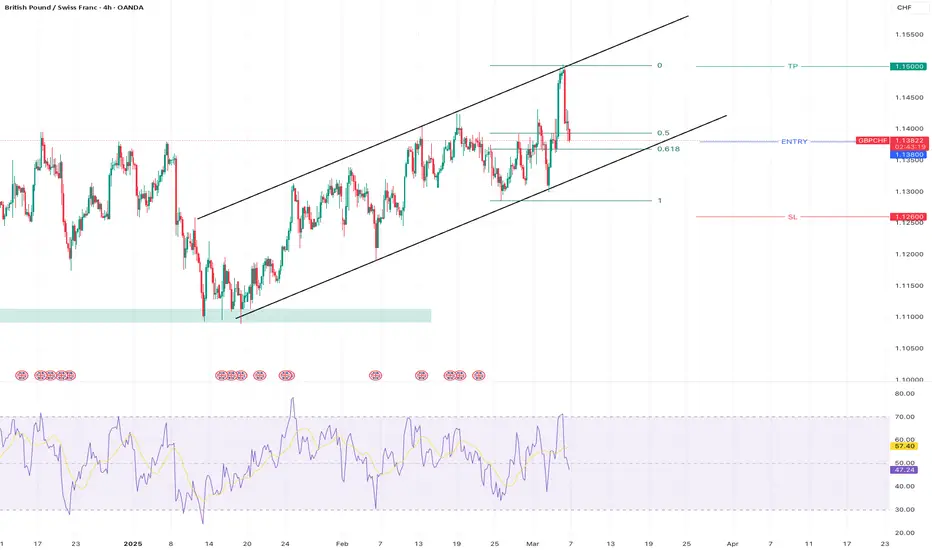
GBPCHF - BullishGBPCHF is bullish in an ascending parallel channel on 4H timeframe. Currently it is testing Fib 0.618 level. Buy at current levels
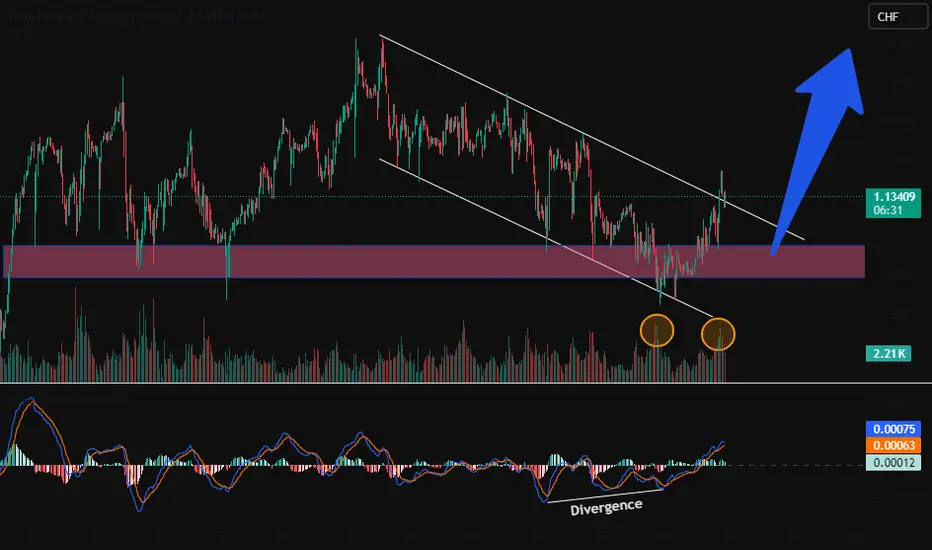
GBPCHF - Divergence Supported and Vol Driven Break outGBPCHF has broken out from parallel descending price channel with volume supported order block. It also printed bullish divergence on MACD scale before the break out. We can therefore expect resumption of bull trend after test of important resistance cum support area.
GBPCHF buy oppourtunities Looking at the GBPCHF pair price had a bullish push leaving an imbalance and breaking the previous structure. Now waiting for price to reach the 71/75% to take ling position and targeting the current high

GBPCHF-BULLISH TRENDGBPCHF is in bull run as it is continue to print new HH and HL's within bullish channel.

GBPCHF- Buy IdeaGBPCHF is currently is in an uptrend and has just above the resistance with a strong momentum. Right now, the price is retesting a previous resistance zone which is now acting as a support zone. Look to buy if the price holds above this level.

GBPCHF - LongGBPCHF is moving in bullish trend.
No bearish divergence is formed.
Entry is at the retracement at HL.


GBP_CHF SWING LONG|
✅GBP_CHF made a bullish
Breakout of the key horizontal
Level of 1.1400 and the breakout
Is confirmed so we are bullish
Biased and we will be expecting
A further move up and a retest
Of the horizontal resistance
Above around 1.1606
LONG🚀
✅Like and subscribe to never miss a new idea!✅

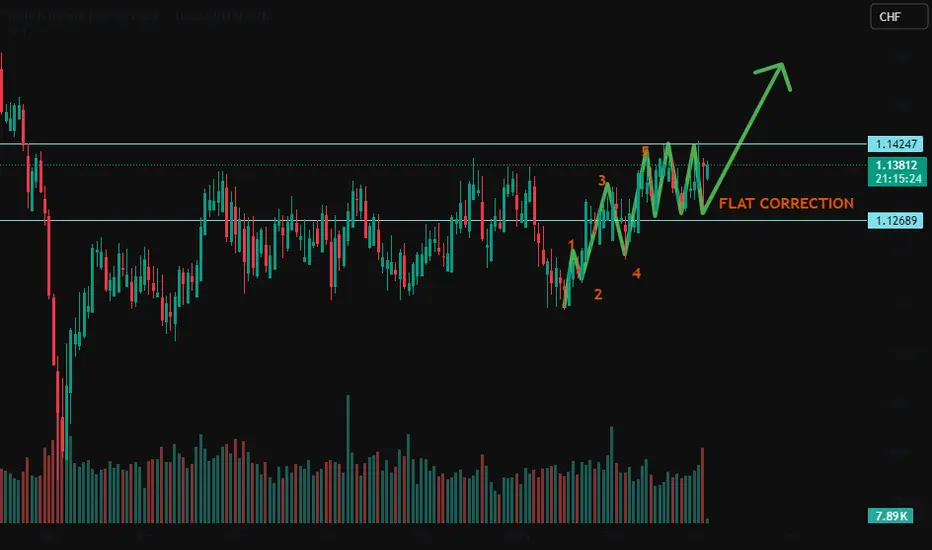
GBPCHF - Fresh Impulse in Waiting after Flat CorrectionGBPCHF seems to be completing a flat correction pattern after bullish impulsive move. A break out from rectangular corrective range may result in fresh impulsive wave. Long positions can be considered with in the corrective range by aggressive buyers.
Idea on a chart Waiting for a 3 pin rejection on a head and shoulders. then go to lower time frames enter.
During the trading session on Monday, we have seen the British pound spiking against the Swiss franc, slicing through the 1.14 level.
This is an area that’s been important multiple times, so I do find it interesting that we are continuing to see a certain amount of strength.
If we can break above the top of the candlestick for the Monday session, that would be a very positive sign, perhaps sending this market much higher.

GBP/CHF Wedge Breakout (05.3.25)The GBP/CHF pair on the M30 timeframe presents a Potential Buying Opportunity due to a recent Formation of a Wedge Breakout Pattern. This suggests a shift in momentum towards the upside and a higher likelihood of further advances in the coming hours.
Possible Long Trade:
Entry: Consider Entering A Long Position around Trendline Of The Pattern.
Target Levels:
1st Resistance – 1.1458
2nd Resistance – 1.1504
🎁 Please hit the like button and
🎁 Leave a comment to support for My Post !
Your likes and comments are incredibly motivating and will encourage me to share more analysis with you.
Best Regards, KABHI_TA_TRADING
Thank you.

GBPCHF Trading Opportunity! SELL!
My dear subscribers,
My technical analysis for GBPCHF is below:
The price is coiling around a solid key level - 1.1403
Bias - Bearish
Technical Indicators: Pivot Points Low anticipates a potential price reversal.
Super trend shows a clear sell, giving a perfect indicators' convergence.
Goal - 1.1366
About Used Indicators:
By the very nature of the supertrend indicator, it offers firm support and resistance levels for traders to enter and exit trades. Additionally, it also provides signals for setting stop losses
———————————
WISH YOU ALL LUCK

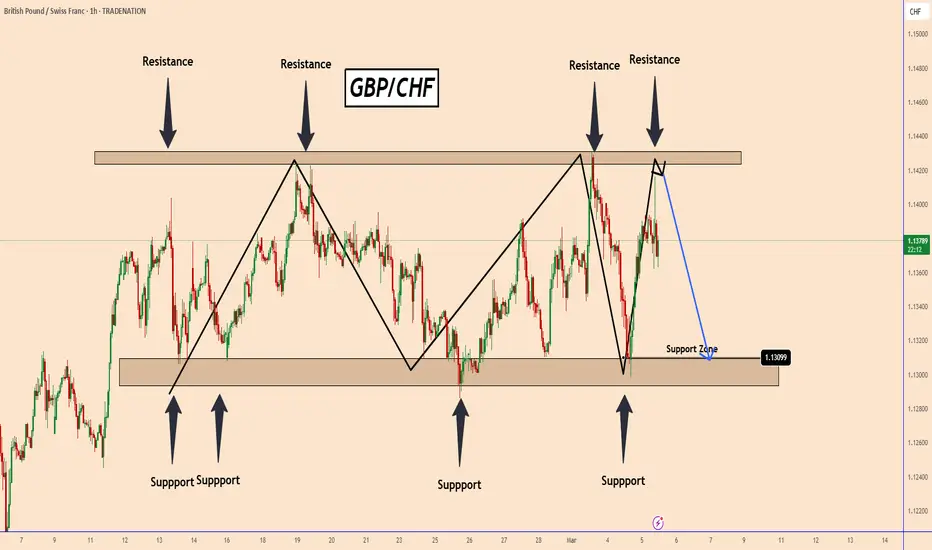
GBPCHF: Resistance Zone Tested, What's Next?GBPCHF: Resistance Zone Tested, What's Next?
GBP/CHF: The pair has been fluctuating within a range trading pattern for several days.
Both currencies remain strong, influenced by different factors. The Swiss Franc (CHF), known as a safe-haven currency, continues to maintain its status.
Given that GBP/CHF has already tested a strong resistance zone near the top, there is a possibility that the pair could move down again to the 1.1310 level.
Let's observe how the price action develops this time.
You may find more details in the chart!
Thank you and Good Luck!
❤️PS: Please support with a like or comment if you find this analysis useful for your trading day❤️
Disclosure: I am part of Trade Nation's Influencer program and receive a monthly fee for using their TradingView charts in my analysis.
GBPCHFWe can attempt to buy GBPCHF from specified level as it make HL , also there is no bearish divergence occur indicate that it moves upward.
SL , TP mention in chart.


GBPCHF Set To Fall! SELL!
My dear followers,
I analysed this chart on GBPCHF and concluded the following:
The market is trading on 1.1403 pivot level.
Bias - Bearish
Technical Indicators: Both Super Trend & Pivot HL indicate a highly probable Bearish continuation.
Target - 1.1347
Safe Stop Loss - 1.1433
About Used Indicators:
A super-trend indicator is plotted on either above or below the closing price to signal a buy or sell. The indicator changes color, based on whether or not you should be buying. If the super-trend indicator moves below the closing price, the indicator turns green, and it signals an entry point or points to buy.
———————————
WISH YOU ALL LUCK

GBPCHF - 04 Mar - BullishGBPCHF broke down with good volume yesterday on the key level. It seems GBPCHF successfully retested the Key level a few hours ago. Thus, I think it shall be bullish.

Bearish drop off pullback resistance?GBP/CHF has reacted off the pivot which acts as a pullback resistance and could drop to the 1st support which has been identified as a pullback support.
Pivot: 1.1402
1st Support: 1.1320
1st Resistance: 1.1459
Risk Warning:
Trading Forex and CFDs carries a high level of risk to your capital and you should only trade with money you can afford to lose. Trading Forex and CFDs may not be suitable for all investors, so please ensure that you fully understand the risks involved and seek independent advice if necessary.
Disclaimer:
The above opinions given constitute general market commentary, and do not constitute the opinion or advice of IC Markets or any form of personal or investment advice.
Any opinions, news, research, analyses, prices, other information, or links to third-party sites contained on this website are provided on an "as-is" basis, are intended only to be informative, is not an advice nor a recommendation, nor research, or a record of our trading prices, or an offer of, or solicitation for a transaction in any financial instrument and thus should not be treated as such. The information provided does not involve any specific investment objectives, financial situation and needs of any specific person who may receive it. Please be aware, that past performance is not a reliable indicator of future performance and/or results. Past Performance or Forward-looking scenarios based upon the reasonable beliefs of the third-party provider are not a guarantee of future performance. Actual results may differ materially from those anticipated in forward-looking or past performance statements. IC Markets makes no representation or warranty and assumes no liability as to the accuracy or completeness of the information provided, nor any loss arising from any investment based on a recommendation, forecast or any information supplied by any third-party.

