CHFJPY BUY IDEAPrice recently broke a resistance trendline on the daily timeframe. Now, it is coming back to test the broken trendline which coincides with a resistance-turned support level. This provides a strong buying level at the dotted area which is the point of interaction between the trendline and the broken resistance-turned support.
CHFJPY trade ideas

CHF/JPY "Swiss vs Yen" Forex Bank Heist Plan (Swing/Day)🌟Hi! Hola! Ola! Bonjour! Hallo! Marhaba!🌟
Dear Money Makers & Robbers, 🤑 💰💸✈️
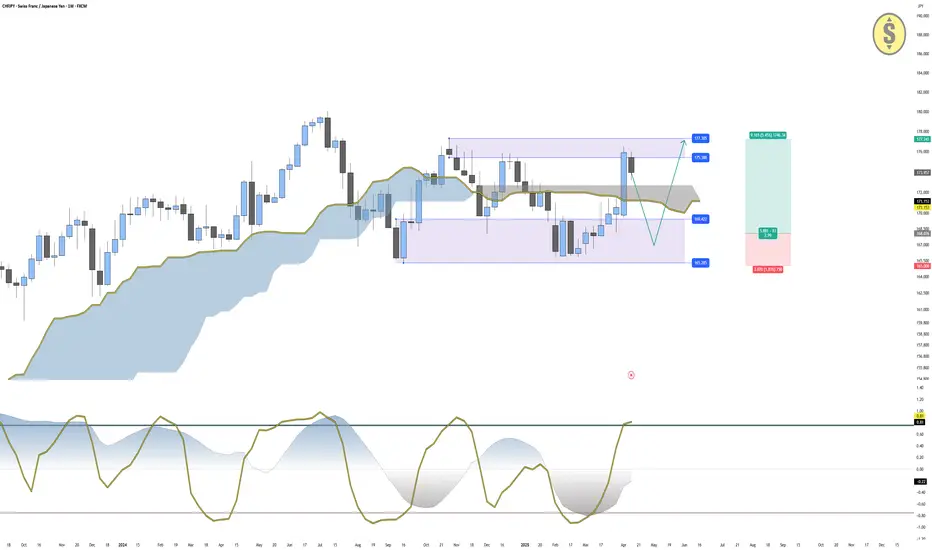
Based on 🔥Thief Trading style technical and fundamental analysis🔥, here is our master plan to heist the CHF/JPY "Swiss vs Yen" Forex Market. Please adhere to the strategy I've outlined in the chart, which emphasizes long entry. Our aim is the high-risk ATR Zone. Risky level, overbought market, consolidation, trend reversal, trap at the level where traders and bearish robbers are stronger. 🏆💸"Take profit and treat yourself, traders. You deserve it!💪🏆🎉
Entry 📈 : "The heist is on! Wait for the MA breakout (172.500) then make your move - Bullish profits await!"
however I advise to Place Buy stop orders above the Moving average (or) Place buy limit orders within a 15 or 30 minute timeframe most recent or swing, low or high level.
📌I strongly advise you to set an "alert (Alarm)" on your chart so you can see when the breakout entry occurs.
Stop Loss 🛑: "🔊 Yo, listen up! 🗣️ If you're lookin' to get in on a buy stop order, don't even think about settin' that stop loss till after the breakout 🚀. You feel me? Now, if you're smart, you'll place that stop loss where I told you to 📍, but if you're a rebel, you can put it wherever you like 🤪 - just don't say I didn't warn you ⚠️. You're playin' with fire 🔥, and it's your risk, not mine 👊."
📍 Thief SL placed at the recent/swing low level Using the 4H timeframe (169.700) Day / swing trade basis.
📍 SL is based on your risk of the trade, lot size and how many multiple orders you have to take.
🏴☠️Target 🎯: 175.500 (or) Escape Before the Target
🧲Scalpers, take note 👀 : only scalp on the Long side. If you have a lot of money, you can go straight away; if not, you can join swing traders and carry out the robbery plan. Use trailing SL to safeguard your money 💰.
CHF/JPY "Swiss vs Yen" Forex Market Heist Plan (Swing / Day Trade) is currently experiencing a bullishness,., driven by several key factors.👇👇👇
📰🗞️Get & Read the Fundamental, Macro, COT Report, Quantitative Analysis, Sentimental Outlook, Intermarket Analysis, Future trend targets..., go ahead to check 👉👉👉🔗
Detailed Explanation 🗣️
Point 1: Fundamentals balance CHF stability 🛡️ with JPY’s inflation-driven gains 🔥, but CHF edges out due to resilience 💪.
Point 2: Macro favors CHF’s safe-haven status 🛡️ over JPY’s debt-laden economy 📉.
Point 3: Global risk-off tilts toward CHF 🌍, though JPY holds as a secondary safe haven ⚖️.
Point 4: COT data supports CHF bullishness 📈, with institutional backing 🏦.
Point 5: Intermarket gold 🏅 and equity trends 📉 reinforce CHF strength 💪.
Point 6: Quantitative neutrality ⚖️ suggests a breakout is imminent, likely upward 📈.
Point 7: Sentiment leans bullish 📈, driven by institutions 🏦, with retail caution 🤔.
Point 8: Trends project short-term gains 🚀, medium-term consolidation ⚖️, and long-term uncertainty 🔮.
Point 9: Bullish outlook reflects CHF’s dominance in current conditions 📈.
⚠️Trading Alert : News Releases and Position Management 📰 🗞️ 🚫🚏
As a reminder, news releases can have a significant impact on market prices and volatility. To minimize potential losses and protect your running positions,
we recommend the following:
Avoid taking new trades during news releases
Use trailing stop-loss orders to protect your running positions and lock in profits
💖Supporting our robbery plan 💥Hit the Boost Button💥 will enable us to effortlessly make and steal money 💰💵. Boost the strength of our robbery team. Every day in this market make money with ease by using the Thief Trading Style.🏆💪🤝❤️🎉🚀
I'll see you soon with another heist plan, so stay tuned 🤑🐱👤🤗🤩

CHFJPY TECHNICAL AND FUNADEMENTALS DETAILS ANALYSISCHFJPY has just broken out of a long-term descending channel on the daily chart, currently trading near 174.09. This breakout is technically significant, as it marks the end of a prolonged downtrend and suggests the beginning of a potential bullish reversal. The price action shows a clean breakout above the upper channel resistance, followed by a healthy retest—textbook price behavior when momentum shifts to the upside. With this structure flip, we are now positioning for a continuation towards the 182.40 zone, which aligns with a previous key resistance and measured move projection.
This breakout is supported by strong fundamentals. The Swiss Franc remains firm, driven by Switzerland’s resilient economic data and the Swiss National Bank’s cautious monetary stance. Meanwhile, the Japanese Yen continues to struggle as the Bank of Japan maintains its ultra-loose policy, despite recent signs of inflation picking up. The yield differential and risk-on sentiment are weighing heavily on JPY, making it an ideal quote currency for this bullish CHF move. Traders are increasingly favoring CHFJPY in the current macro landscape due to this divergence.
What makes this setup even more attractive is the clean technical structure paired with a favorable risk-reward ratio. The stop below the retest area around 171.63 offers tight risk management, while the upside potential toward 182.40 presents a strong 1:3+ R/R swing opportunity. These types of breakouts—especially after extended consolidation—often lead to trend-following momentum plays that institutions favor.
CHFJPY is now on many watchlists across TradingView due to this breakout from a descending channel, which is a highly searched pattern by technical traders. This pair is poised to deliver a profitable swing trade backed by both technical strength and macro alignment. If momentum continues, we could see a strong bullish leg throughout Q2.

CHF-JPY Will Go UP! Buy!
Hello,Traders!
CHF-JPY is trading in an
Uptrend and the pair is
Hovering just above the
Horizontal support level
Around 172.900 so we
Are bullish biased and
We will be expecting a
Swing move up on Monday
Buy!
Comment and subscribe to help us grow!
Check out other forecasts below too!
Disclosure: I am part of Trade Nation's Influencer program and receive a monthly fee for using their TradingView charts in my analysis.

CHFJPY Weekly – Waiting for Pullback Before Bullish ContinuationCHF/JPY is currently trading at 173.95, having recently rejected the resistance area between 175.00 and 177.00. The rejection aligns with a Trend Strength Index (TSI 10) reading of 0.81, indicating short-term overbought conditions and suggesting that a pullback is likely before any new bullish continuation.
The price is trading above the Ichimoku cloud (Span A at 171.15 and Span B at 171.40), which supports a bullish bias. However, price action over the past months shows a clear sideways consolidation range between 165.00 and 177.00, where bullish momentum has recently weakened (TSI 20 at -0.22).
Given this context, the optimal approach is to wait for a pullback into the support zone between 169.00 and 165.00, where the market has historically found demand. A bullish reaction from this zone could offer a high-quality trend continuation setup toward the upper boundary of the range at 177.00, and potentially toward the range extension at 179.30.
Trade Setup Summary:
Buy Zone: 169.00 – 165.00 (support + range bottom)
Target 1: 177.00 (range resistance)
Target 2: 179.30 (extension above range)
Invalidation: Break below 165.00
Bias: Bullish while above range bottom
TSI: Wait for a reset into neutral or oversold zone for confirmation
The Swiss franc continues to be supported by its safe-haven status, though recent SNB rate cuts have slightly weakened its strength. Meanwhile, the Japanese yen remains fundamentally weak due to the Bank of Japan's persistent ultra-loose monetary policy. This macro backdrop favors CHF strength in the medium term, aligning with the technical setup for a bullish continuation, especially if global risk sentiment remains stable or tilts positive.
Disclaimer: This content is for educational and informational purposes only. It does not represent financial advice or a recommendation to buy or sell any financial instrument. Trading involves risk, and you should only trade with money you can afford to lose.
CHFJPY SHORTI see on daily divergence, we have trend line brake two times on 1h that is indication for short.

CHF/JPY BUYERS WILL DOMINATE THE MARKET|LONG
Hello, Friends!
We are targeting the 175.525 level area with our long trade on CHF/JPY which is based on the fact that the pair is oversold on the BB band scale and is also approaching a support line below thus going us a good entry option.
Disclosure: I am part of Trade Nation's Influencer program and receive a monthly fee for using their TradingView charts in my analysis.
✅LIKE AND COMMENT MY IDEAS✅

100+ Pips on the Table — CHFJPY Just Flashed a Buy SignalCHFJPY DAILY TECHNICAL ANALYSIS 🕵🏽♂️
🧠 Strategy Spotlight: CHFJPY's Uptrend Has One Last Launchpad
OVERALL TREND
📈 UPTREND — Bullish structure with consistent higher highs and higher lows forming since March 2025.
📉RESISTANCE
🔴 180.070 — SELL STOPLOSS | PIVOT HIGH
🔴 179.705 — RESISTANCE (MAJOR)
🔴 179.339 → 177.862 — SELL ORDER RANGE
🔴 177.014 — RESISTANCE (PROXIMAL)
🔴 175.526 — RESISTANCE (MINOR)
📊ENTRIES & TARGETS
🎯 177.115 — BUY ORDER & TP4
🎯 174.428 — BUY ORDER & TP3
🎯 172.684 — BUY ORDER & TP2
🎯 170.173 — BUY ORDER & TP1
📈SUPPORT
🟡 167.606 — SUPPORT (PROXIMAL)
🟡 167.505 → 166.0375 — BUY ORDER RANGE
🟡 165.858 — SUPPORT (MAJOR)
🟡 165.299 — BUY STOPLOSS | PIVOT LOW
🤓STRUCTURAL NOTES
Recent candle wicked above 175.52600 (minor resistance) but failed to close strong — indicating hesitation or seller defense
High confluence at the 177.11–177.86 zone with both pivot highs and active sell orders
Uptrend structure still intact unless price breaks below 170.17392 with volume and closes under 167.06957
Volume and momentum required to reclaim 177.86 and push toward major resistance at 180.07
TRADE OUTLOOK 🔎
📈 Active Long Bias above 170.17 (TP1) with bullish targets toward TP4 @ 177.11
📉 Bearish setup only activates if price fails to reclaim 175.52 and decisively breaks below 170.17
👀 Watch for reaction at 175.52 (Minor Resistance) — potential rejection could trigger short-term pullback to TP2 @ 172.68
🧪STRATEGY RECOMMENDATION
CONSERVATIVE APPROACH (Trend-Following):
— Buy Entry: 170.17
— TP Levels: 172.68 / 174.42 / 177.11
— SL: Below 167.06
HIGH-RISK REVERSAL SCALP:
— Sell Order @ 175.52 or 177.11
— TP: 172.68 / 170.17
— SL: Above 177.86
“Discipline | Consistency | PAY -tience”

CHF_JPY BULLISH BIAS|LONG|
✅CHF_JPY is set to retest a
Strong support level below
After trading in a local downtrend from some time
Which makes a bullish rebound a likely scenario
With the target being a local resistance above
LONG🚀
✅Like and subscribe to never miss a new idea!✅
Disclosure: I am part of Trade Nation's Influencer program and receive a monthly fee for using their TradingView charts in my analysis.

A 1000 pips CHF/JPY sell opportunity the CHF Index is super bearish and the CHFJPY pair has completed the X wave now we on to the Y to complete WXY or it's completely a down trend.

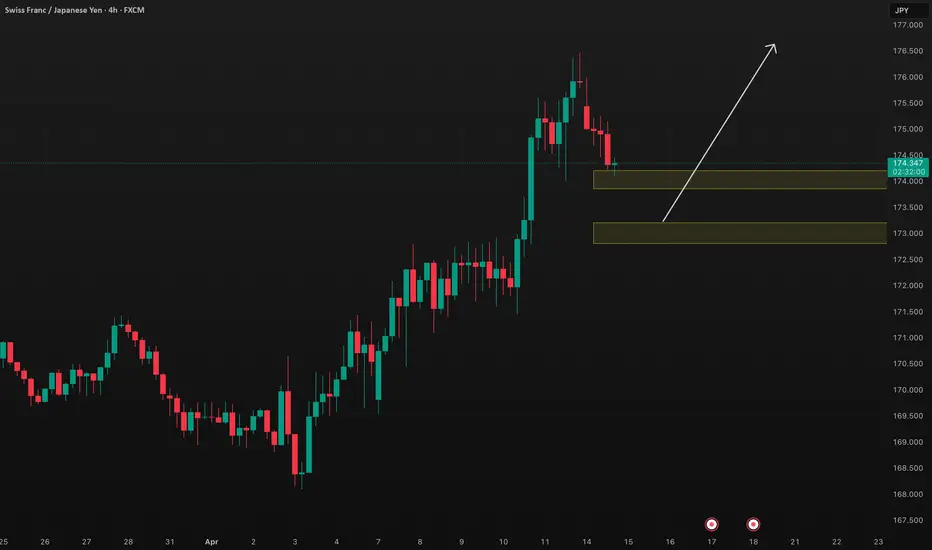
CHFJPY Buy OrdersCHFJPY will go up soon. I am looking at the first support at 174,399. I approached this trade with order blocks and an inverse head

16.04.25 Morning ForecastPairs on Watch -
FX:CHFJPY
FX:GBPAUD
FX:EURNZD
FX:USDJPY
A short overview of the instruments I am looking at for today, multi-timeframe analysis down to what I will be looking at for an entry. Enjoy!

CHFJPY Discretionary Analysis: Bouncing from the zoneHello traders.
CHFJPY is getting ready for the bounce. Start looking for a setup, if you are not already in.
Discretionary Trading: Where Experience Becomes the Edge
Discretionary trading is all about making decisions based on what you see, what you feel, and what you've learned through experience. Unlike systematic strategies that rely on fixed rules or algorithms, discretionary traders use their judgment to read the market in real time. It's a skill that can't be rushed, because it's built on screen time, pattern recognition, and the ability to stay calm under pressure.
There's no shortcut here. You need to see enough market conditions, wins, and losses to build that intuition—the kind that tells you when to pull the trigger or sit on your hands. Charts might look the same, but context changes everything, and that's something only experience can teach you.
At the end of the day, discretionary trading is an art, refined over time, sharpened through mistakes, and driven by instinct. It's not for everyone, but for those who've put in the work, it can be a powerful way to trade.

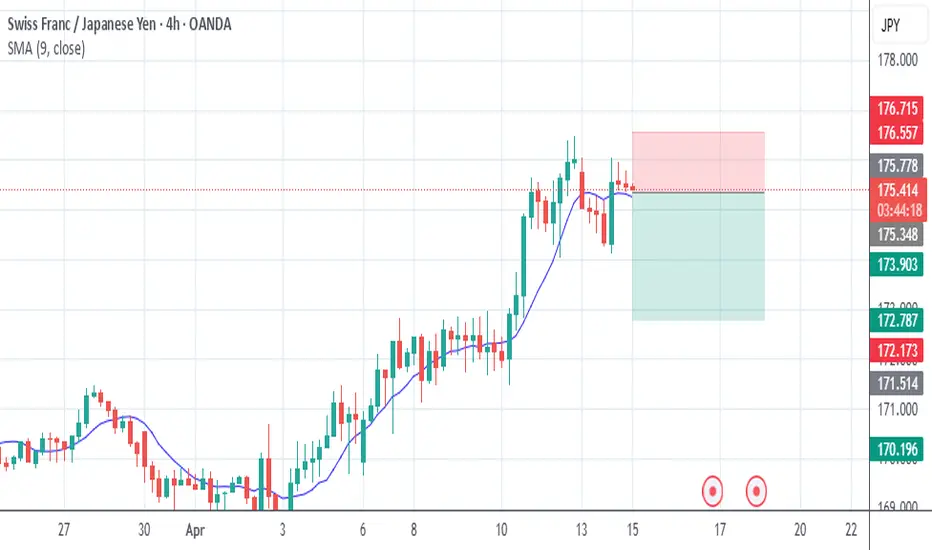
Daily Price Action: CHFJPY Tuesday 4/15/2025In this video, we will be looking into the potential price action of CHFJPY and going a little into the weekly chart and its correlation with the pair's potential movement.

LETS MAKE PROFIT.This should make you some money.
It is a setup using rsi and liquidity and smc all put together

chfjpy sell tradeThe Relative Strength Index (RSI) is showing a downward trend, indicating weakening momentum. Additionally, the Moving Average Convergence Divergence (MACD) is showing a bearish crossover, further supporting the potential for a downward move
CHFJPY BUY TRADE PLAN🔥 CHF/JPY TRADE PLAN – BUY SETUP
📅 Date: 14 April 2025
🔖 Plan Type:
Secondary Intraday Opportunity
📈 Bias & Trade Type:
Bullish Continuation
🔰 Confidence Level: ⭐⭐⭐ (70%)
Reasons / Confluences:
– Strong W1 & D1 bullish trend intact
– Bullish flag breakout on H1
– Demand imbalance below 174.00
– No break of structure yet on HTFs
– Yen weakness still evident intraday
📌 Status:
Not Triggered – Waiting for bullish confirmation from demand base
📍 Entry Zones:
🟩 Primary Buy Zone: 173.85 – 174.20
(OB + demand zone + fair value gap + 50 EMA zone)
🔁 Entry on M15–H1 bullish wick, engulfing, or divergence
🟨 Secondary Buy Zone: 172.80 – 173.20
(Liquidity sweep below consolidation + FVG + lower OB stack)
🔁 Entry only on clear rejection and reclaim of 173.20 zone
❗ Stop Loss:
Below 172.60
(Invalidates structure + breaks HTF demand)
🎯 Take Profits:
🎯 TP1: 175.30 → Previous high and imbalance fill
🎯 TP2: 176.00 → HTF supply top
🎯 TP3: 176.65 → Weekly high / liquidity magnet
📏 Risk:Reward:
Up to 1:3.8 depending on zone and trigger method
🧠 Management Strategy:
– Move SL to BE after TP1 hit
– Partial close at TP1, scale out at TP2
– Trail rest above 176.00 with EMA or fractal method
⚠️ Confirmation Criteria:
– M15–H1 bullish engulfing / divergence / demand reclaim
– RSI or OBV rising on entry trigger
– Volume expansion on breakout candles
⏳ Validity:
Valid 36 Hrs or upon structure break
🌐 Fundamentals:
– CHF strength driven by SNB neutral stance
– JPY still under pressure from dovish BOJ tone
– Overall risk-on sentiment lifting CHF/JPY
📋 Final Summary:
While the pair currently sits in HTF supply, price has yet to confirm any bearish continuation. Therefore, a short-term bullish continuation is possible on pullbacks into clean demand pockets below. This buy setup allows for strategic long positions as long as confirmation holds at key levels.
CHFJPY Is Trading Under a Strong Japanese Yen pressureHey Traders, in today's trading session we are monitoring CHFJPY for a selling opportunity around 174.800 zone, CHFJPY is trading in a downtrend and currently is in a correction phase in which it is approaching the trend at 174.800 support and resistance area.
Trade safe, Joe.

JPY continues to lose to CHF in the safe-haven gamesAlthough CHF and JPY are both seen as safe-havens, so far, CHF is dominating the field. Will CHF remain the more attractive currency for investors?
Let's dig in!
FX_IDC:CHFJPY
MARKETSCOM:CHFJPY
Let us know what you think in the comments below.
Thank you.
77.3% of retail investor accounts lose money when trading CFDs with this provider. You should consider whether you understand how CFDs work and whether you can afford to take the high risk of losing your money. Past performance is not necessarily indicative of future results. The value of investments may fall as well as rise and the investor may not get back the amount initially invested. This content is not intended for nor applicable to residents of the UK. Cryptocurrency CFDs and spread bets are restricted in the UK for all retail clients.

super Sell OPP.Hello traders. It's a very good time to enter sell position. The last low will be filled and after that market will go up for next time. (wink)


CHF/JPY BEARISH BIAS RIGHT NOW| SHORT
Hello, Friends!
CHF/JPY pair is trading in a local uptrend which we know by looking at the previous 1W candle which is green. On the 2H timeframe the pair is going up too. The pair is overbought because the price is close to the upper band of the BB indicator. So we are looking to sell the pair with the upper BB line acting as resistance. The next target is 172.964 area.
Disclosure: I am part of Trade Nation's Influencer program and receive a monthly fee for using their TradingView charts in my analysis.
✅LIKE AND COMMENT MY IDEAS✅

CHFJPY: Intraday Bullish Signal?! 🇨🇭🇯🇵
It looks like CHFJPY has completed a local correctional movement
after a formation of a strong bullish wave.
I see a violation of a resistance line of a falling wedge pattern as a confirmation.
Next goal - 175.72
❤️Please, support my work with like, thank you!❤️
