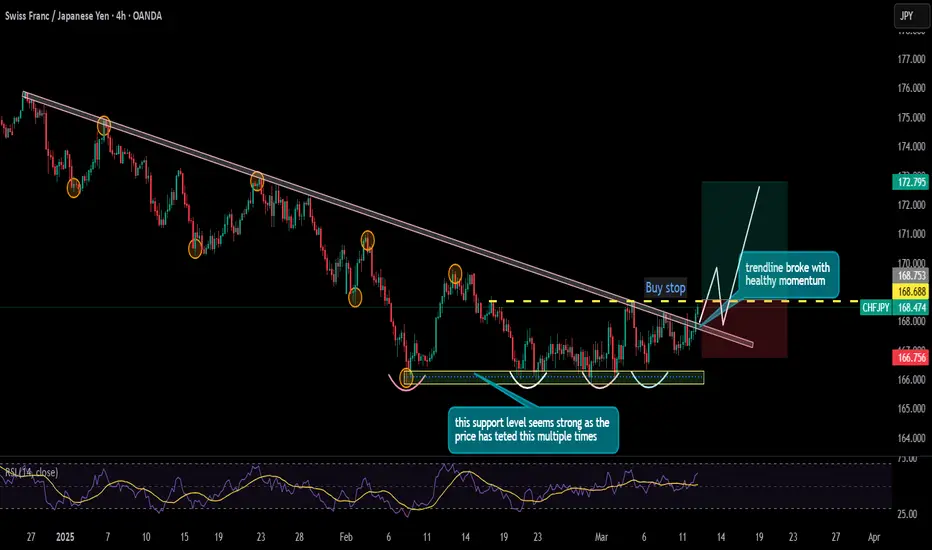
CHFJPY is gaining momentum to reverse the trendThe drawn support level looks quite good. The price tried a couple of times to break it but could not and is getting bounced instead. Buy stop order can be placed at 168.688 level or you can also wait for the price to move upwards and then wait for the retracement in this way it will be a confluence of the bullish trend. I am aiming at 1:2 RR; let’s see where it goes
CHFJPY trade ideas
CHFJPYCHFJPY is building good bullish momentum. Currently the pair is facing a minor resistance at 168.80 region.
If the price successfully break this level, bulls can take charge and can push the price even higher.

CHFJPY My Opinion! SELL!
My dear subscribers,
My technical analysis for CHFJPY is below:
The price is coiling around a solid key level - 168.11
Bias - Bearish
Technical Indicators: Pivot Points Low anticipates a potential price reversal.
Super trend shows a clear sell, giving a perfect indicators' convergence.
Goal - 167.35
About Used Indicators:
By the very nature of the supertrend indicator, it offers firm support and resistance levels for traders to enter and exit trades. Additionally, it also provides signals for setting stop losses
———————————
WISH YOU ALL LUCK

Lingrid | CHFJPY primed for a DOWNSIDE Breakout. ShortThe price perfectly fulfilled my previous idea. It reached the target. The price has pulled back from the resistance level after forming a false breakout of the consolidation zone. On the daily timeframe, we can observe a choppy market with price moving sideways. The market is still trading within the weekly range formed in the second week of February. I believe the price may fall below the trendline and potentially retest the recent lower low level. Looking at the price action, we can see that it is forming a large triangle pattern, which seems to be poised for a downward movement. Moreover, the current price squeeze is likely to result in a breakout, and I expect the market to move lower since we have a round number at 168.000 above and the downward trendline. My goal is support zone around 165.100
Traders, if you liked this idea or if you have your own opinion about it, write in the comments. I will be glad 👩💻

#050 Trust The Process 1112SGT 11032025Buying the body. Price is in a range on the 15 minutes time frame, and seem to has touched the support zone, currently going upwards.
So, I am buying.
I do the opposite is true on oanda mt4.
1113SGT 11032025

CHFJPY is in the Buying DirectionHello Traders
In This Chart CHFJPY HOURLY Forex Forecast By FOREX PLANET
today AUDCAD analysis 👆
🟢This Chart includes_ (CHFJPY market update)
🟢What is The Next Opportunity on CHFJPY Market
🟢how to Enter to the Valid Entry With Assurance Profit
This CHART is For Trader's that Want to Improve Their Technical Analysis Skills and Their Trading By Understanding How To Analyze The Market Using Multiple Timeframes and Understanding The Bigger Picture on the Charts

Daily outlook for CHFJPY shortsWill want to see a retest on a resistance zone with a flipped in price to the down side to confirm the sell.

Potential Buy Opportunity On CHFJPYReasons why I think this pair will rise:
- Bullish RSI divergence on Daily Chart
- RSI at 50 on Daily Chart
- Double bottom on Daily chart. Price failed to make a lower low
What do you think?

CHF/JPY For Bullishyou can go long now
or
wait for entry point as pull-back and then go long
have fun :)

CHFJPY - BullishCHFJPY has formed a double bottom and currently testing its trend line. Buy on breakout of trendline and previous high.

CHF/JPY SHORT FROM RESISTANCE
Hello, Friends!
CHF/JPY is trending down which is clear from the red colour of the previous weekly candle. However, the price has locally surged into the overbought territory. Which can be told from its proximity to the BB upper band. Which presents a classical trend following opportunity for a short trade from the resistance line above towards the demand level of 164.774.
✅LIKE AND COMMENT MY IDEAS✅

#045 Trust The Process CHFJPY 1004SGT 05032025 2RPrice broke out of the resistance level, so, buy.
I adjusted some things. I am taking 2R TP instead of 1.5R TP.
I will be marking this new TP arrangement with the marking in the title with "2R" at the back.
I would also be opening a new account, maybe on oanda demo account to tabulate the PNL.
1010SGT 05032025

My A plus entryEntry 3pin - doji one of the best reversal
head and shoulders.
order block
H4
fibs 61.8

CHFJPY 2500 PIP TARGET LIVE TRADE Key Factors Influencing CHF/JPY:
Interest Rate Differentials:
The monetary policies of the Swiss National Bank (SNB) and the Bank of Japan (BOJ) play a crucial role. If the BOJ signals a potential tightening of its monetary policy (raising interest rates), while the SNB maintains or loosens its policy, it could lead to a weakening of the CHF/JPY pair. Conversely, if the SNB tightens and the BOJ loosens, the pair will go up.
Differentials in interest rates between the two countries can significantly impact currency flows.

CHFJPY IN BULLISH TRENDTechnically:
CHFJPY supporting bullish trendline
CHFJPY has no bearish divergence

#CHFJPY Buy Setup#CHFJPY Buy Setup
Currently Trading At 167.143 , Buy Dip Till 166.495 For The Target 171.010

CHFJPY at Key Support Level - Potential Buy SetupOANDA:CHFJPY is at a significant demand zone that has consistently triggered bullish reversals in the past. This zone has previously acted as a strong support level and now as price tests this area again, it creates a potential opportunity for buyers to regain control.
I expect the price to move toward 168.60. On the other hand, a break below this support could signal further downside.
Just my take on support and resistance zones—not financial advice. Always confirm your setups and trade with solid risk management.

CHFJPY - Important BreakoutHello Traders !
The CHFJPY reached the support level (0.82759 - 0.82602).
Currently, The lower high is broken (change of character)
So, I predict a bullish move🚀
_______________
TARGET: 169.200🎯

CHFJPY-TREND REVERSAL?CHFJPY can reverse its trend to bullish as it has shows buying potentials as it formed double bottom along with a bullish divergence and breakout bearish channel.

CHF/JPY Market Analysis – Potential Bearish Move Ahead? 🔹 Current Market Structure:
The CHF/JPY pair is currently trading within an indecisive area, facing key levels that will determine its next move. The price recently tested a strong resistance zone and is now showing signs of weakness.
🔹 Key Observations:
1️⃣ Indecisive Area – Price is consolidating within a small range. A breakout will provide confirmation of direction.
2️⃣ Needed Volume Zone – This area needs strong momentum to continue further downward movement. If the price fails to sustain below this level, we might see a short-term pullback.
3️⃣ Reversal Area – If price continues its descent, this zone could act as a potential support and trigger a reversal.
🔹 Trade Outlook:
📌 A candle close below the indecisive area will strengthen bearish momentum, increasing the probability of price reaching the needed volume zone and eventually the reversal area.
📌 However, a strong bullish rejection from the current level could lead to a pullback towards the previous resistance zone.
⚠️ Stay patient and wait for confirmation before entering a trade!
What are your thoughts on this setup? Let me know in the comments! 💬👇
#Forex #CHFJPY #Trading #TechnicalAnalysis #PriceAction

CHFJPY LongCHFJPY is now Net-Long on the Regression break.
This could move back to the top of the recent consolidation

chfjpy is bearish the pair is trying to reach to its support after failing to break trendline and now is heading south temporarily
cup and handle pattern is already made and we are waiting for the result

CHFJPY Under Pressure! SELL!
My dear friends,
Please, find my technical outlook for CHFJPY below:
The price is coiling around a solid key level - 167.74
Bias - Bearish
Technical Indicators: Pivot Points Low anticipates a potential price reversal.
Super trend shows a clear sell, giving a perfect indicators' convergence.
Goal - 166.88
About Used Indicators:
The pivot point itself is simply the average of the high, low and closing prices from the previous trading day.
———————————
WISH YOU ALL LUCK
