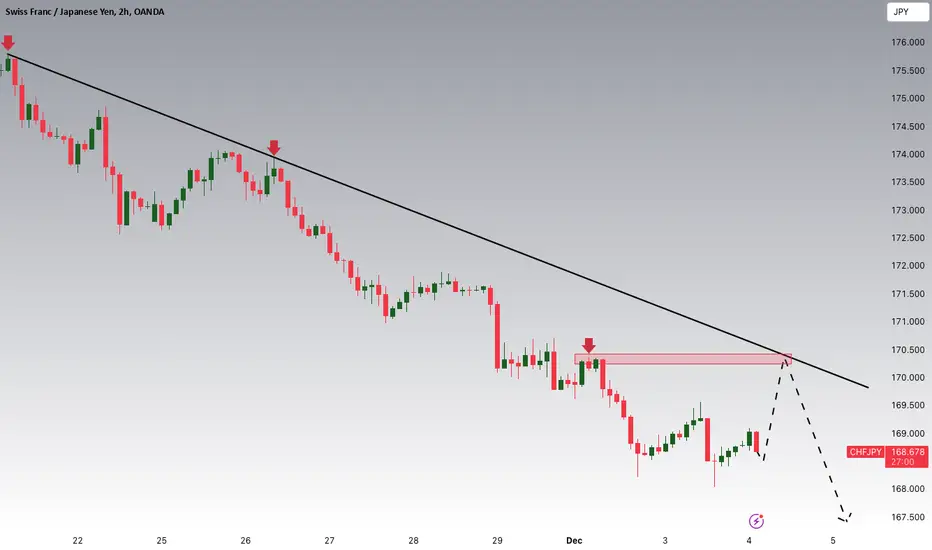
CHFJPY Wave AnalysisThe trend seems to have ended in this timeframe and we should wait for the start of a downtrend
Trade Entry: Range 171.150
Stop Loss: 172.750
Take Profit: 167.540
This offer has a risk/reward ratio of around 2.5
Make sure to involve less than 2-3% of your total capital and stick to money management principles
This is just a suggestion for consideration
CHFJPY trade ideas

CHFJPY - Downside move !!Hello traders!
‼️ This is my perspective on CHFJPY.
Technical analysis: Here we are in a bearish market structure from daily timeframe perspective, so I look for a short. I expect bearish price action after price filled the imbalance and rejected from bearish OB.
Fundamental news: Upcoming week on Thursday (GMT+2) we will see results of Interest Rate on CHF. News with high impact on currency.
Like, comment and subscribe to be in touch with my content!

CHF JPYCHF JPY is making higher highs and higher lows and is currently on trend line. A long position can be considered with SL below last higher low.

CHF/JPY confirmation with entering ascending channelHi dear investors, our next opportunity that we would look into is the CHF/JPY, with it's past attemp to touch the strong support level , there has been a lot of support which came from buyers which pushed the pair into an ascending channel, the lower Strong Support level was not able to be touched this is why we are seing a trend reversal.
The RSI recently got out of the 30 level and we would set up our targets into the upper level of the RSI at the 51 and 60 marks.
Entry : 169.550
Target 1 : 170.630
Target 2 : 171.810
SL level : 168.155
When target 2 is reached we would look for additional confirmations so we can set up our 3rd target at the level of - 174.06
As always my friends happy trading!
P.S. If you have questions or inquiries about one of my existing set-ups or personal questions / 1 on 1 sessions consider joining my channel so you can follow up with me in private!

CHFJPY trade ideaAfter giving us a double bottom rejection to change direction. we had a break of structure and a break above a key zone followed by a retest to confirm to us a change of direction. we have a retest to a key zone and a rejection. anticipating a further movement to the upside

CHFJPY: Bearish wave of Channel Down unfolding.CHFJPY is bearish on its 1D technical outlook (RSI = 41.014, MACD = -1.180, ADX = 47.694) as it is more than halfway on the new bearish wave of the 5 month Channel Down. Having crossed under both the 1D MA50 and MA200, the 1D RSI appears to technically be on a level much like the July 25th rebound. This indicates that we are on an ideal sell entry. Short and target (TP = 164.300) the full -7.43% extension (the decline of the July-Aug bearish wave).
## If you like our free content follow our profile to get more daily ideas. ##
## Comments and likes are greatly appreciated. ##

chfjpy longchfjpy is long , as it has made a bullish divergence on 4h and a retracemnet for the bearish really is pending. so we aim fro the target of the fib 0.5 and hope for the best inshallha


CHFJPY BUY SETUPLooks like Yen is due for a correction after so much bullish momentum into yen which caused JPY pairs to dump across the board. Bullish Morning star formed at this level of demand which is a solid sign of more upside coming. I'll be looking for a buy opportunity on the pull back!

CHFJPY Potential DownsidesHey Traders, in today's trading session we are monitoring CHFJPY for a selling opportunity around 170 zone, CHFJPY is trading in a downtrend and currently is in a correction phase in which it is approaching the trend at 170 support and resistance area.
Trade safe, Joe.
CHFJPY in a Clear Bearish TrendCHFJPY in a Clear Bearish Trend
Since November 20, 2024, CHFJPY has begun a clear bearish wave, dropping nearly 700 pips in just two weeks.
Last week, the Bank of Japan (BOJ) reported higher inflation data. With this increase in inflation, it is likely that the BOJ will keep its promise to hike rates on December 19th.
In simple terms, the market is anticipating a rate hike from the BOJ at this meeting, which is why JPY continues to strengthen.
You may find more details in the chart!
Thank you and Good Luck!
❤️PS: Please support with a like or comment if you find this analysis useful for your trading day❤️

CHFJPY - 1H - Bullish Reversal CHFJPY has formed a bullish divergence on 1H timefame. Take entry on bullish side once last lower high is broken.

CHFJPY1-Seasonality: In Seasonals we can observe the CHFJPY pair remains Bullish.
2-Fundamentals(Exogenous Factors): Real GDP, IR Differential, BOP Relative, Stock Relative all are mix to Decreasing
3-Fundamentals(Endogenous Factors): for JPY factors are Increasing and CHF endogenous factors are mix to increasing.
4-Forex Conditional Scoring: Data is mix or mix to decreasing for both CHF & JPY
5-Global LEI & GDP: is overall increasing
Overall as we can say JPY index is in Buy and CHF index in sell, so we can expect increasing trend in CHFJPY.

CHFJPY - Bearish TrendCHFJPY will start Bearish Trend as Bearish Divergence is formed?
Entry, Stop Loss & Take Profit are mentioned.
CHF Fundamentals: SNB is reducing policy rates since March 2024, SNB rate cut as from 1.25% to 1% recently may result in weak CHF.
JPY Fundamentals: BOJ is increasing policy rates since March 2024, which is causing continuous strength in JPY.


CHFJPY - Short IdeaThe exogenous and endogenous factors are decreasing for the pair CHFJPY. However, CHFJPY's leading economic indicators are increasing. COT report RSI also shows that net positions are decreasing for CHF and net positions are increasing for JPY. Interest rate differential is also negative for the pair CHFJPY as IR for CHF decreases and increases for JPY.
Technically CHFPY is in a bearish trend making HHs and HLs and currently, it is at a strong Daily Support level. Wait for the retracement to fib 0.382 or 0.5 level to enter the trade. Place the stop loss on the previous LH.

CHF/JPY BULLS ARE STRONG HERE|LONG
Hello, Friends!
We are going long on the CHF/JPY with the target of 172.401 level, because the pair is oversold and will soon hit the support line below. We deduced the oversold condition from the price being near to the lower BB band. However, we should use low risk here because the 1W TF is red and gives us a counter-signal.
✅LIKE AND COMMENT MY IDEAS✅

CHFJPY: One More Buying Opportunity 🇨🇭🇯🇵
One more buying opportunity for today is on CHFJPY pair.
After a test of key daily support, the price formed an ascending
triangle pattern on an hourly.
We see a positive bullish reaction of the price after a breakout of its neckline.
The pair may reach 169.45 level soon.
❤️Please, support my work with like, thank you!❤️

CHFJPY Short IdeaCHFJPY Short Idea
COT Report
- Non Commercials are reducing there position in CHF, showing weakness in CHF.
- Non Commercials started taking long positions in JPY, showing strength in JPY.
Endogenous Factors
- JPY score after all indicators is +3 and +4 for last two months
- CHF score after all indicators is -2 and -1 for last two months
- JPY looks stronger and CHF weaker in Leading Economic Indicators
Exogenous Factors
- JPY Interest Rates and Real GDP are getting stronger.
- CHF Interest Rates and Real GDP are getting weaker.
Seasonality
- December is usually a bullish month for CHFJPY, but this time exogenous and endogenous factors, the fundamentals of both currencies, are not looking in favor of the seasonality.
News Catalyst
Expecting a negative or equal to last month CPI data for CHF releasing on Tuesday. This may keep the trend of CHF JPY bearish for next few days as well.
Trade Plan
Place a Sell Limit near Order block or between 32%-50% retracement on h4, expecting it to be triggered before or at CPI news release.
SL is above h4 recent swing high.

CHFJPY - YEN RETRACEMENT OVER?The fib .618 gives the Yen a very strong support looking at the daily Index chart for Japanese Yen. Yen has been ranging within the last 2 weeks sitting right on top of the fib.618 level but yesterday broke out of range with that long green elephant bar.
A break below 172.6 level could see this pair drop harder as it has failed to reach previous high and presently consolidating.
A near perfect Broadening wedge formation somewhat indicating a reversal is looming after a long bullish trend. Usually in this case if current swing fails to reach previous high or break above it, we anticipate price to drop hard targeting Price objective for Broadening Wedge formation (160.80).
Looking out for potential SHORT scalps on this pair on the break of 172.60 level targeting next support (W1) of 169.25.
A break & close above resistance will nullify analysis.

CHF/JPY continues the downtrendOn CHF/JPY , it's nice to see a strong sell-off from the price of 171.540 and 172.500. It's also encouraging to observe a strong volume area where a lot of contracts are accumulated.
I believe that sellers from this area will defend their short positions. When the price returns to this area, strong sellers will push the market down again.
Support from the past and high volume cluster are the main reasons for my decision to go short on this trade.
Happy trading,
Dale

CHFJPY - Ascending TriangleCHFJPY is making Ascending Triangle Pattern, will it breakout to reach target?
Entry, Stop Loss & Take Profit are mentioned.
CHF Fundamentals: SNB is reducing policy rates since March 2024, SNB rate cut as from 1.25% to 1% recently may result in weak CHF.
JPY Fundamentals: BOJ is increasing policy rates since March 2024, which is causing continuous strength in JPY.

Institutional Demand: CHF/JPY longsHey,
The main pair on watch for me for the upcoming 48 hours is CHF/JPY.
Price is within daily demand and soon reaching weekly value as well.
I've adjusted the daily zone according to the HTF's.
When this zone is reached, I'll wait for entry confirmation on the LTF's.
Same plan as always.
Make sure to watch my videos to learn more.
Oh and boost this post :)
Kind regards,
Max
