NZDCHF Forming Bullish ContinuationNZDCHF has been consolidating above a well-defined support zone near the 0.4720–0.4750 region, as seen clearly on the 12H chart. Price has reacted multiple times to this demand area, forming a potential accumulation base. Recent candlestick structure is signaling rejection of lower prices, with buye
Related currencies

NZDCHF Remains Heavily Influenced By The SNBNZDCHF Remains Heavily Influenced By The SNB
NZDCHF remains heavily influenced by the Swiss National Bank (SNB), which continues to control the value of several currencies.
Despite this, NZDCHF looks significantly oversold. All it may need is time before a bullish wave begins to unfold.
Meanwh

NZDCHF – Bullish Breakout Sets Stage for ReversalNZDCHF has broken decisively out of a long-term descending channel, signaling a potential trend reversal. Price action confirmed multiple bullish flags within the falling structure, followed by a clean breakout and higher low retest, supporting a bullish continuation bias.
Currently, the pair is st

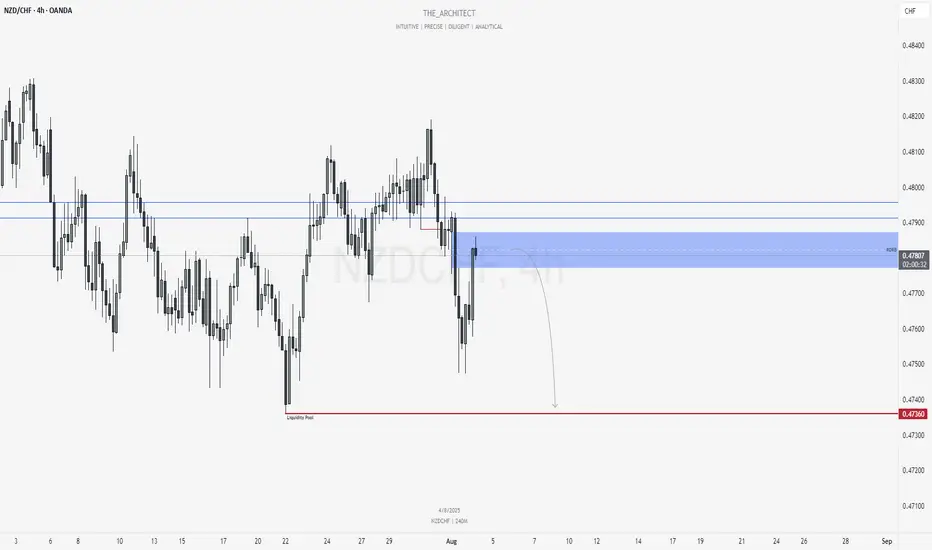
NZDCHF: Bearish Continuation from Re-Delivered Re-Balanced ArrayGreetings Traders,
In today’s analysis of NZDCHF, recent price action confirms the presence of bearish institutional order flow. As a result, we aim to align ourselves with this directional bias by identifying strategic selling opportunities.
Key Observations on H4:
Bearish Market Structure S
NZD-CHF Risky Long! Buy!
Hello,Traders!
NZD-CHF keeps falling and
Will hit the horizontal support
Of 0.4738 on Monday from
Where we will be expecting
A local rebound and a
Bullish move up
Buy!
Comment and subscribe to help us grow!
Check out other forecasts below too!
Disclosure: I am part of Trade Nation's Inf

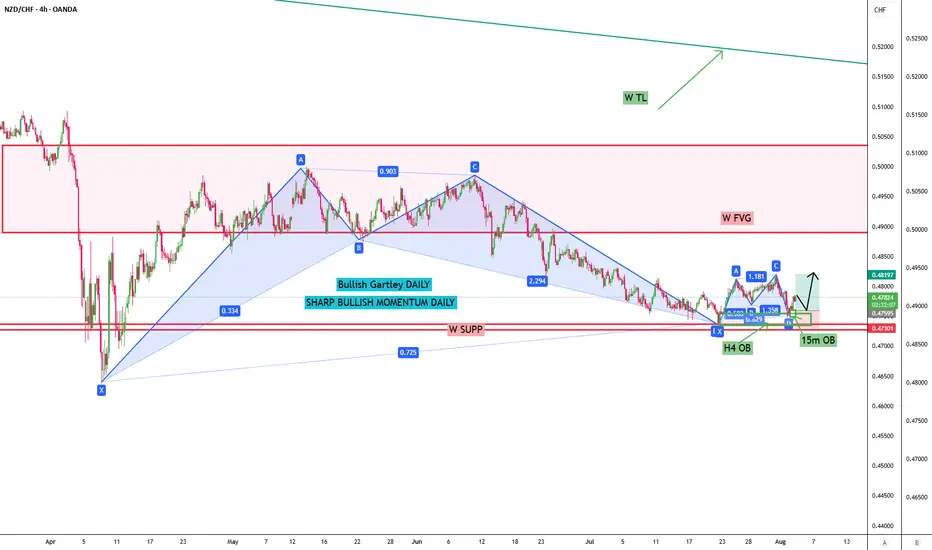
NZDCHF POTENTIAL BULLISHWeekly chart shows NZDCHF has bounced off its minimum since 2004, with RSI showing just recovering from the OS area. Price has bounced back from the weekly resistance around 0.47400. This bounce has formed a bullish Gartley on the daily chart and another bullish Gartley on the H4 timeframe. It was s
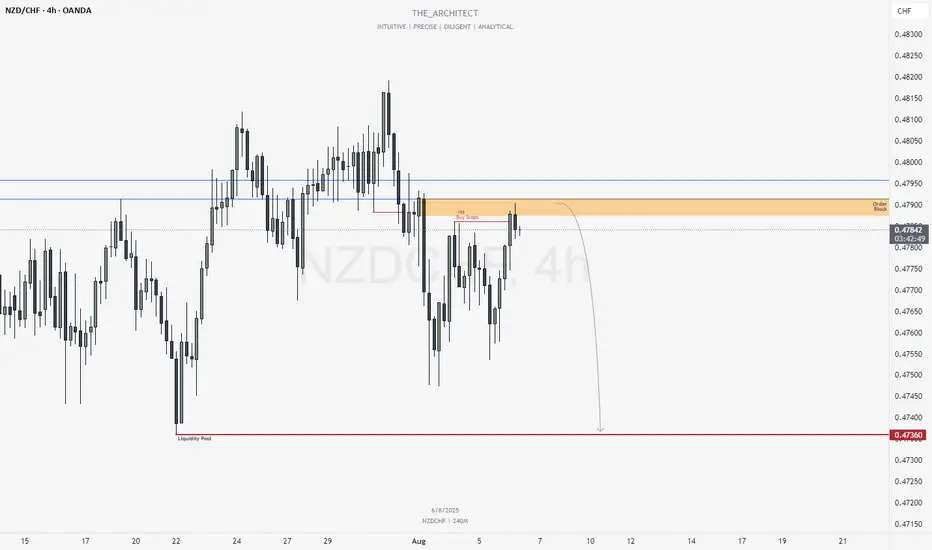
NZDCHF: Selling Within Bearish Order Flow & Order BlockGreetings Traders,
In today’s analysis of NZDCHF, recent price action confirms the presence of bearish institutional order flow. As a result, we aim to align ourselves with this directional bias by identifying strategic selling opportunities.
🔍 Key Observations on H4:
Bearish Market Structure
Behold the legendary NZD/CHF long setupBehold the legendary NZD/CHF long setup, powered by my top-secret pyramidal formula buried deep within the Great Pyramid’s King’s Chamber (and heavily guarded by irritable golden scarabs):
Kiwi Pharaoh’s Pivot Points
– We superimpose NZD/CHF swings onto the four hidden pyramid chambers. When price

NZD/CHF BEST PLACE TO SELL FROM|SHORT
NZD/CHF SIGNAL
Trade Direction: short
Entry Level: 0.479
Target Level: 0.477
Stop Loss: 0.481
RISK PROFILE
Risk level: medium
Suggested risk: 1%
Timeframe: 6h
Disclosure: I am part of Trade Nation's Influencer program and receive a monthly fee for using their TradingView charts in my analysis.

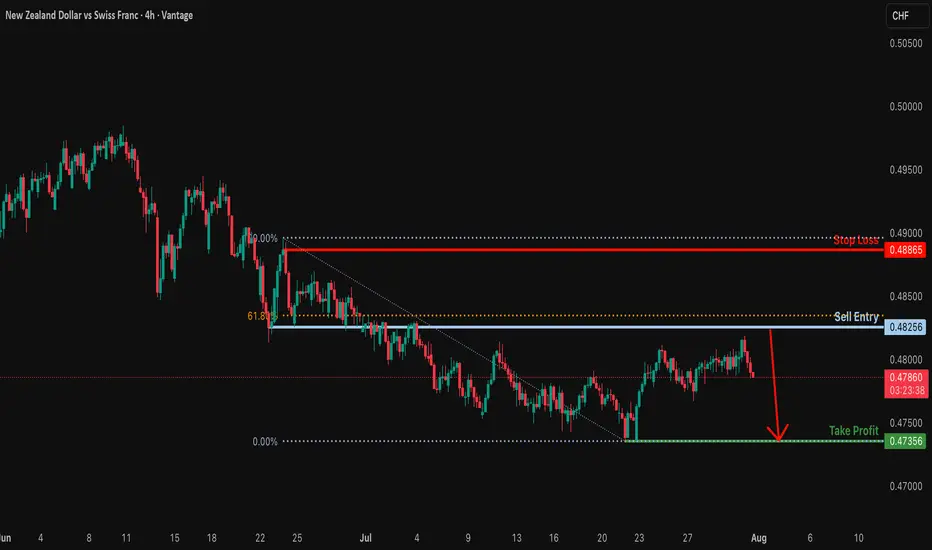
Bearish drop?The NZD/CHF is rising towards the resistance level, which is a pullback resistance that is slightly below the 61.8% Fibonacci retracement. It could drop from this level to our take-profit.
Entry: 0.48256
Why we like it:
There is a pullback resistance that is slightly below the 61.8% Fibonacci retra
See all ideas
Summarizing what the indicators are suggesting.
Oscillators
Neutral
SellBuy
Strong sellStrong buy
Strong sellSellNeutralBuyStrong buy
Oscillators
Neutral
SellBuy
Strong sellStrong buy
Strong sellSellNeutralBuyStrong buy
Summary
Neutral
SellBuy
Strong sellStrong buy
Strong sellSellNeutralBuyStrong buy
Summary
Neutral
SellBuy
Strong sellStrong buy
Strong sellSellNeutralBuyStrong buy
Summary
Neutral
SellBuy
Strong sellStrong buy
Strong sellSellNeutralBuyStrong buy
Moving Averages
Neutral
SellBuy
Strong sellStrong buy
Strong sellSellNeutralBuyStrong buy
Moving Averages
Neutral
SellBuy
Strong sellStrong buy
Strong sellSellNeutralBuyStrong buy
Displays a symbol's price movements over previous years to identify recurring trends.
Frequently Asked Questions
The current rate of CHFNZD is 2.0771 NZD — it has decreased by −0.16% in the past 24 hours. See more of CHFNZD rate dynamics on the detailed chart.
The value of the CHFNZD pair is quoted as 1 CHF per x NZD. For example, if the pair is trading at 1.50, it means it takes 1.5 NZD to buy 1 CHF.
The term volatility describes the risk related to the changes in an asset's value. CHFNZD has the volatility rating of 0.29%. Track all currencies' changes with our live Forex Heatmap and prepare for markets volatility.
The CHFNZD showed a −0.61% fall over the past week, the month change is a −0.83% fall, and over the last year it has increased by 8.31%. Track live rate changes on the CHFNZD chart.
Learn how you can make money on rate changes in numerous trading ideas created by our community.
Learn how you can make money on rate changes in numerous trading ideas created by our community.
CHFNZD is a minor currency pair, i.e. a popular pair that is not associated with USD. Such pairs are also called cross currency pairs.
Currencies are usually traded through forex brokers — choose the one that suits your needs and go ahead. You can trade CHFNZD right from TradingView charts — just log in to you broker account. Check out the list of our integrated brokers and find the best one for your needs and strategy.
When deciding to buy or sell currency one should keep in mind many factors including current geopolitical situation, interest rates, and other. But before plunging into a deep research, you can start with CHFNZD technical analysis. The technical rating for the pair is neutral today, but don't forget that markets can be very unstable, so don't stop here. According to our 1 week rating the CHFNZD shows the buy signal, and 1 month rating is buy. See more of CHFNZD technicals for a more comprehensive analysis.